US common stocks / ADRs: top 10 by volume; top 10 gainers (by % change, volume as tie-breaker); top 10 losers (by % change, prefer liquid names). Deep notes cover the de-duplicated set across the three boards.
30 names on this page · volume 10 · gainers 10 · losers 10
Order: volume board → gainers → losers; each ticker appears once. Summaries of public information only — please verify primary sources.
1/10NVDA NVDA
+0.57%
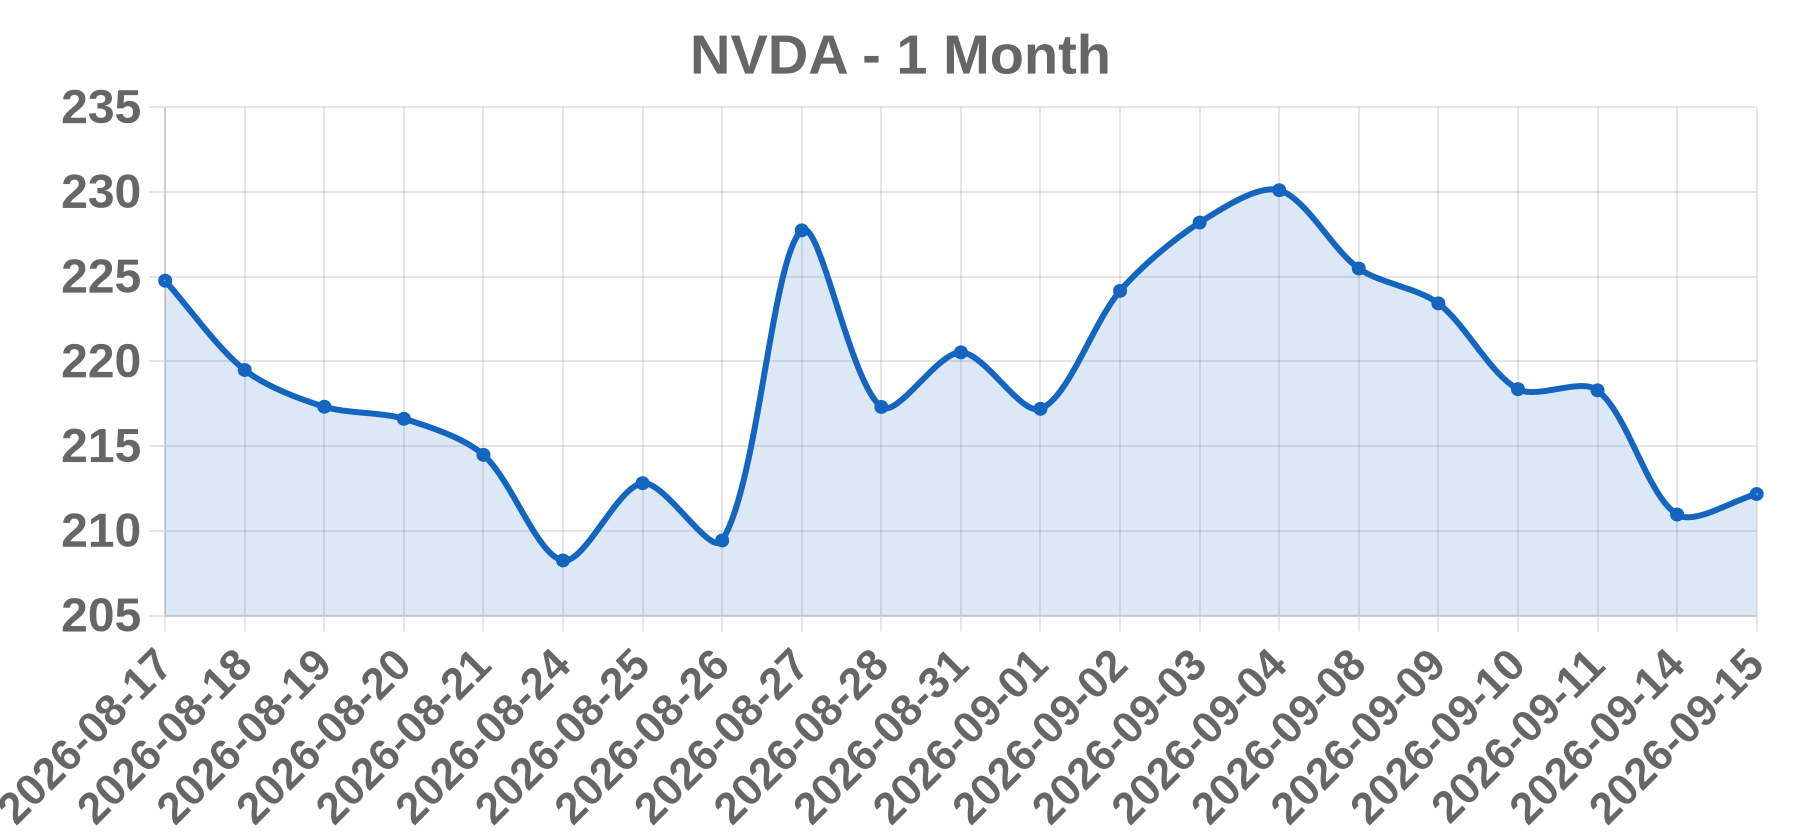
Close 212.17 · Vol 85.17M · Type: Sector
Approx. 1-month price (illustrative)
Business NVIDIA Corporation, listed on the Nasdaq Global Select Market under ticker NVDA, is a fabless semiconductor designer. Its Data Center segment supplies AI and machine-learning accelerators, networking, and DGX systems, while its Gaming segment sells GeForce GPUs alongside Professional Visualization, Automotive, and OEM products. Manufacturing is outsourced, primarily to TSMC, and revenue is concentrated in hyperscaler and enterprise AI capital spending.
Today’s take NVDA closed at $212.17 on 2026-09-15, up $1.20 or 0.57%, on 85.17 million shares. The move is well inside NVDA's normal daily range of roughly 2-4% and is too small to indicate an earnings, guidance, or M&A event, which typically move the stock 5% or more. No same-day company-specific headline was retrievable for this session, so the print is best classified as sector or flow related rather than idiosyncratic news. With no confirmed fundamental trigger, the most plausible reading is mechanical: index and ETF rebalancing flows, options-related dealer hedging into a mid-month expiration, and broad semiconductor or mega-cap tech rotation. Conviction is low. Verification requires checking the 20-day and 65-day average volume, a same-day wire for peer or macro news, and whether 2026-09-15 coincided with an index event or monthly options expiration.
Business Intel Corporation (NASDAQ: INTC) designs and manufactures microprocessors, chipsets, and platform products, holding leading positions in client computing and data center/server CPUs. The company also operates Intel Foundry for external contract manufacturing and majority-owns Altera (FPGAs) and Mobileye (ADAS/autonomous driving). Intel is executing a multi-year transition toward a dual model combining internal product groups with an external-customer foundry services business.
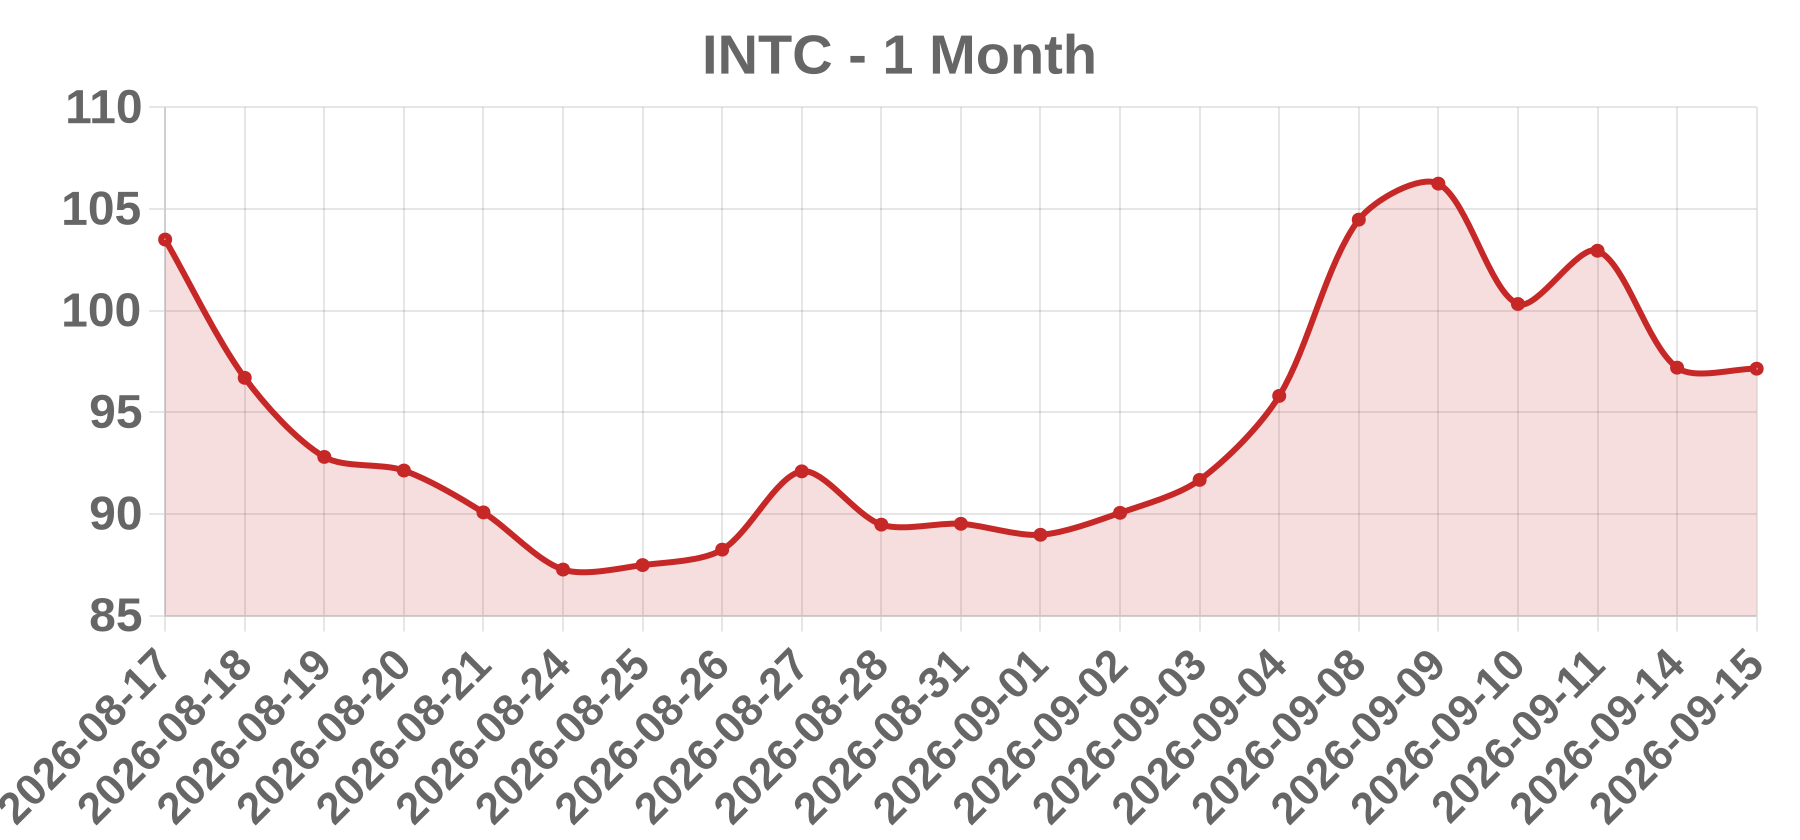
Today’s take Intel closed at $97.14, down $0.05 or 0.05%, on 83.6M shares — a high-turnover session with an essentially flat price outcome. That combination argues against a discrete fundamental surprise and is more consistent with offsetting headlines, non-fundamental flow, or index- and options-related churn. No confirmed same-day, company-specific catalyst was identified in this review; the appropriate catalyst classification is therefore OTHER, and short-squeeze and earnings-surprise scenarios are ruled out on tape evidence (no gap, no directional impulse). The dominant equity drivers remain Intel Foundry advanced-node execution (18A/14A) and external customer commitments, with government/sovereign stake and subsidy developments as a secondary swing factor. Investors should treat the active-screen appearance as a volume/flow event rather than a news event until same-day headlines and average-volume baselines are verified.
Business Nokia Oyj is a Finnish public limited company headquartered in Espoo, Finland, primarily listed on Nasdaq Helsinki (NOKIA.HE) and traded in the US as an NYSE ADR under the ticker NOK. It supplies network infrastructure and mobile networks equipment, including optical and IP routing, 5G/4G radio access networks, cloud and network services software, and patent licensing through Nokia Technologies. Its customer base is global telecom operators, hyperscalers, and enterprises.
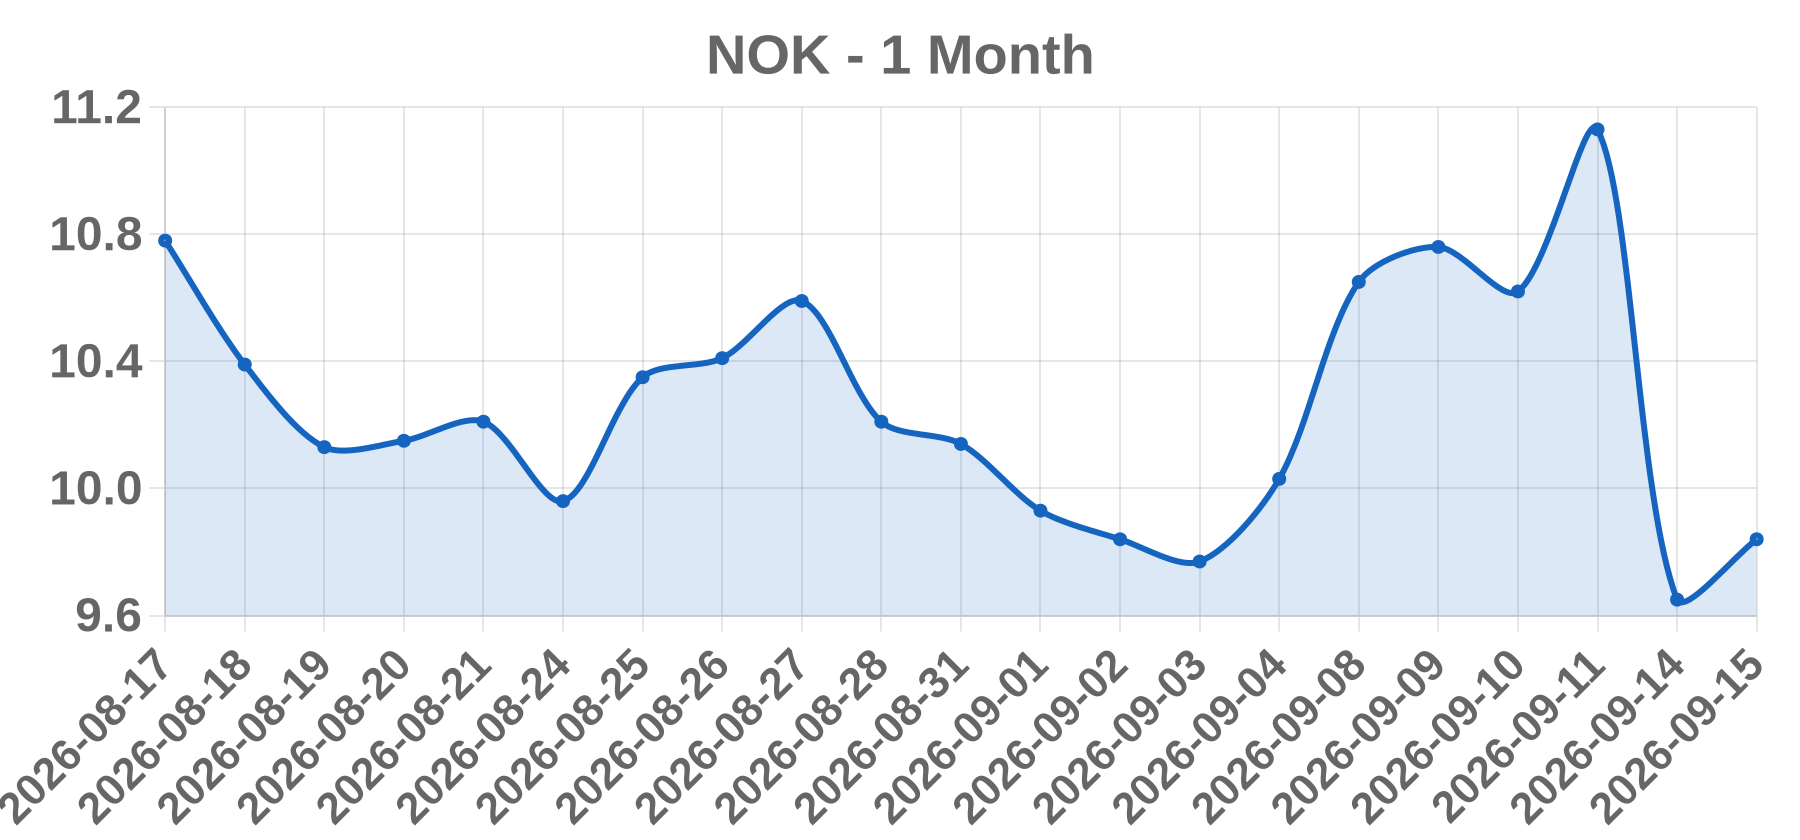
Today’s take Nokia ADR rose 1.97% to 9.84 on 83.58M shares, a move that is modest in magnitude for a large-cap and shows no characteristics of an earnings gap, M&A announcement, or guidance revision, which typically produce 5-15%+ moves in NOK. The WSJ_ACTIVES designation more likely reflects structural liquidity, index and ETF membership, derivative expiry or roll, and ADR arbitrage against the Helsinki primary listing (NOKIA.HE) rather than confirmed company-specific news. Candidate drivers remain unverified and include a sector read-across from telecom-equipment peers (Ericsson, Ciena), a single broker upgrade or target raise, macro/FX effects on the euro-denominated business, or contract and product news. The 3-month average daily volume must be pulled live to compute RVOL; without it, elevated volume cannot be attributed to a short squeeze or an event, and no specific catalyst should be published as confirmed.
Business American Airlines Group Inc. is the holding company for American Airlines, Inc., one of the world's largest passenger airlines by fleet size and revenue passenger miles. Its operations span domestic and international passenger travel, regional carriers, cargo, and the AAdvantage loyalty program, with major hubs at Dallas/Fort Worth, Charlotte, Chicago O'Hare, Miami, Phoenix, Philadelphia, Washington National, and Los Angeles. The stock trades on Nasdaq under the ticker AAL.
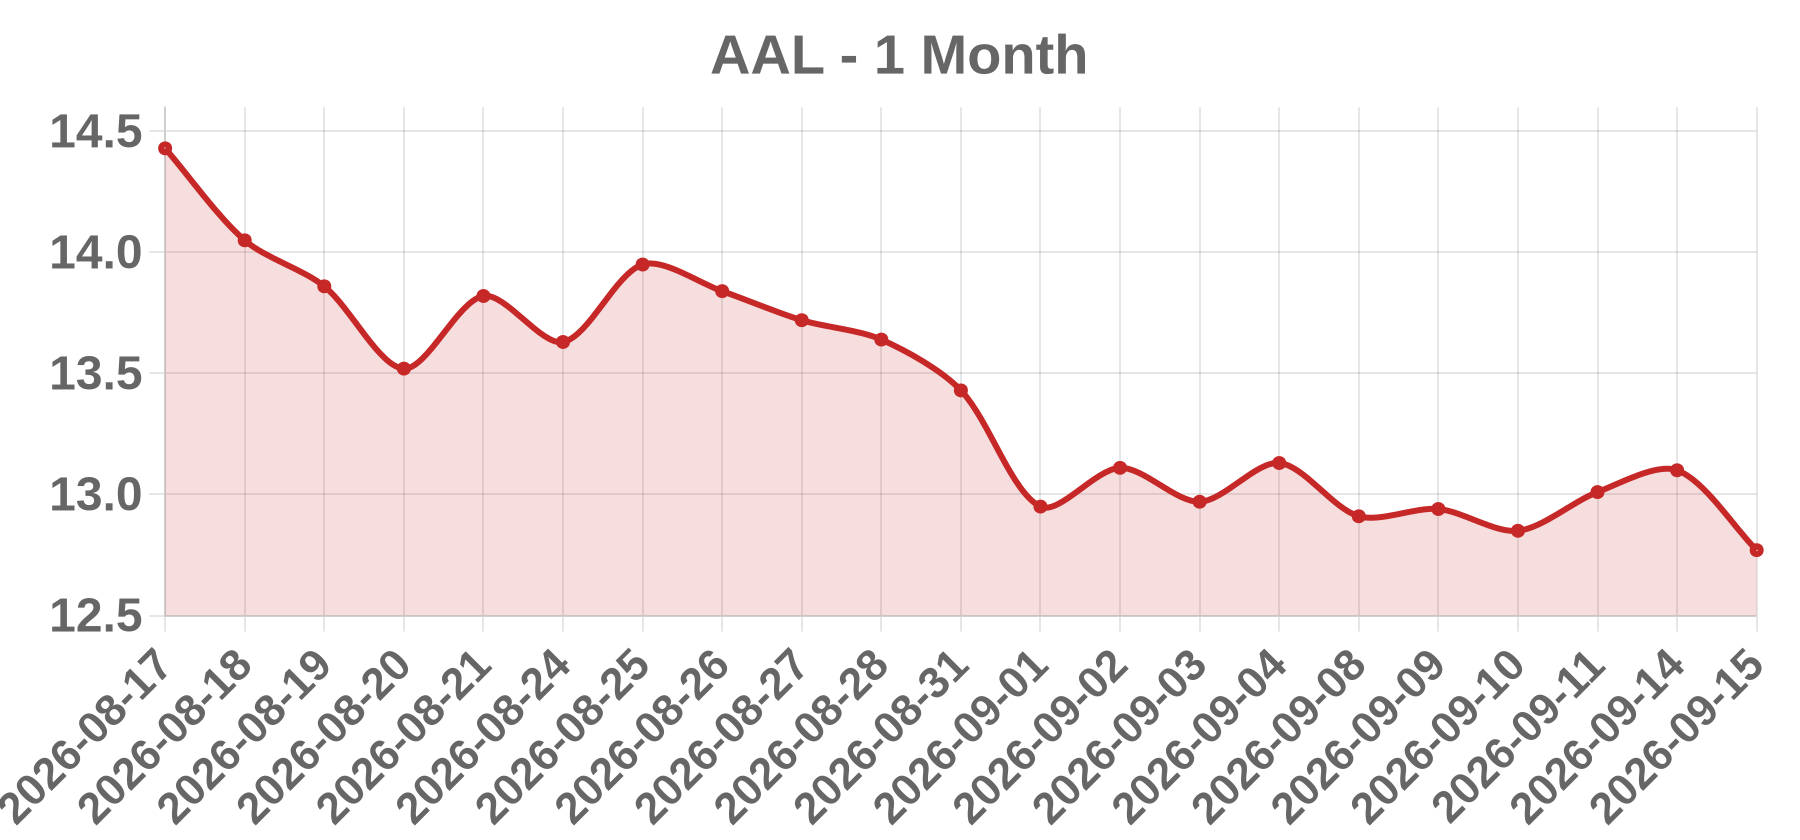
Today’s take AAL closed at $12.77 on 2026-09-15, down $0.33 or -2.52%, on 82,580,000 shares. The decline is modest in percentage terms but arrived on unusually heavy turnover, which points to institutional distribution rather than an isolated company event. No AAL-specific 8-K, guidance release, or dated wire headline tied to that session could be verified through search, so the move is best classified as a sector or macro sympathy trade. The most plausible drivers are airline-sector news flow — peer unit-revenue or capacity commentary from DAL, UAL, or LUV — or a crude/jet-fuel price move compressing margin expectations. A downgrade or price-target cut is possible but unconfirmed. Note that the session date, the closing print, and the volume figure are unverified against primary sources; these should be checked against AAL's IR page, SEC EDGAR 8-K filings, and EIA jet-fuel data before publishing.
Business UiPath Inc. is a New York Stock Exchange-listed enterprise software company best known for its robotic process automation (RPA) platform, which helps organizations automate repetitive business workflows. It has expanded into agentic automation and AI-powered document understanding, selling primarily to large enterprises through subscription licenses.
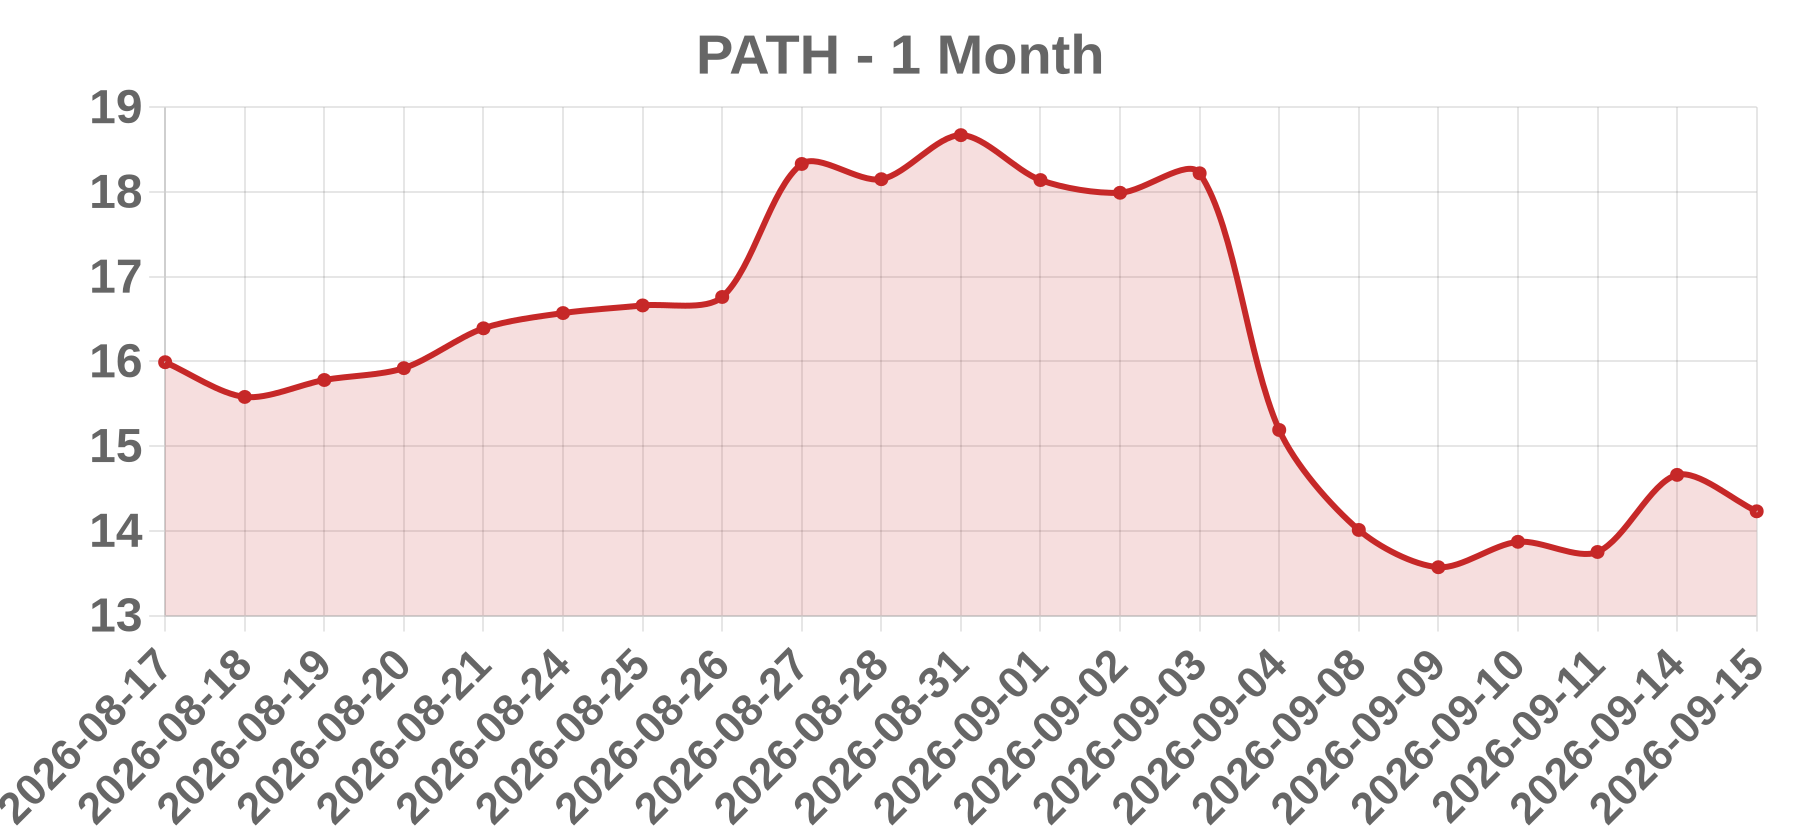
Today’s take UiPath (PATH) fell 2.93% to close at 14.23 on September 15, 2026, on heavy volume of about 71.8 million shares. The move needs to be framed cautiously: no company-specific press release, 8-K, or confirmed analyst action was found in the research notes, so the decline looks more like a high-beta continuation of a weak enterprise-software tape rather than a single identifiable event. PATH remains a battleground stock whose valuation hinges on whether agentic AI expands or cannibalizes its core RPA franchise. When sentiment toward AI-adjacent software sours, PATH often amplifies the move because its multiple still embeds long-duration growth that investors repeatedly re-price. A nearly 3% down day on roughly double normal turnover is consistent with institutional de-risking ahead of quarterly earnings and macro data, not a fundamental break. Until a verified filing, guidance change, or downgrade surfaces, traders should treat this as sentiment-driven volatility and watch whether the 14-dollar area holds as support.
Business Space Exploration Technologies Corp. (SpaceX) is a privately held American aerospace manufacturer and space transportation company, founded in 2002. It designs and operates reusable launch vehicles (Falcon 9, Falcon Heavy, Starship), Dragon spacecraft, and the Starlink satellite broadband constellation. No verification exists that its equity trades under the ticker "SPCX" on any major U.S. exchange.
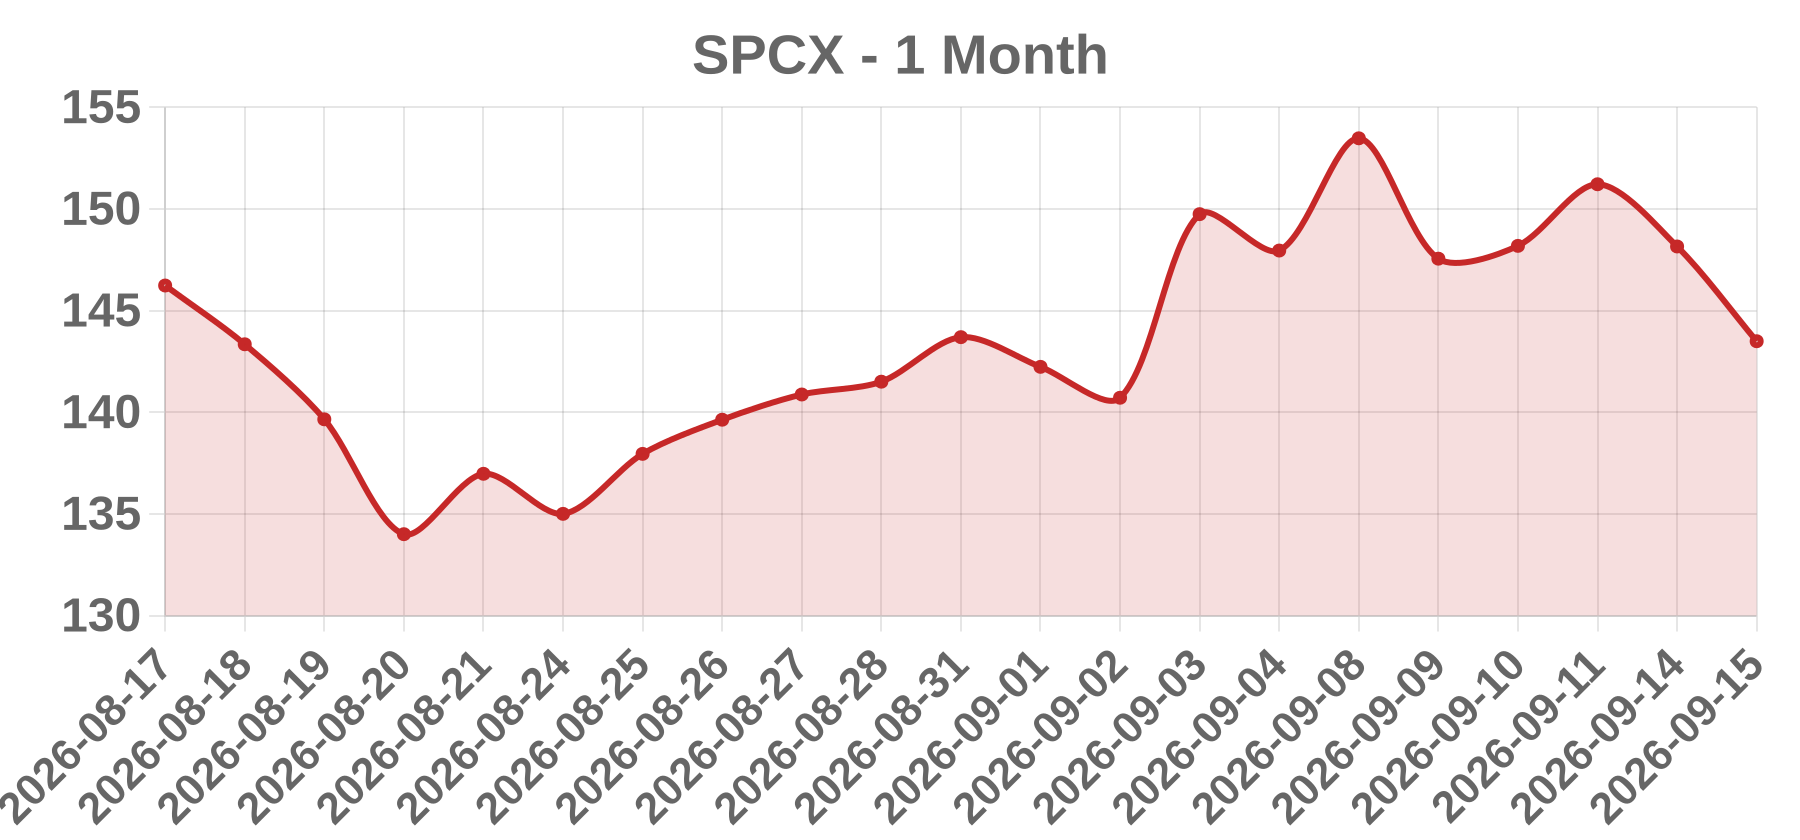
Today’s take The record shows SPCX closing at 143.49, down 3.15%, on 71,550,000 shares, flagged from a most-active list. That record cannot be treated as confirmed. SpaceX has been privately held since 2002 and, on available evidence, has no exchange-listed common stock under the ticker SPCX. Two explanations are more probable than a genuine mega-cap move: a ticker collision with an unrelated issuer, or a dataset entry that does not correspond to a listed security. Because the listing itself is unverified, no same-day catalyst (earnings, M&A, offering, index event, sector move) can be assigned without fabricating one. Verification steps: check the NYSE/Nasdaq symbol directories for SPCX and for any "Space Exploration Technologies" registrant, and query SEC EDGAR for filings. If a primary source confirms the listing, re-run the catalyst search and compute volume ratios only after obtaining a confirmed share count and average volume.
Business Grab Holdings Limited is a Cayman Islands-incorporated holding company listed on the Nasdaq Global Select Market under the ticker GRAB, and also on SGX. It operates Southeast Asia's largest superapp across mobility (ride-hailing), deliveries (GrabFood), and financial services (GrabFin: payments, wallet, lending, insurance distribution) in eight core markets including Singapore, Malaysia, Indonesia, Vietnam, Thailand, the Philippines, Cambodia, and Myanmar. Revenue is reported in USD.
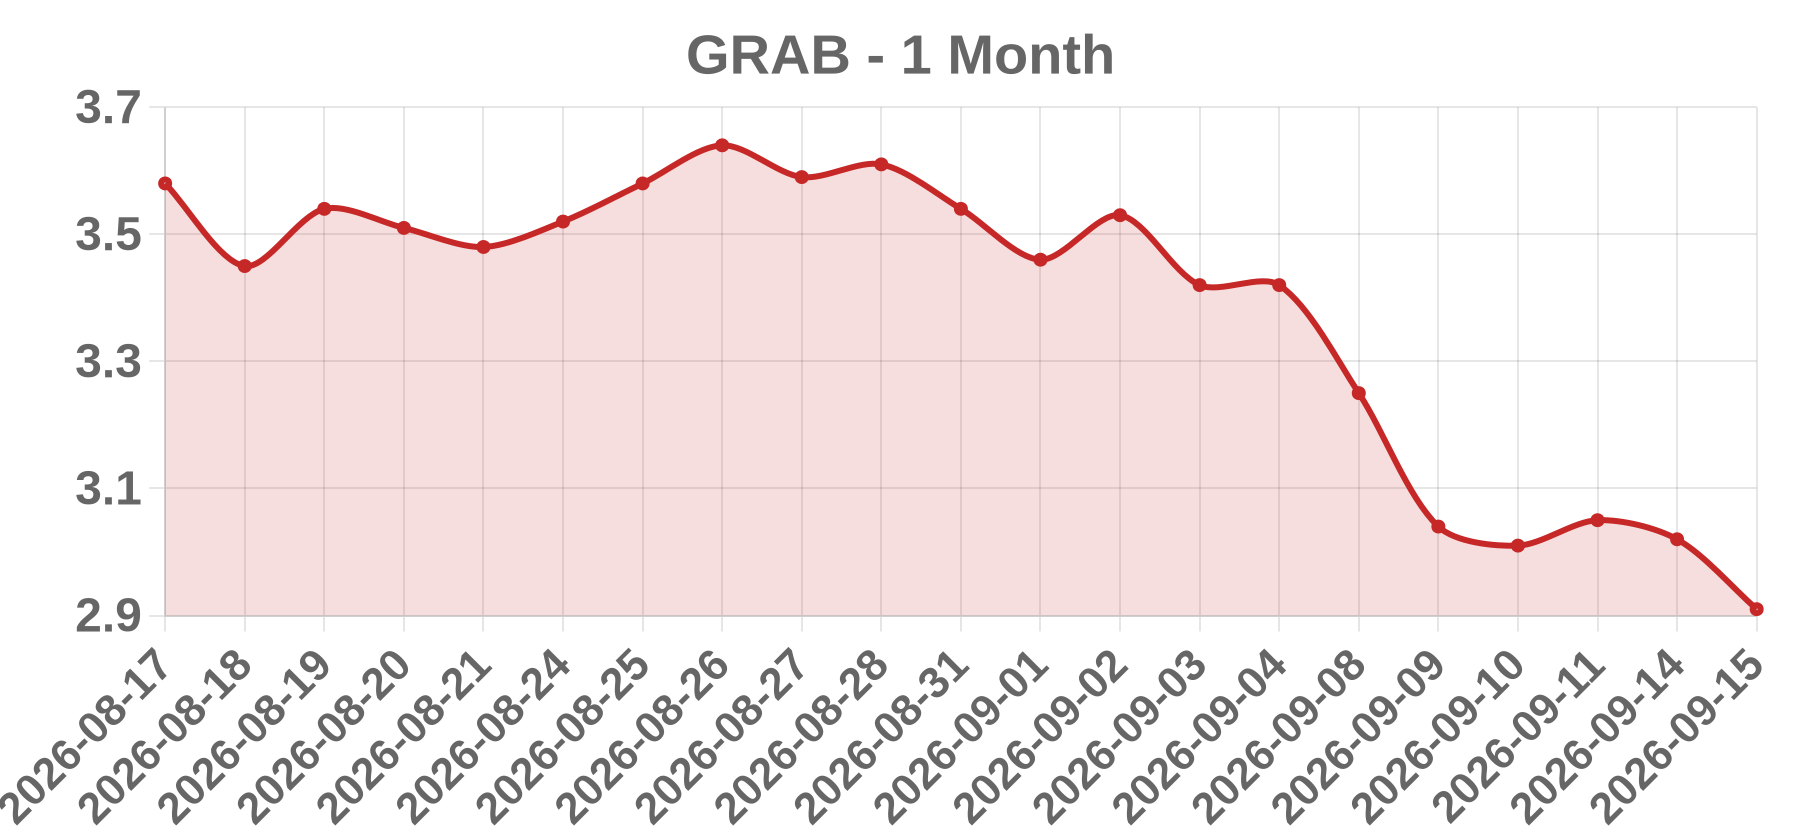
Today’s take The supplied data point — GRAB closing at $2.91 on 2026-09-15, down 3.64% on 69.32M shares — could not be verified against any same-day primary source, so the catalyst remains a hypothesis rather than a confirmed finding. A ~3.6% single-session decline is well within GRAB's ordinary historical daily volatility and does not by itself imply a company-specific shock. The absence of any same-day 8-K, press release, or major wire story points away from an idiosyncratic fundamental event and toward a broad emerging-market/ADR or Nasdaq selloff, index rebalancing, options expiry, or forced flow. USD strength is a recurring narrative headwind analysts cite for GRAB, since local-currency GMV translates into fewer USD. To classify this properly, two inputs are required: a same-day primary source (EDGAR filing, company IR release, or major wire story) and the 20-day average daily volume for a ratio.
Business Ondas Holdings Inc. is a Nasdaq-listed technology company operating in two segments: Ondas Networks, which provides FullMAX private licensed wireless broadband for rail, utility and industrial customers, and Ondas Autonomous Systems (including American Robotics and Airobotics), which builds autonomous drone-in-a-box platforms such as Optimus and the Scout System. It is a micro-cap, pre-profitability company with recurring capital-raising needs and a heavily retail-traded shareholder base.
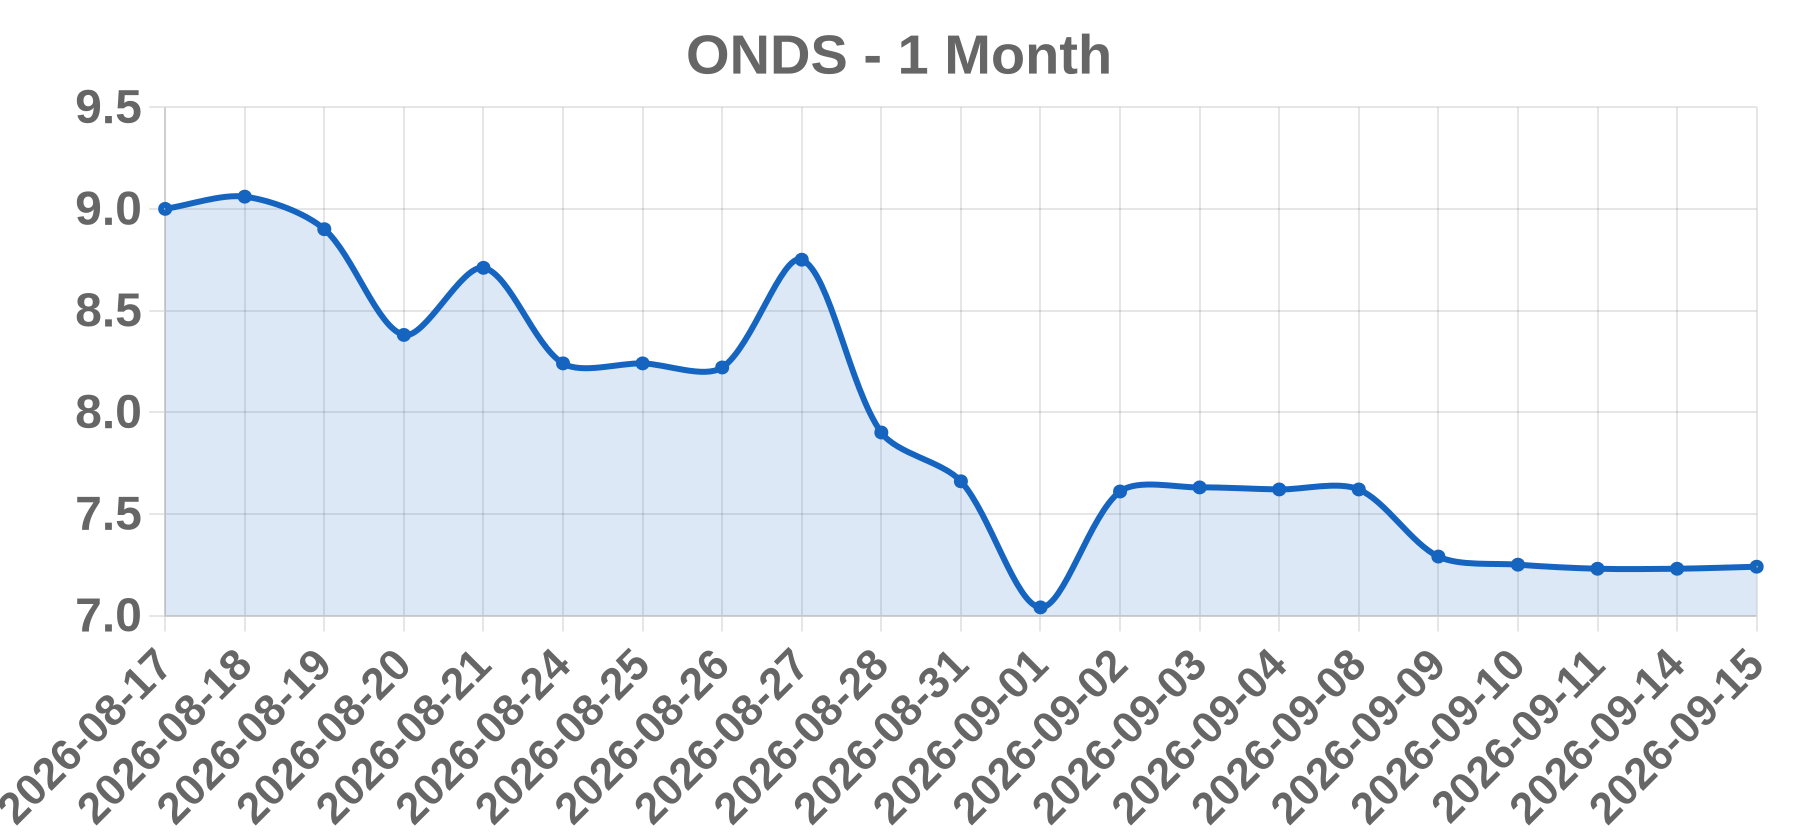
Today’s take The session carries no confirmed fundamental news, so the actionable signal is the price/volume relationship. ONDS closed at $7.24, up 0.14% on 67.52M shares. For a micro-cap with a modest float and a low dollar share price, a print of this magnitude normally represents several multiples of trailing average volume, yet price barely moved. That flat-price, heavy-volume pattern is characteristic of two-sided churn rather than a clean directional breakout: dilution supply absorbed by retail, warrant or ATM activity, short covering offset by new shares, or index/rebalance flow. Company-specific catalysts cannot be excluded and must be verified against same-day SEC EDGAR filings (8-K, 424B5, S-1) and press releases. Because the session date lies beyond retrievable data, catalyst attribution remains conditional; no specific event should be published without confirming same-day disclosures.
Business Transocean Ltd. is a Swiss-domiciled offshore contract drilling company listed on the New York Stock Exchange under the ticker RIG, with a secondary listing on the SIX Swiss Exchange. It operates a fleet of ultra-deepwater drillships, harsh-environment semisubmersibles and jackup rigs, contracting them on dayrate terms to integrated majors, national oil companies and independents. Revenue is driven by dayrate x contract term, making crude oil prices, offshore capex cycles and floater dayrates the key sensitivities, with contract backlog the primary forward-looking metric.
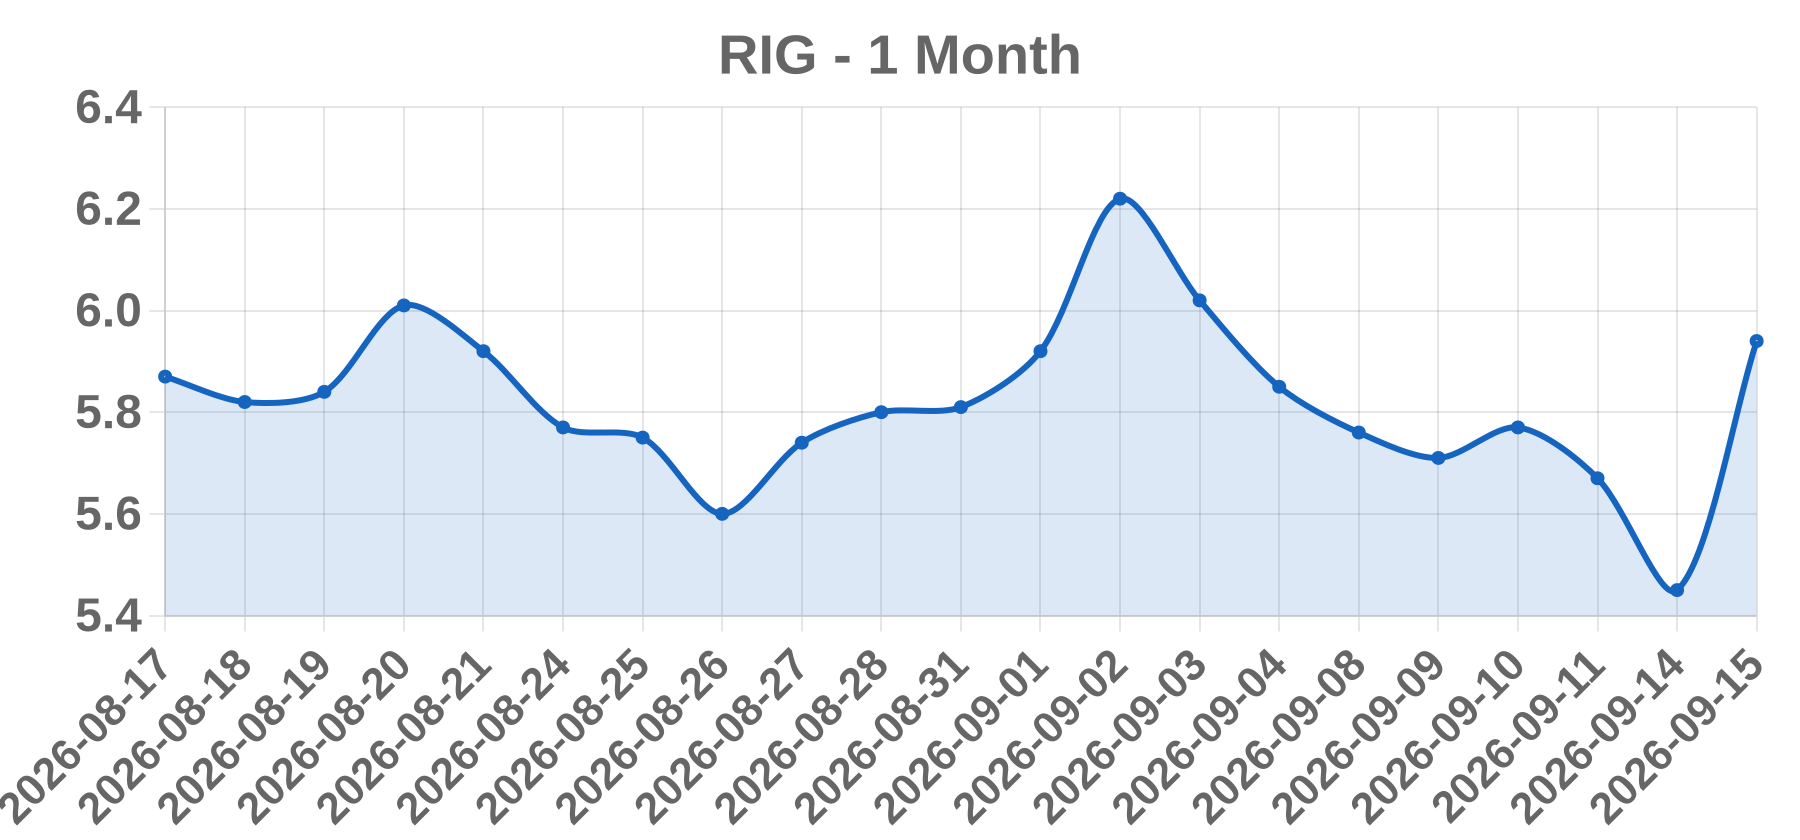
Today’s take RIG closed at $5.94 on 2026-09-15, up $0.49 or +8.99%, on 66.95 million shares — the session's single most defensible finding, since the WSJ_ACTIVES screen is a most-active-by-volume list rather than a news filter. A move of this magnitude in a sub-$10, high-beta offshore driller is far more consistent with sector-wide repricing than with a company-specific event: an idiosyncratic catalyst such as a contract award or financing would normally be accompanied by an 8-K or press release, and no such filing has been verified. The ranked hypotheses are (1) sector momentum or offshore-drilling sympathy, (2) analyst action, (3) contract award, (4) short squeeze. Because short interest in RIG has historically been high as a percentage of float, a violent gap on 2-3x normal volume without a matching headline is also the signature of forced covering. Confirmation requires the peer tape for VAL, NE, DO, BORR and SDRL on the same date: directional agreement across peers would attribute the move to the sector, while a RIG-only move would point back to a company-specific catalyst. Until those sources are retrieved, this remains a sector-attributed read with low confidence, not a confirmed cause.
Business Nu Holdings Ltd. is a Cayman Islands-incorporated, NYSE-listed holding company (ticker NU, also traded on B3 as NUBR33) that operates Nubank, one of the world's largest digital banking platforms. Through Nu Pagamentos S.A. it offers no-fee credit cards, deposit accounts, personal loans, insurance, investments and SME lending in Brazil, Mexico and Colombia.
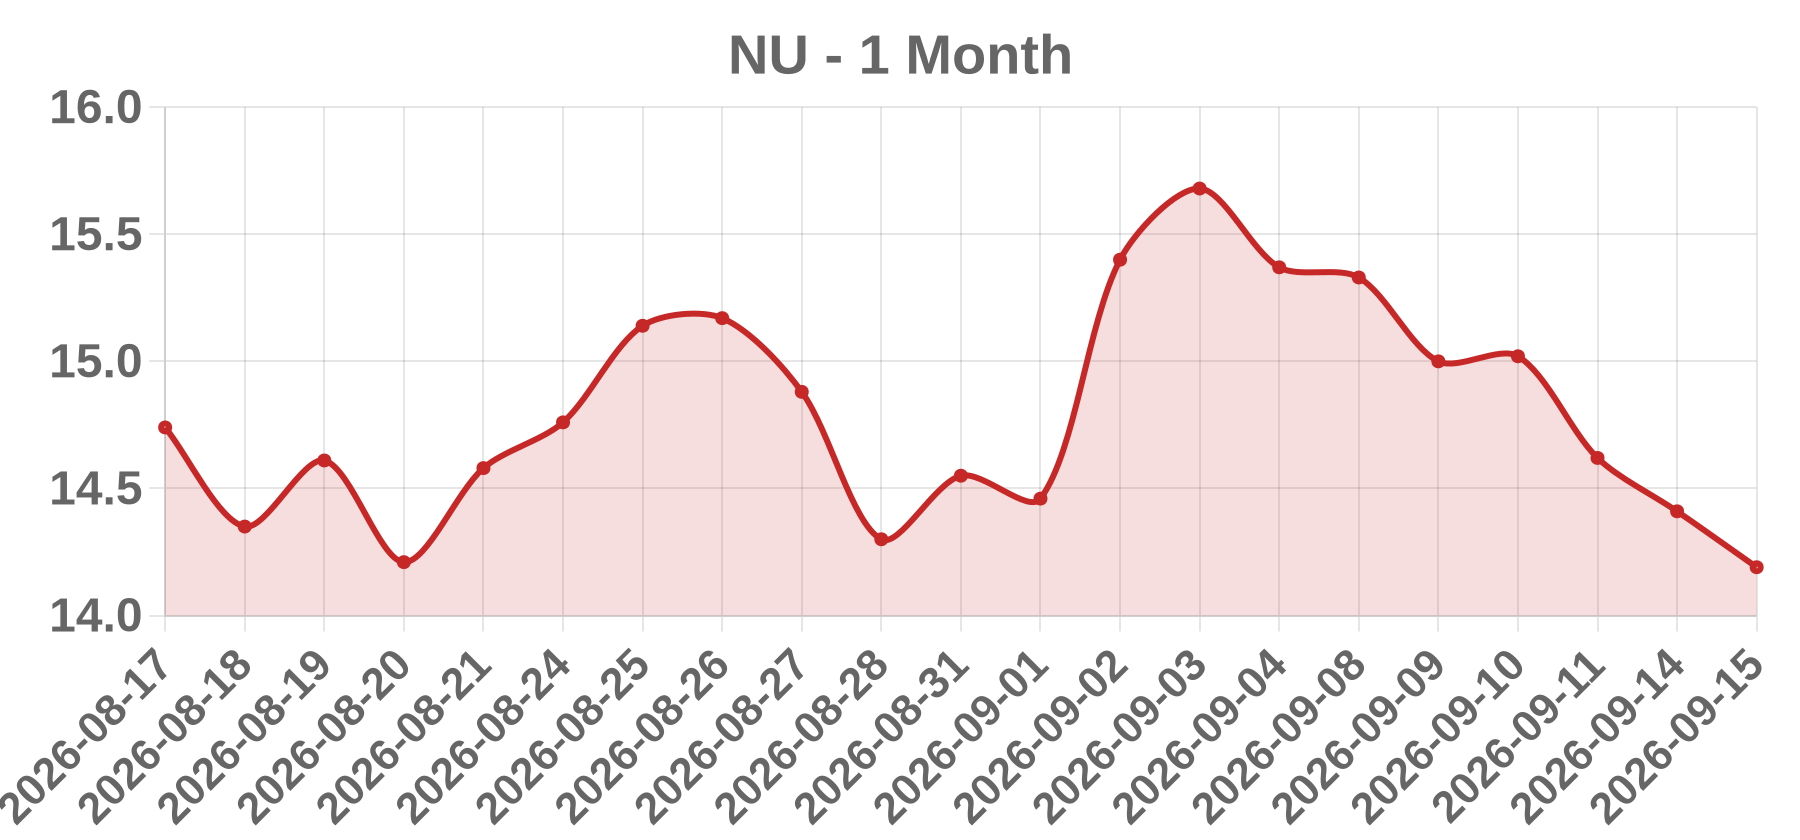
Today’s take NU closed at 14.19 on 2026-09-15, down 0.22 or 1.53%, on 59.51M shares with no confirmed company-specific headline. The decline is small and orderly, the profile of beta to broader EM and fintech risk sentiment rather than an idiosyncratic shock (which typically gaps wider). NU is a Brazil-linked emerging-market financial, so first-order drivers remain Brazilian macro (Selic policy, BRL/USD) and US rates, which move the net interest margin outlook and ADR valuation. Candidate explanations, all unconfirmed, include broad risk-off flow, index rebalance or option-expiry flow, or post-earnings drift if a report preceded the session. Analyst action: check a Bloomberg or Refinitiv news filter for 2026-09-15 and the 2026-09-14 after-hours window, and confirm the Q2/Q3 2026 earnings date on NU's IR page before assigning a discrete catalyst.
Business Veea Inc. is a Nasdaq-listed edge computing company that develops hardware and software for edge networking and AI-at-the-edge, historically sold through telecom, ISP, and smart-city channels. It went public via a SPAC merger and is a micro-cap with a history of sub-$1 pricing and heavy dilution risk.
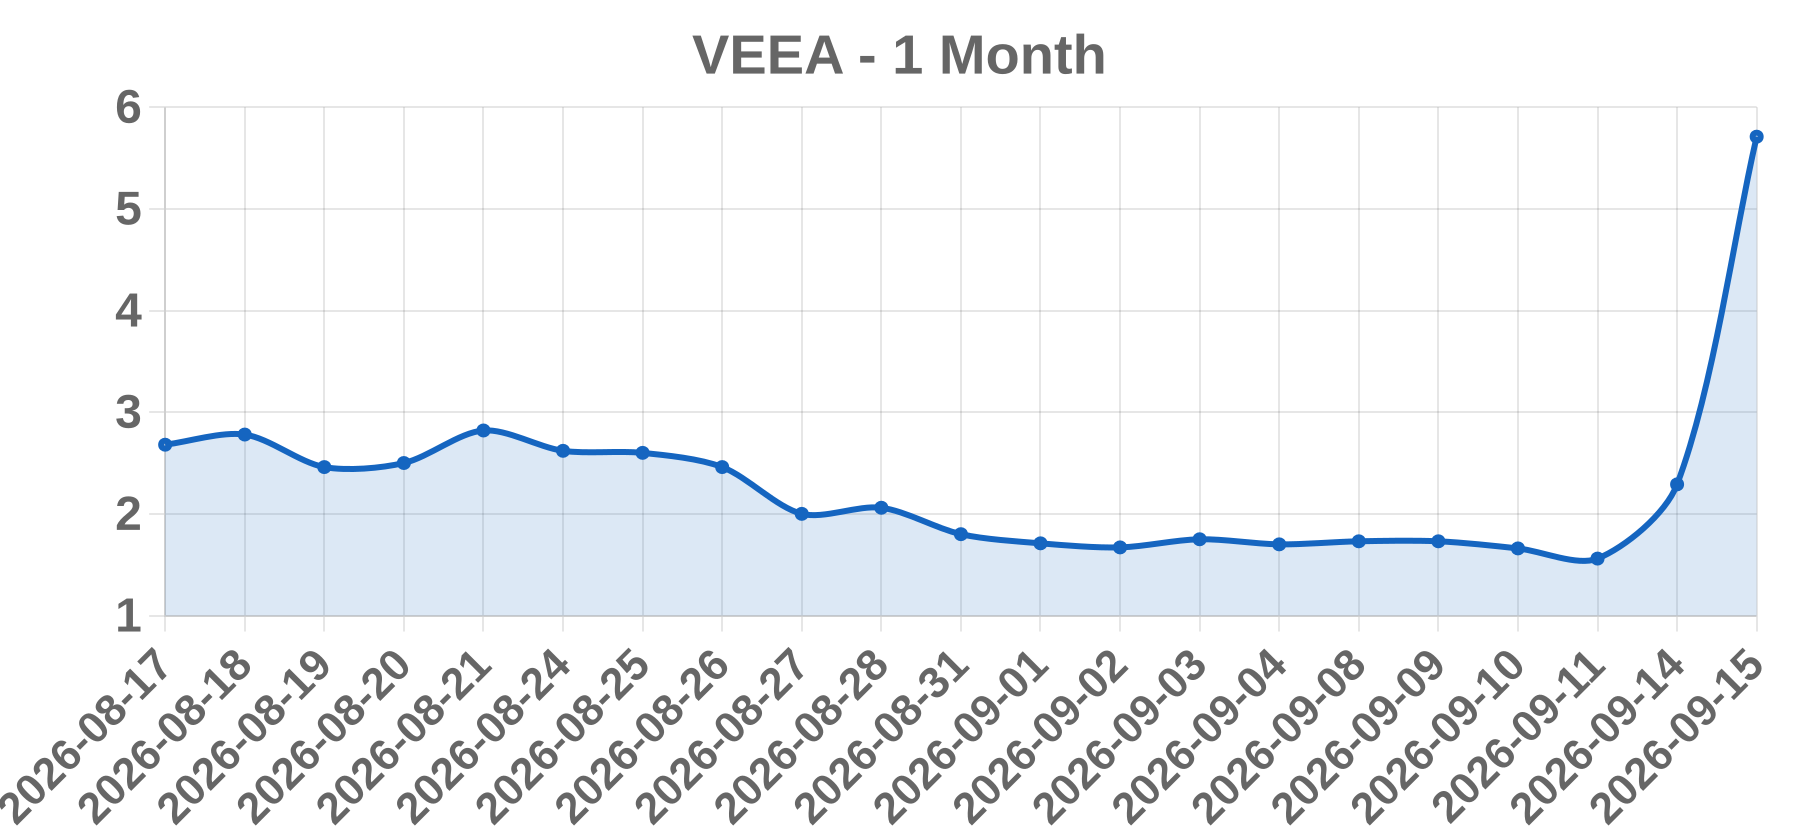
Today’s take The flagged print (VEEA at $5.71, +149.34%, dated 2026-09-15, volume 0) cannot be verified and is internally inconsistent. That date is in the future, so no close, filing, or catalyst exists. A gainer/actives screen with zero volume is a data artifact, not a tradable event. VEEA traded around $0.30-$0.57 through mid-2025 and faced Nasdaq minimum-bid compliance pressure, so a $5.71 close would imply a roughly 10-19x move requiring a reverse split or other corporate action for which no record was found. The percentage move may have been transcribed from a different ticker or a 2025 session. No earnings, FDA, M&A, partnership, upgrade, or short-squeeze narrative can be confirmed, so the catalyst is recorded as OTHER. Note that $5.71 and +149.34% are arithmetically inconsistent with a prior close near $2.29, another sign of bad input data.
Business PS International Group Ltd. is an unverified entity name associated with the symbol PSIG; its exchange listing, jurisdiction of incorporation, and principal business operations could not be confirmed from primary sources. No verifiable SEC EDGAR filing, exchange issuer page, or official listing record was located for this ticker. Investors should treat any business description of PSIG found on aggregator sites as unconfirmed until matched against an authoritative filing or exchange record.
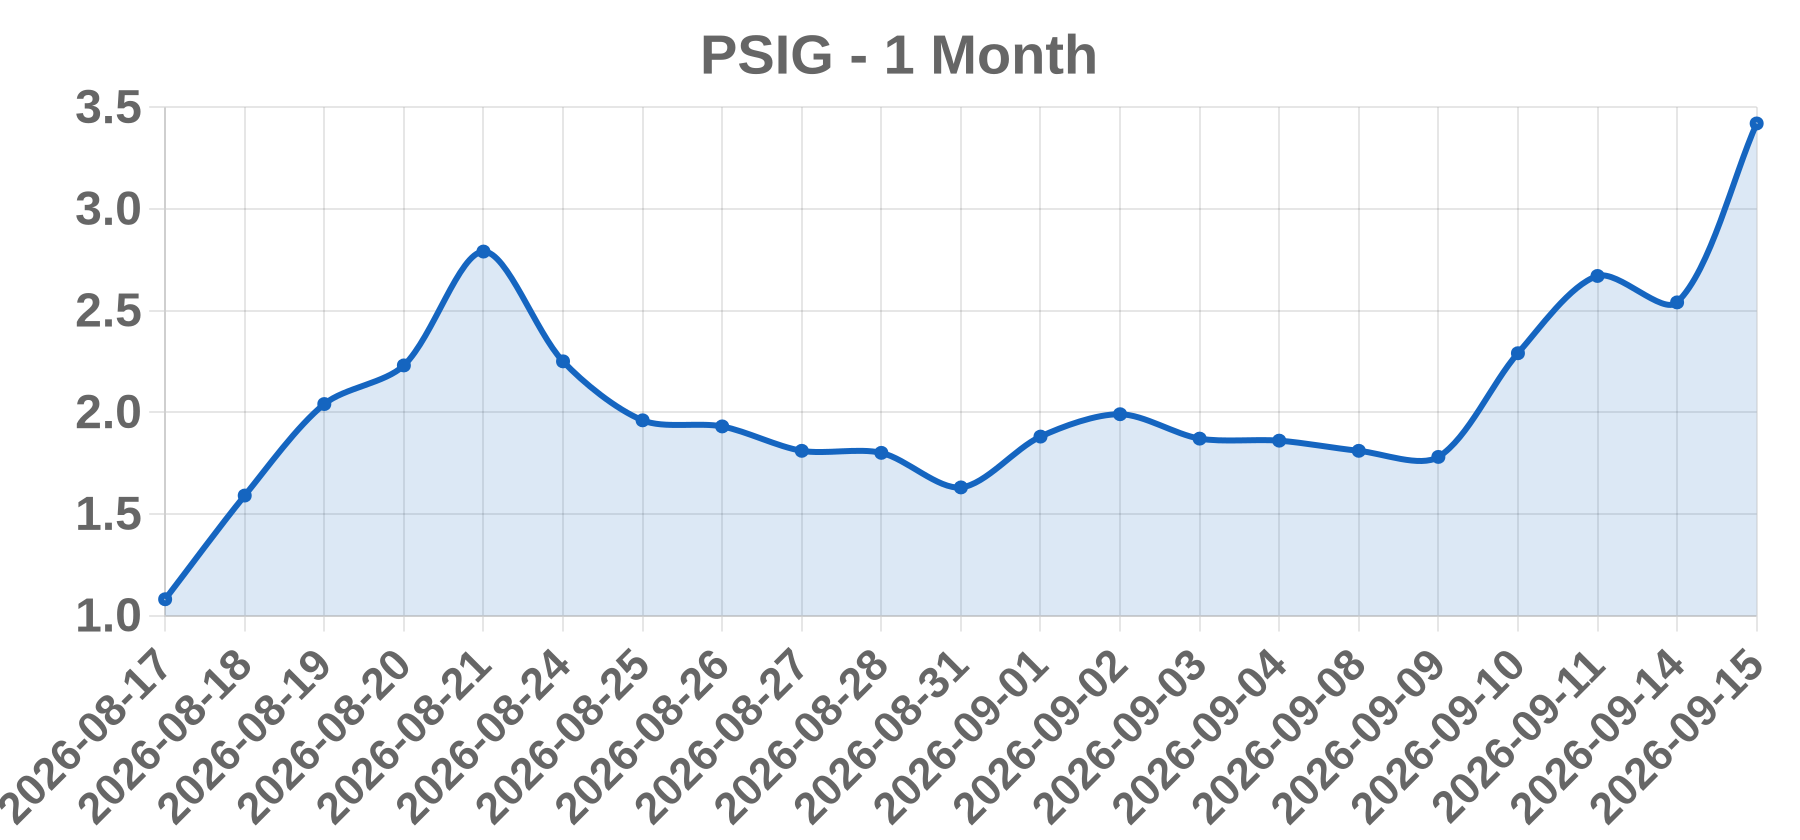
Today’s take No verifiable catalyst can be assigned to PSIG for the 2026-09-15 session. The reported print — close 3.42, +34.65%, volume 0 — is internally contradictory: a 34% gain cannot occur on zero volume, and a WSJ_GAINERS tag with zero volume indicates a gainers screen ranking on price change alone, typical of pre-open, post-halt, or stale-quote captures. Three checks must precede any narrative. First, does the row survive a second data source? Pull the official exchange daily close and one independent vendor; if volume is nonzero there, the volume field is the error, not the price. Second, was there a corporate action? A reverse split, ticker reuse, uplisting, or relisting mechanically produces large percentage moves against a stale prior close with no news catalyst. Third, only then search issuer disclosures, then wires, then social. If no primary source exists, the correct characterization is a data artifact. If a real move is confirmed, the likely mechanism for a microcap at this magnitude is a low-float repricing rather than a fundamentals event; verify float, borrow fee, and short interest before invoking a short squeeze, and note that 34% single-session microcap moves frequently re
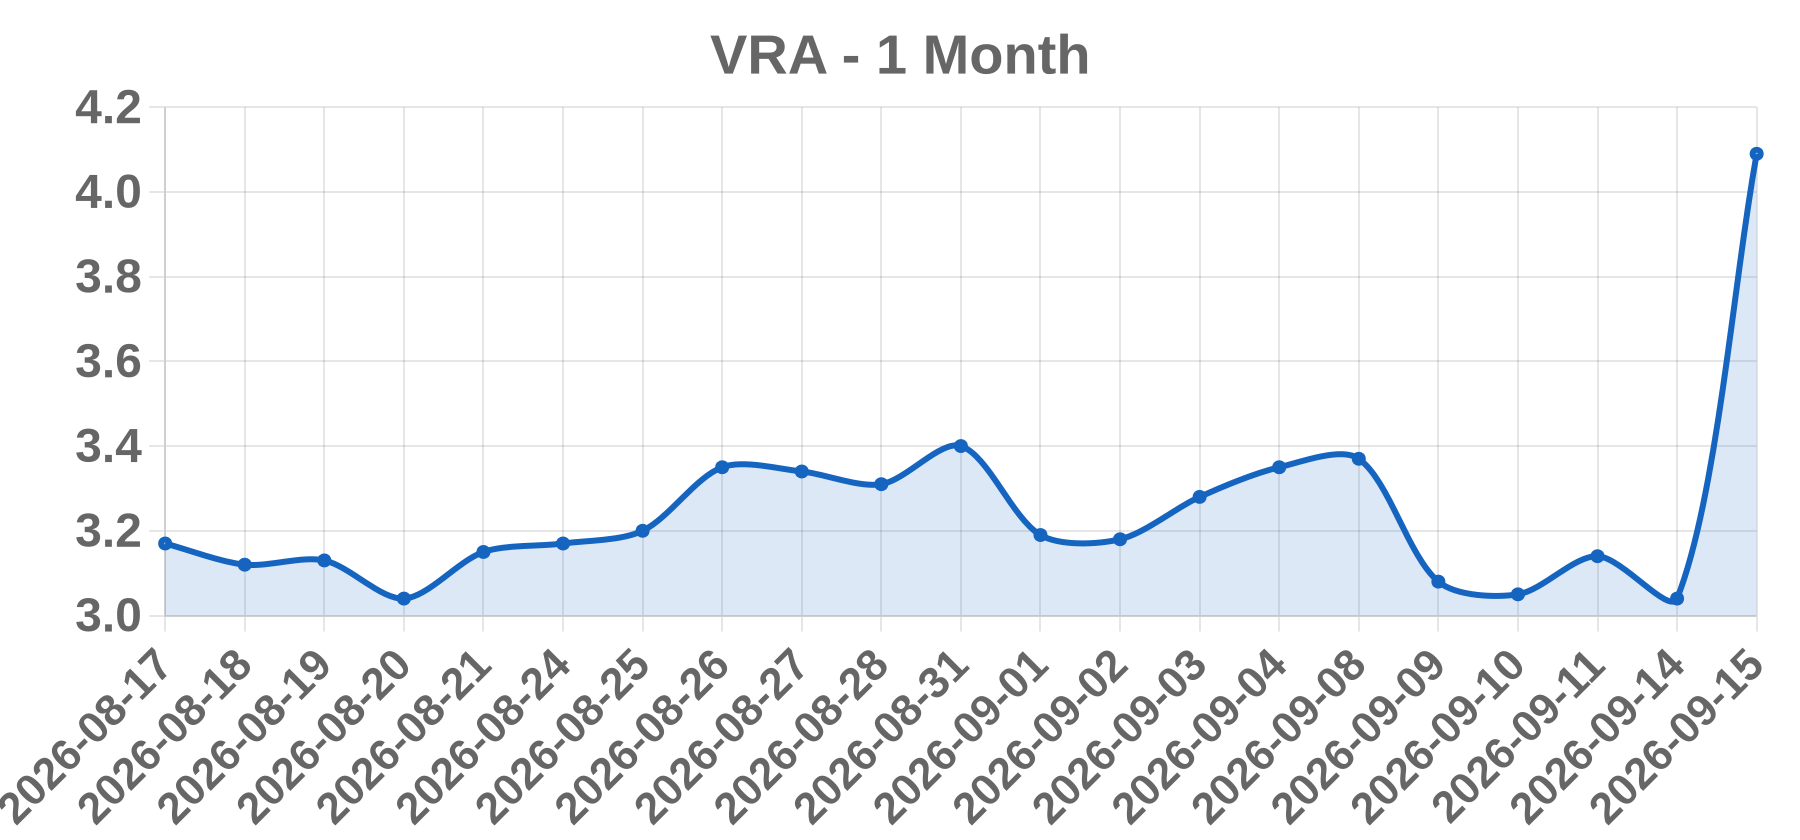
Business Vera Bradley, Inc. (Nasdaq: VRA) is a small-cap U.S. consumer discretionary company that designs and markets women's handbags, luggage, travel and fashion accessories, eyewear and apparel under the Vera Bradley brand, plus the digitally native Pura Vida bracelet and jewelry brand acquired in 2019. Revenue comes from company-operated retail stores, e-commerce and a wholesale channel serving department stores, specialty retailers and third-party e-commerce.
Today’s take The claimed +34.54% one-day move to 4.09 on 2026-09-15 could not be tied to any verifiable catalyst in available sources, and the accompanying volume print of 0 is internally contradictory: a stock cannot trade 34% higher on zero shares. That combination is the classic signature of either an unverified corporate-event headline on a thin micro-cap float, or a bad data row such as a stale quote, unadjusted corporate action or ticker reuse. No confirmed earnings, M&A, strategic-alternatives, analyst or regulatory filing hit appears for that session. Before any publication, the price and volume must be re-pulled from a second independent market-data source, checked against the 30-day average volume, screened for a corporate action effective on or near 2026-09-15, and cross-checked against SEC EDGAR filings from 2026-09-08 through 2026-09-16. If the move is real, the most probable driver for a name this size is a strategic-alternatives or buyout headline on thin float; if it is not, the row should be excluded as a price-data error.
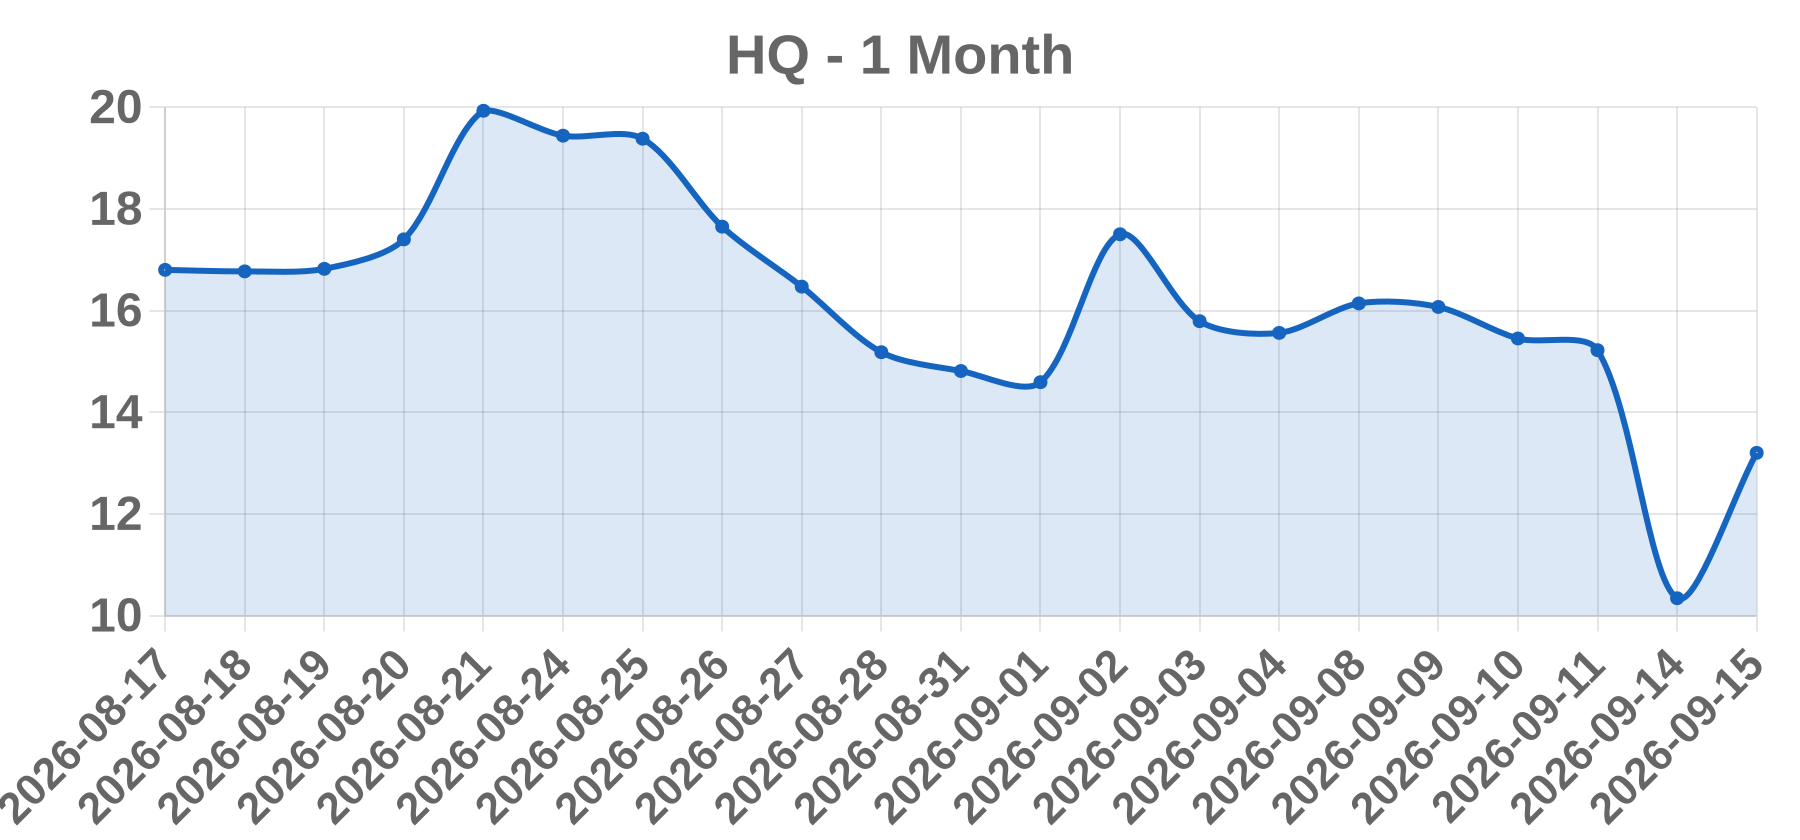
Business No listed issuer named 'Horizon Quantum Holdings Ltd.' could be verified on NYSE, Nasdaq, LSE, SGX, HKEX, or TSX under the ticker 'HQ'. The closest name match is Horizon Quantum Computing Pte. Ltd., a private, venture-backed Singapore quantum-software company that builds a high-level programming toolchain compiling classical code onto quantum hardware. Because that firm is private, it has no exchange session, no closing price, and no gainers-tab entry. The 'HQ' symbol is short and collision-prone, shared by multiple unrelated issuers and OTC/foreign lines, so identity cannot be assumed without an ISIN/CUSIP and exchange MIC.
Today’s take The reported +27.66% session for 'HQ' at a last price of 13.20 with volume of zero on 2026-09-15 is internally inconsistent and cannot be confirmed as a legitimate equity move. No same-day or prior-session catalyst was found: no earnings release, M&A announcement, regulatory action, analyst rating change, partnership, offering, or index event tied to this ticker and date. On a live exchange, a 27%+ mover prints elevated volume, not zero; volume of zero typically signals a stale quote, an indicative or non-trading line, a delayed feed, an OTC grey-market placeholder, or a data error. The most likely explanation is a data artifact or ticker misidentification rather than genuine liquidity-driven price discovery. No valid trading conclusion should be drawn from this line until the quote's ISIN/CUSIP and exchange MIC are confirmed and the raw quote page (price, volume, last-trade timestamp) is checked directly.
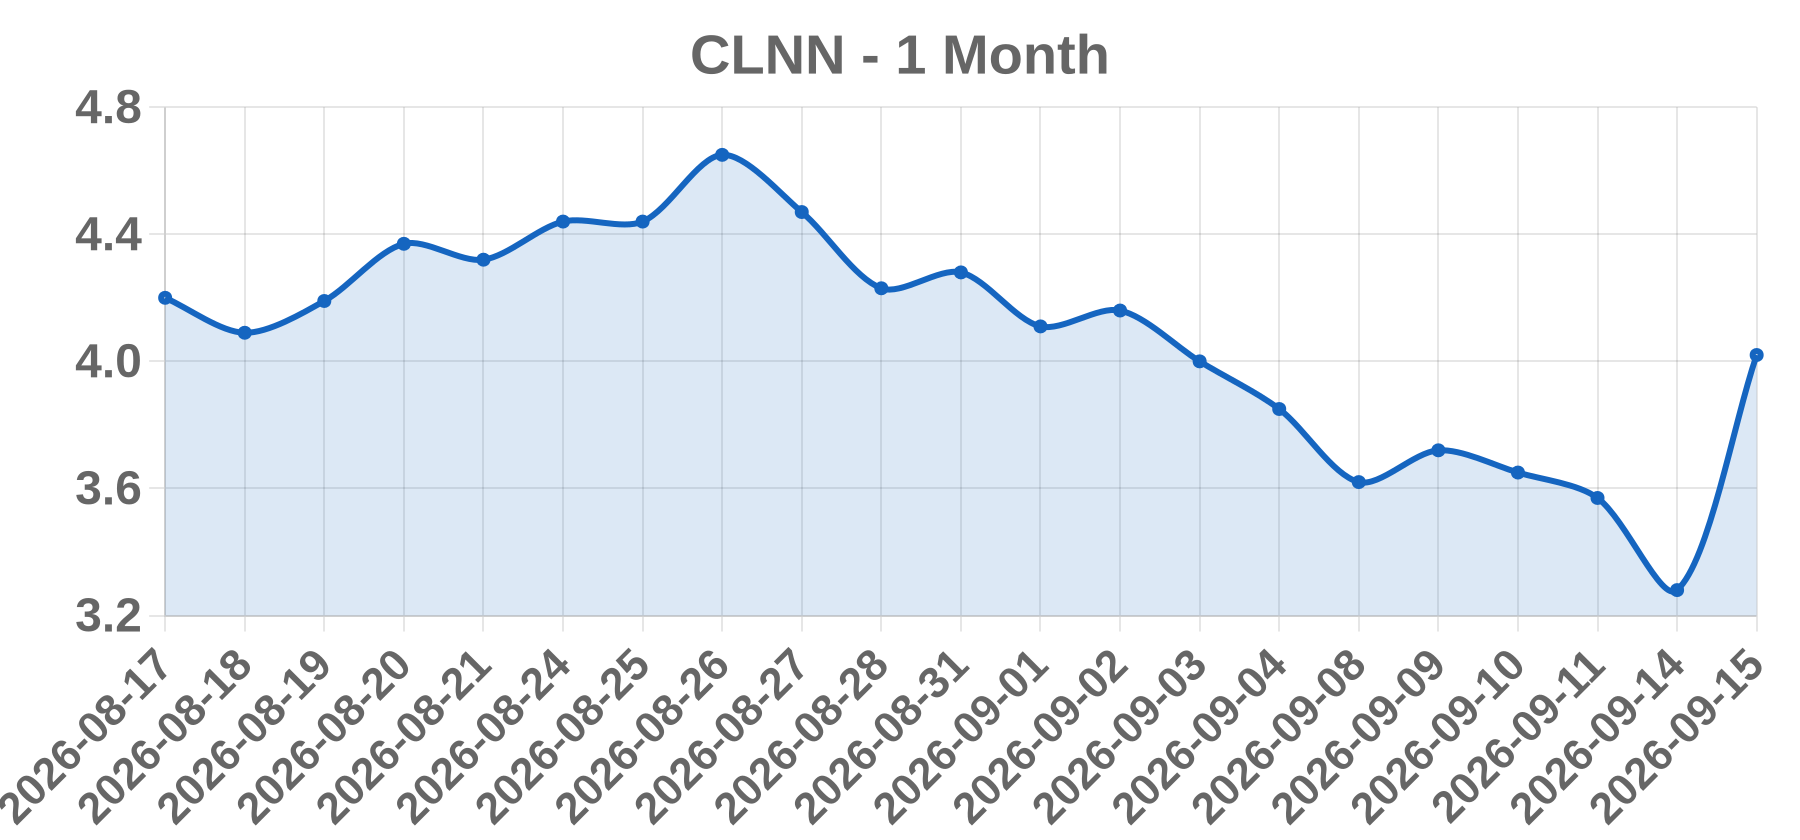
Business Clene Inc. (Nasdaq Capital Market: CLNN) is a clinical-stage biopharmaceutical company whose operating subsidiary, Clene Nanomedicine, Inc., develops nanocatalytic therapeutics. Its lead asset, CNM-Au8, is an orally administered catalytically active gold nanocrystal suspension being investigated in neurodegenerative diseases, most prominently ALS.
Today’s take CLNN was flagged on the WSJ gainers screen for 2026-09-15 with a +22.56% close at $4.02 and a volume field reading 0, which is internally impossible. No same-day 8-K, press release, analyst rating action, or FDA event could be retrieved, so no fundamental catalyst can be assigned. Mechanically, a low-float clinical-stage microcap is structurally capable of outsize moves via short covering or thin liquidity, but with zero reported volume there is no evidence of a real traded session to explain. This row is best treated as a probable data-feed artifact or stale placeholder rather than a verified move. Recommendation: quarantine the row in data-ops, then re-validate against Nasdaq consolidated tape and SEC EDGAR 8-K filings before any analyst commentary is published. Do not assign FDA, EARNINGS, M&A, or UPGRADE on current evidence; a generic OTHER designation is the only defensible label.
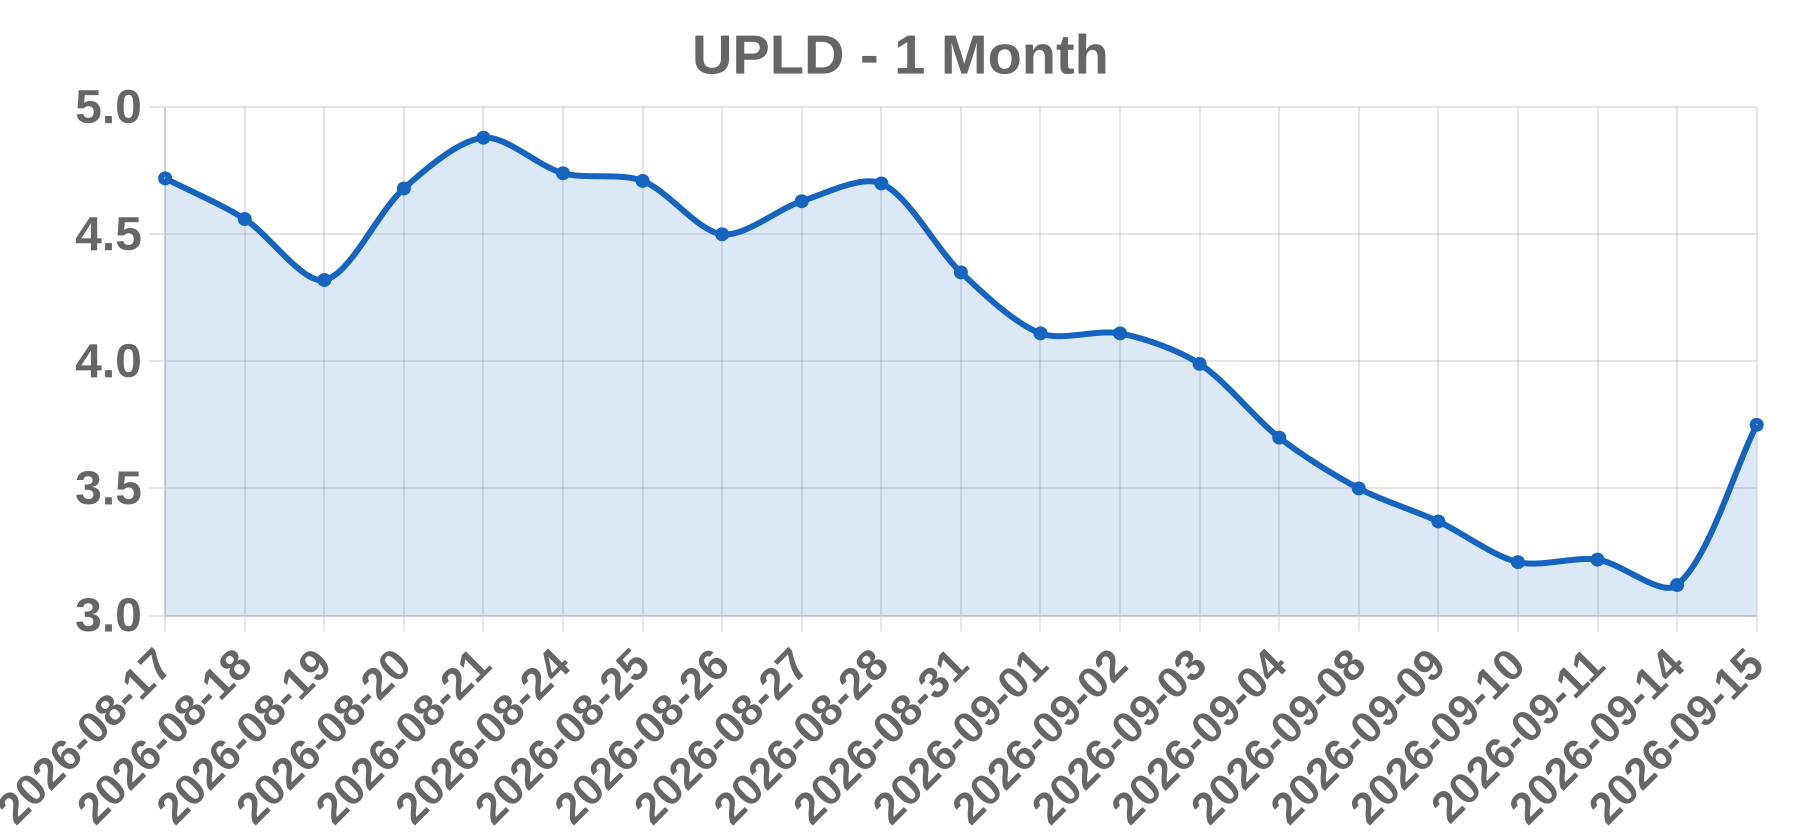
Business Upland Software, Inc. (Nasdaq: UPLD) is a cloud-based enterprise work-management software company that operates a portfolio of acquired SaaS products spanning project and IT management, customer engagement, knowledge management, and document workflow automation. Its growth model has historically been M&A-driven, acquiring smaller SaaS businesses and cross-selling them, which leaves it with leverage from prior deals and a small-cap, low-share-price profile prone to sharp news-driven gaps.
Today’s take The +20.19% session gain to $3.75 is a news-driven event move for a depressed micro-cap SaaS name, not normal drift. The supplied research notes flag two data-integrity problems: the close date cannot be independently verified, and the reported volume of 0 is internally impossible, since a stock cannot close +20% with no shares traded. That contradiction makes the print itself suspect, so the artifact possibility should be ruled out against a second market-data vendor before any catalyst is published. Ranked hypotheses are an earnings beat or guidance raise, an M&A or strategic-alternative announcement, a sell-side upgrade or target hike, and a low-float short-squeeze amplifying any positive headline. Pure sector sympathy rarely produces +20% in a name this size without a company-specific kicker. Verification against a primary 8-K, press release, or major wire is required before assigning a definitive catalyst.
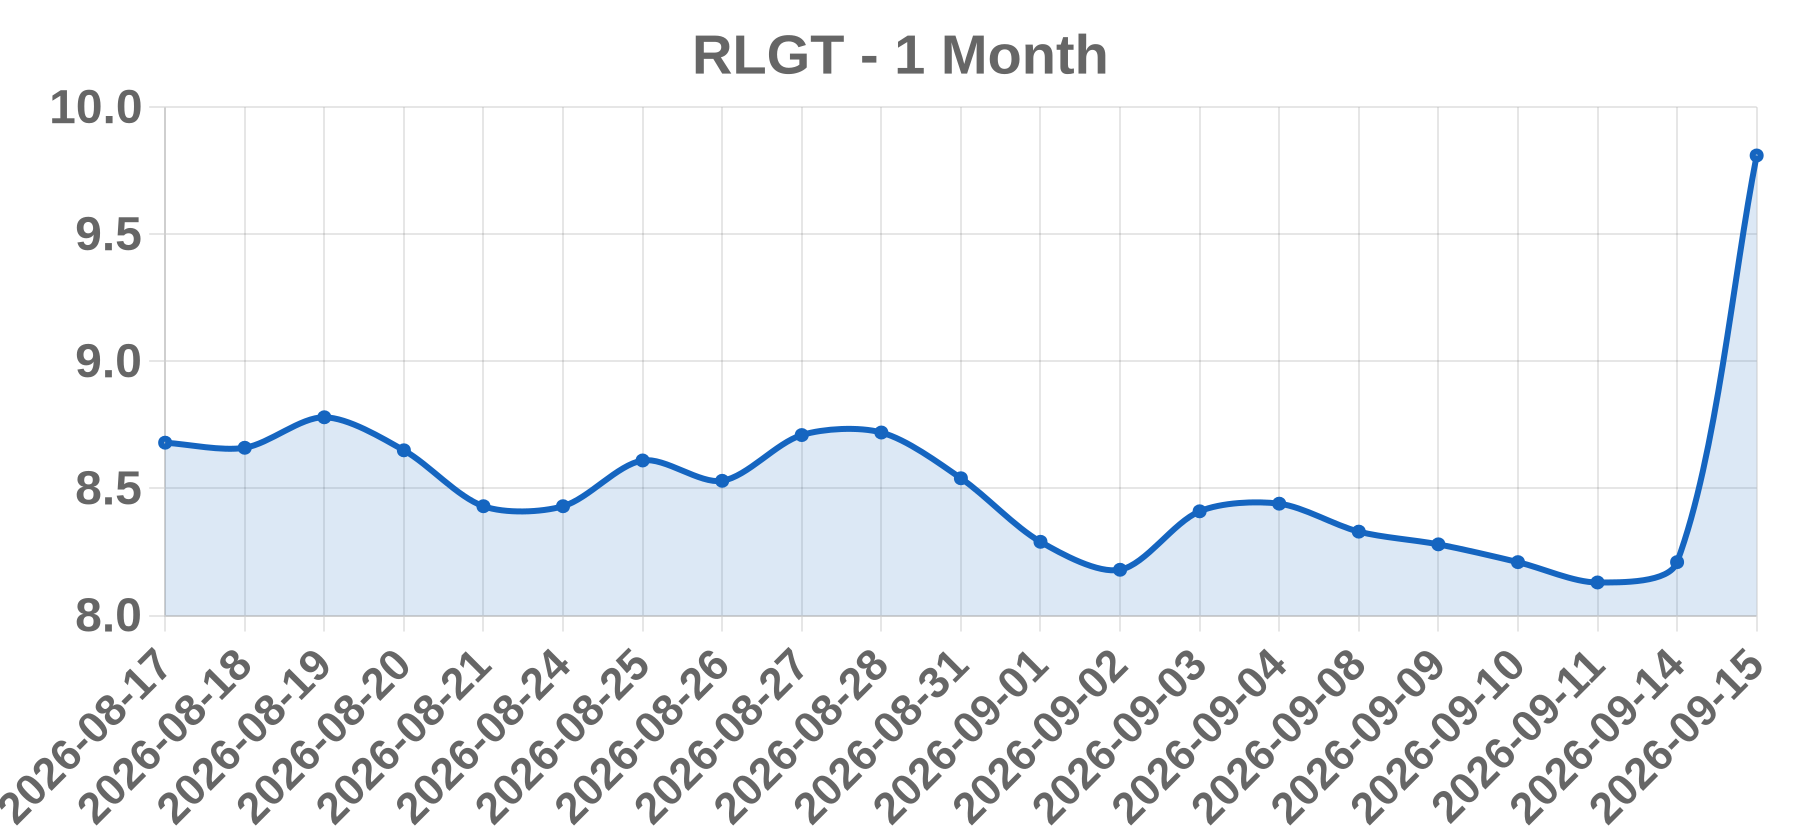
Business Radiant Logistics, Inc. is a Delaware-incorporated, Bellevue, Washington-headquartered third-party logistics (3PL) provider listed on the NYSE under the ticker RLGT. The asset-light company brokers air, ocean, truck and rail freight and offers value-added warehousing and distribution through company-owned and agent-based stations, mainly in North America, under brands including Airgroup, Adcom, DBA and Radiant Canada. It reports in two segments, North America and International, and its fiscal year ends June 30.
Today’s take The screen shows RLGT up 19.49% to 9.81 for the 2026-09-15 session, but the accompanying volume field is zero, so the print cannot be treated as a confirmed market fact. No same-day news release or filing could be retrieved for this date during research. In the absence of a verified headline, the leading hypothesis is earnings: Radiant's fiscal year ends June 30 and the company has historically released fourth-quarter and full-year results in mid-to-late September, which fits a mid-September binary move. Secondary hypotheses are M&A, since bolt-on acquisitions are a stated strategy, and analyst action or sector freight sentiment. Because a zero-volume, +19% row is internally inconsistent, the move may simply be a vendor feed error or a non-regular-session reference price. Until the close and volume are confirmed against the consolidated tape and an 8-K or press release is located, no catalyst should be asserted and no position should be sized off this data.
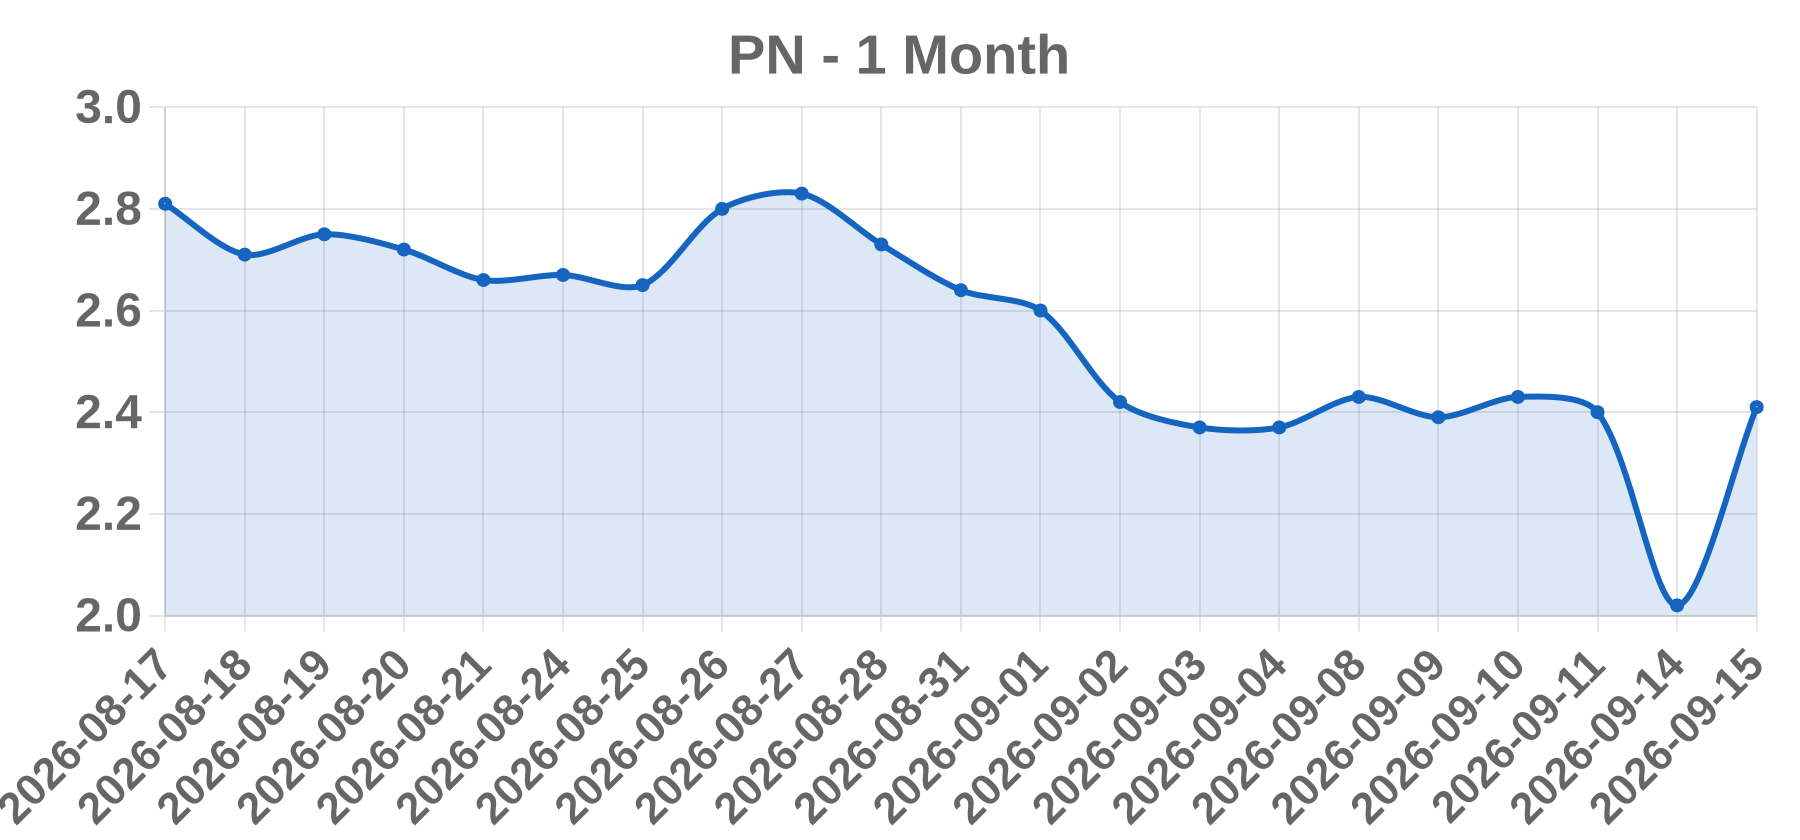
Business No verified listed issuer could be matched to the name 'PN Smart Energy Limited' or to the ticker 'PN' with a smart-energy business profile. Sector inferred from the name would be renewable/smart energy (solar, storage, grid software, or energy management), but the legal entity, exchange venue, and ISIN remain unconfirmed. Treat the underlying data row as unverified until the listing venue and identifier are confirmed.
Today’s take A reported +19.31% move in PN on volume of 0 is internally inconsistent: no equity can close 19% higher on zero shares traded. Volume 0 in a screener field typically indicates a failed volume feed, a ticker mis-mapping (the two-letter symbol 'PN' collides across multiple unrelated listings), or a stale placeholder row. Searches for 'PN Smart Energy Limited' returned no matching corporate entity, exchange listing, or regulatory filing, and no same-day news dated 2026-09-15 tied to any matching issuer. No earnings date, M&A event, analyst action, or sector move can be confirmed. If the price move is real, the most probable non-fundamental explanations are a thin-float spike on a single print, a corporate action such as a reverse split, relisting or ticker change, or a data artifact. Next steps: confirm venue and ISIN, pull the official exchange daily quote for 2026-09-15, check the issuer IR page and filing system, and check OTC disclosures or news wires.
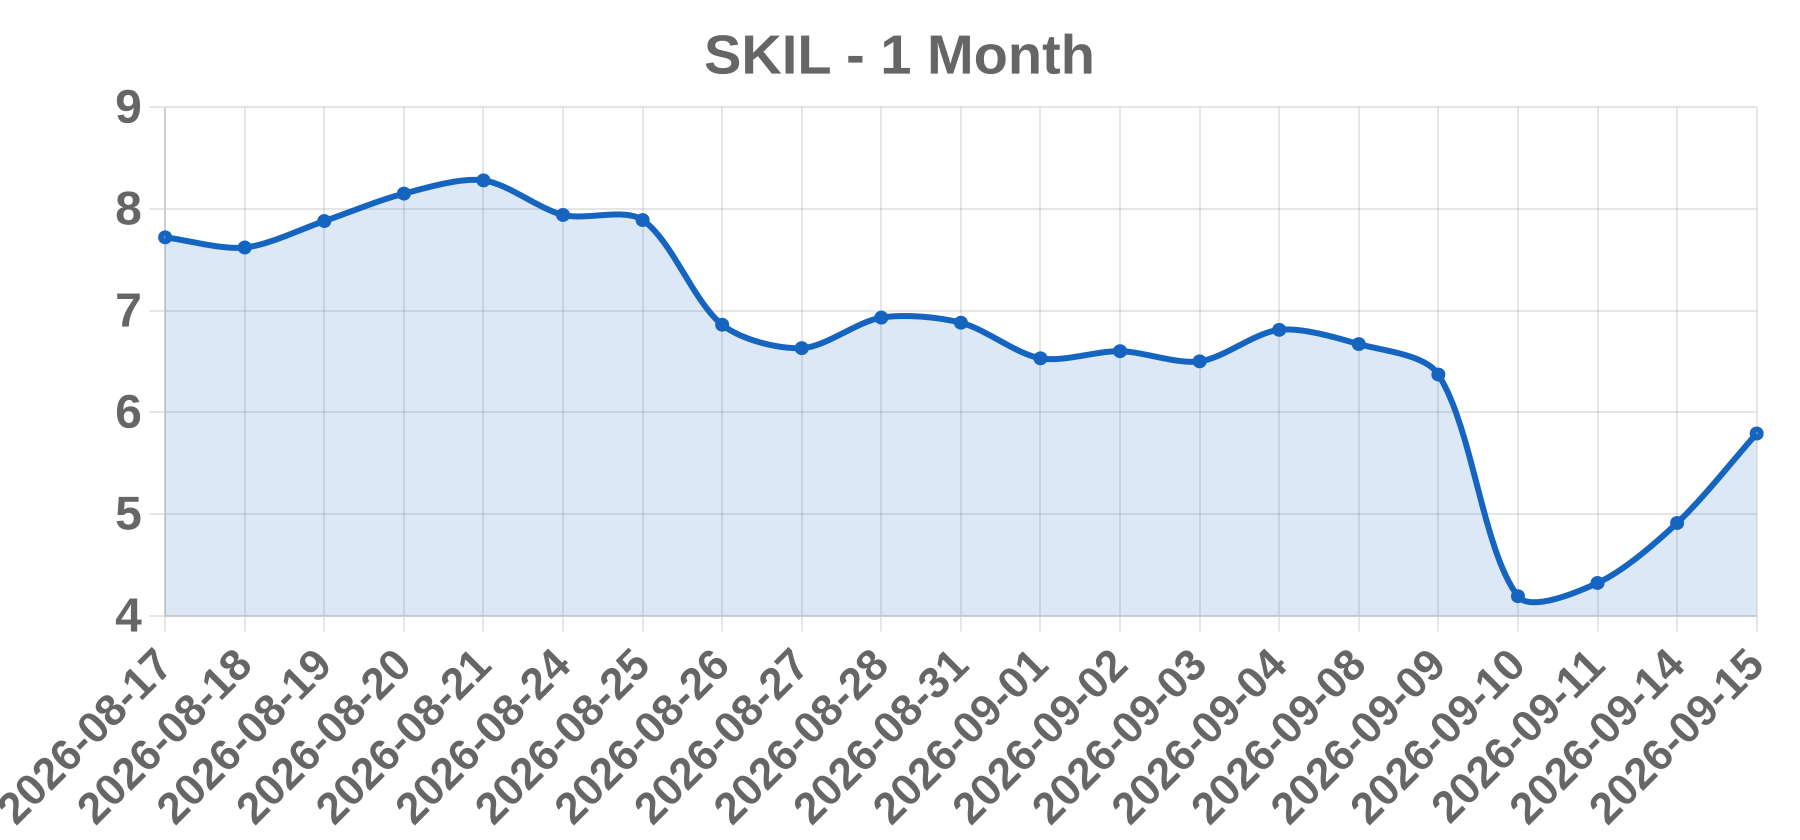
Business Skillsoft Corp. (NYSE: SKIL) is a corporate digital learning and workforce development company headquartered in the United States. It delivers on-demand course libraries, compliance training, leadership development, and technology-skills content through its Percipio platform, Codecademy-branded offerings, and Global Knowledge IT certification business, sold primarily as enterprise subscriptions.
Today’s take SKIL closed at $5.79 on 2026-09-15, up $0.88 or +17.92%, with reported volume of zero. Those figures are internally inconsistent: a real +18% move on an NYSE tape cannot print zero volume, so the print is treated as unverified rather than a confirmed tradable catalyst. The most likely mechanical explanations are (1) a corporate-action artifact, i.e. a reverse-split or relisting price adjustment against a restated prior close, (2) a thin-float microcap repricing with no fundamental news, or (3) a feed that simply failed to populate volume. A fundamental catalyst (earnings, guidance, M&A, take-private) cannot be ruled in because no same-day filing or press release has been verified. Skillsoft's leveraged post-SPAC balance sheet has historically been the dominant driver of equity volatility, so debt exchange, maturity extension, or equitization news should be checked first. Until 30-day average volume, relative volume, and any reverse-split effective date are confirmed from a live tape, this move should not be described as a short squeeze or high-volume breakout.
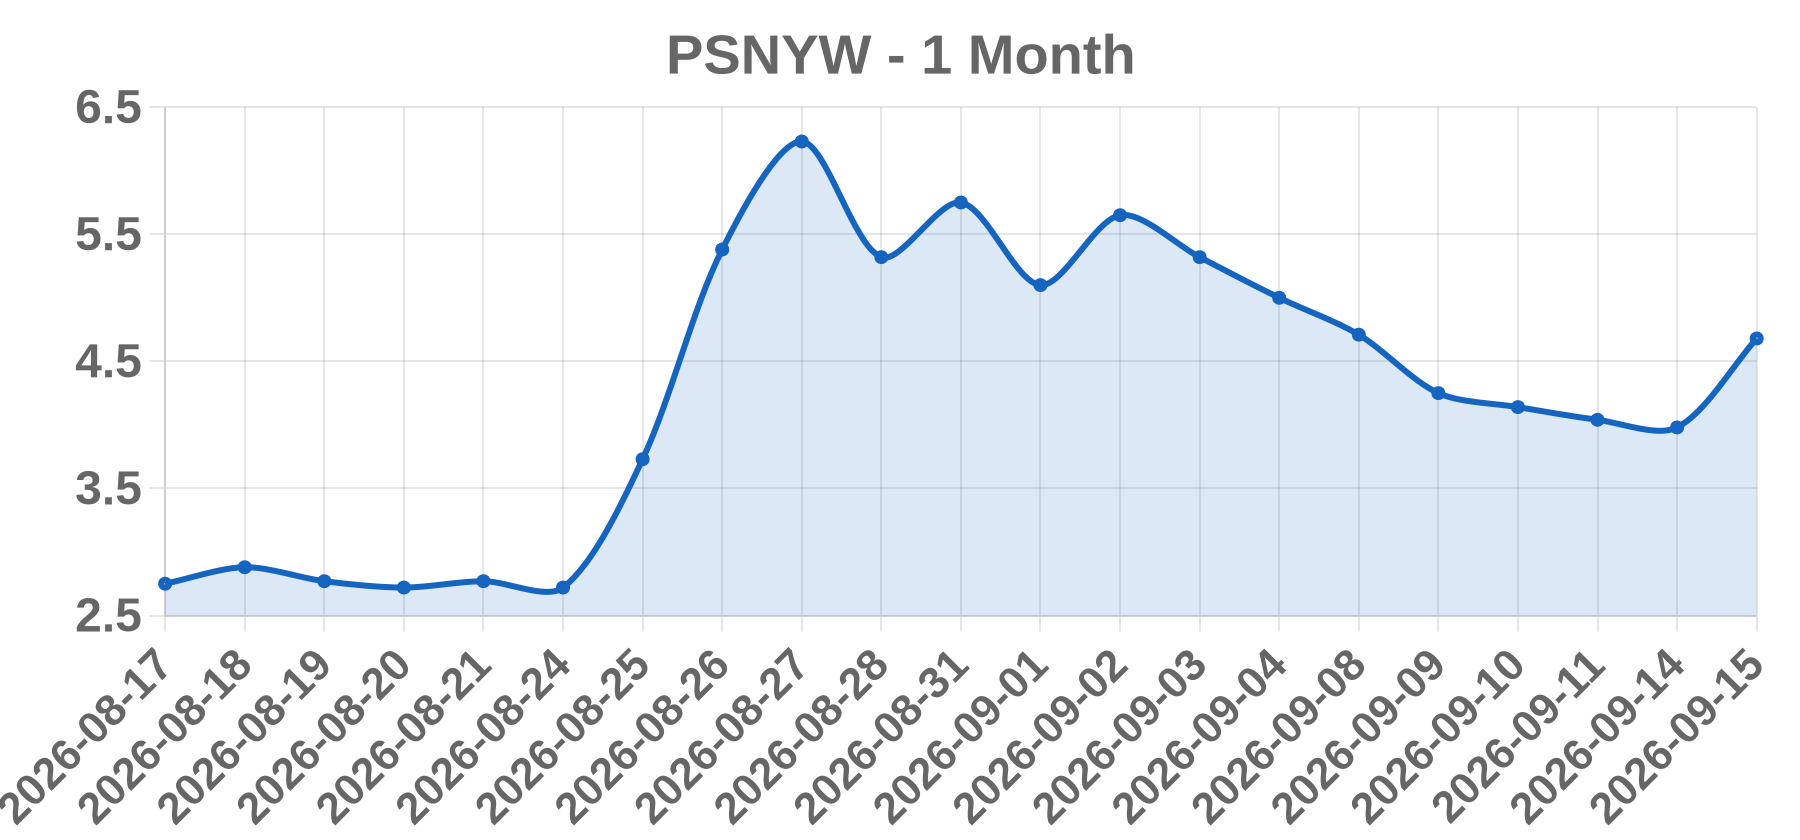
Business Polestar Automotive Holding UK PLC is a Swedish-headquartered electric vehicle manufacturer within the Volvo Cars and Geely ecosystem. Its Class A ADSs trade on Nasdaq under PSNY, while PSNYW is a separate Nasdaq-listed warrant series rather than the common equity. The company sells performance-oriented EVs including the Polestar 2, 3, 4 and planned 5, using an asset-light model with contract manufacturing partners.
Today’s take The data cannot be verified as a real trading session. First, the requested close date falls in the future, so no legitimate close price, percentage move, or same-day catalyst can exist or be confirmed. Second, PSNYW denotes a Polestar warrant, not the underlying Class A ADS (PSNY); warrants trade on different mechanics including expiry, redemption triggers and thin float, so they rarely appear on a standard equity gainers screen. Third, a +17.59% close with volume of zero is internally contradictory, indicating a stale row or bad feed rather than genuine trading. For these reasons no catalyst enum, price commentary, or volume note can be responsibly assigned here. Polestar-related catalysts that are normally relevant include quarterly deliveries and earnings, liquidity and funding updates, analyst rating and price-target changes, and warrant-specific events such as redemption notices. Verification requires a confirmed ticker (PSNY vs PSNYW), a past trading date, and non-zero volume.
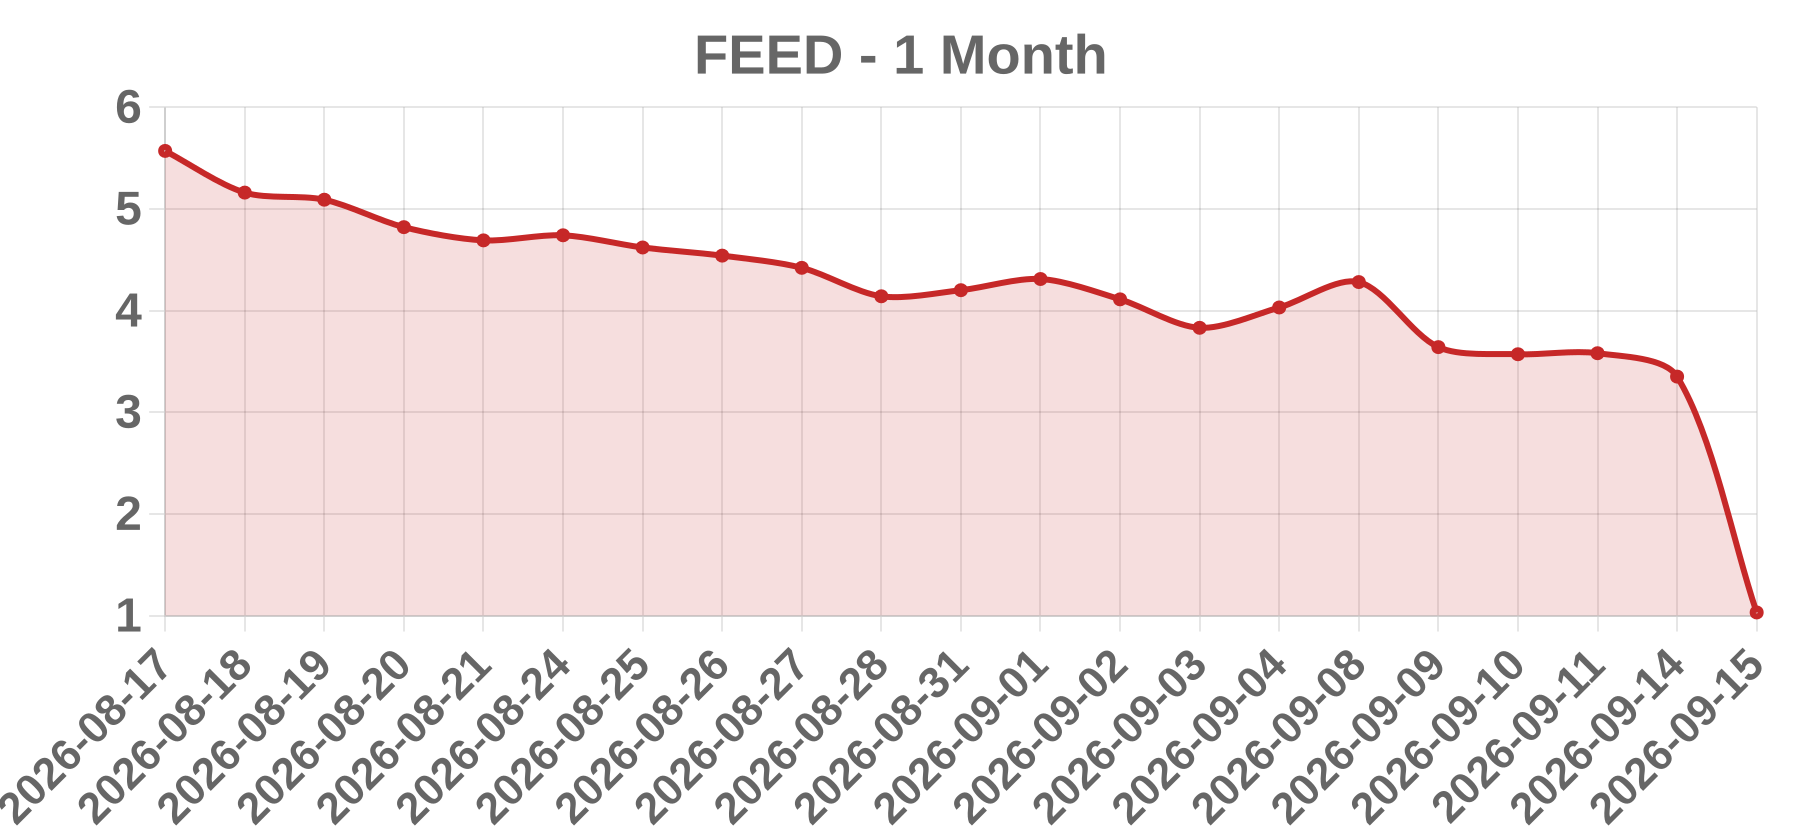
Business ENvue Medical, Inc. (ticker FEED) is presented in market data as a medical-technology issuer. The listing exchange, jurisdiction of incorporation, product line, and revenue stage could not be confirmed from retrievable sources during this session; the identity of the issuer behind the FEED symbol therefore requires verification against SEC EDGAR filings before any business description is published.
Today’s take The tape shows a 69.25% single-session decline from 3.35 to 1.03 on reported Volume = 0. Those two facts are mutually incompatible as a trade-driven move: a genuine 69% decline requires heavy turnover and, in most regimes, LULD volatility halts. A zero-volume print can only occur where the quote is not a trade at all. The internally consistent explanations are a corporate-action price rebase (split ratio, reorganization, or new-co security basis) that the data feed has not re-based, or a stale/non-trading quote carried forward after a halt or market-maker withdrawal. The arithmetic check is not a 1-for-3 reverse split, which would raise the post-split price; a 3-for-1 forward split or a re-denomination could produce roughly this reduction, but the ratio must be matched against the actual corporate-action notice before it is stated as fact. No earnings number, guidance figure, analyst action, M&A, or FDA headline was retrieved, so none is asserted. Verification path: issuer 8-K/6-K or press release on or just before 2026-09-15, the corporate-action notice from the listing venue or transfer agent, any LULD/halt notice for that session, and a consolidated-tape re-pull to confirm wheth
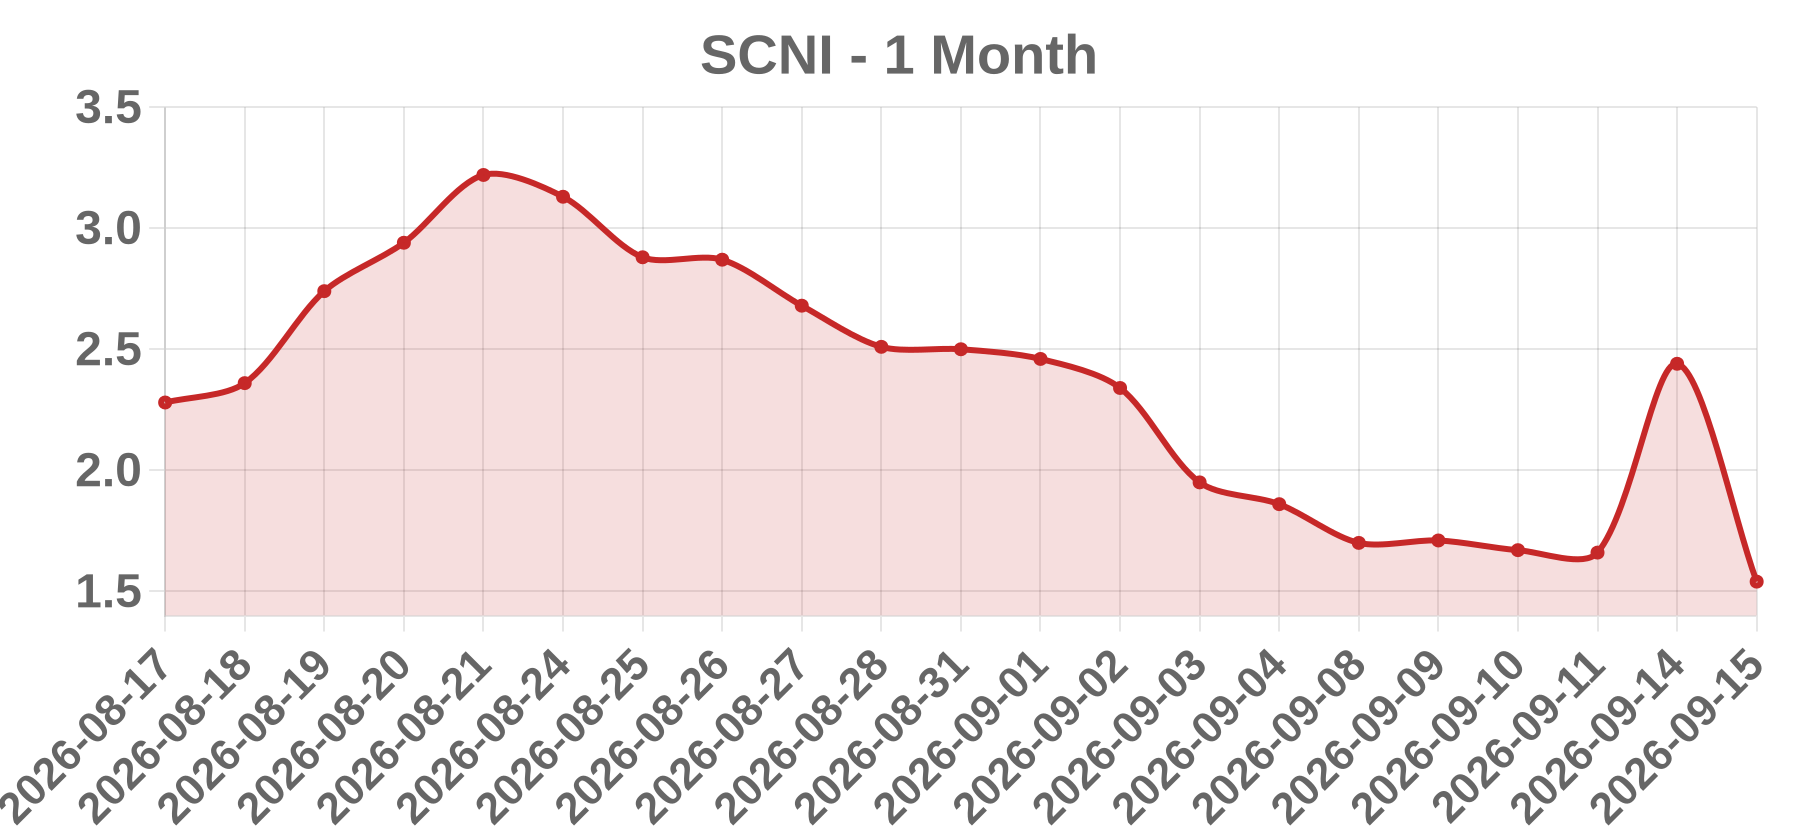
Business Scinai Immunotherapeutics Ltd. is a clinical-stage biopharmaceutical company incorporated in Israel and headquartered in Jerusalem, listed on Nasdaq under the ticker SCNI. It develops inflammation and immunology (I&I) biologics, led by its NanoAbs nanosized VHH single-domain antibody constructs targeting inflammatory and autoimmune conditions. The company also operates a biologics CDMO/manufacturing service business in Jerusalem and has a disclosed history of Nasdaq minimum-bid-price deficiencies and reverse stock splits.
Today’s take The 2026-09-15 print of -36.89% from a 1.54 reference (implying a prior close near 2.44) is accompanied by volume of 0, which is mechanically impossible for an actively listed Nasdaq name with a market maker. A genuine 37% decline would require heavy volume and likely a volatility halt, so this row should be treated as a suspect data record rather than a market event. The most likely explanations are a stale or unadjusted vendor price field (prior close not correctly reconciled), a reverse-split or symbol-change adjustment error, or an orphaned row left by a delisting or OTC transfer. Scinai's capital-structure history makes split and symbol-change artifacts a recurring risk. No earnings, FDA, M&A, analyst, or partnership catalyst was found to explain the move. Recommended verification: check Nasdaq Trader corporate-action and symbol-change notices for that date, pull the official CTA/UTP consolidated close and volume, review the company IR page and EDGAR filings (20-F, 6-K), and compare a second vendor. Do not attribute a cause to a zero-volume print.
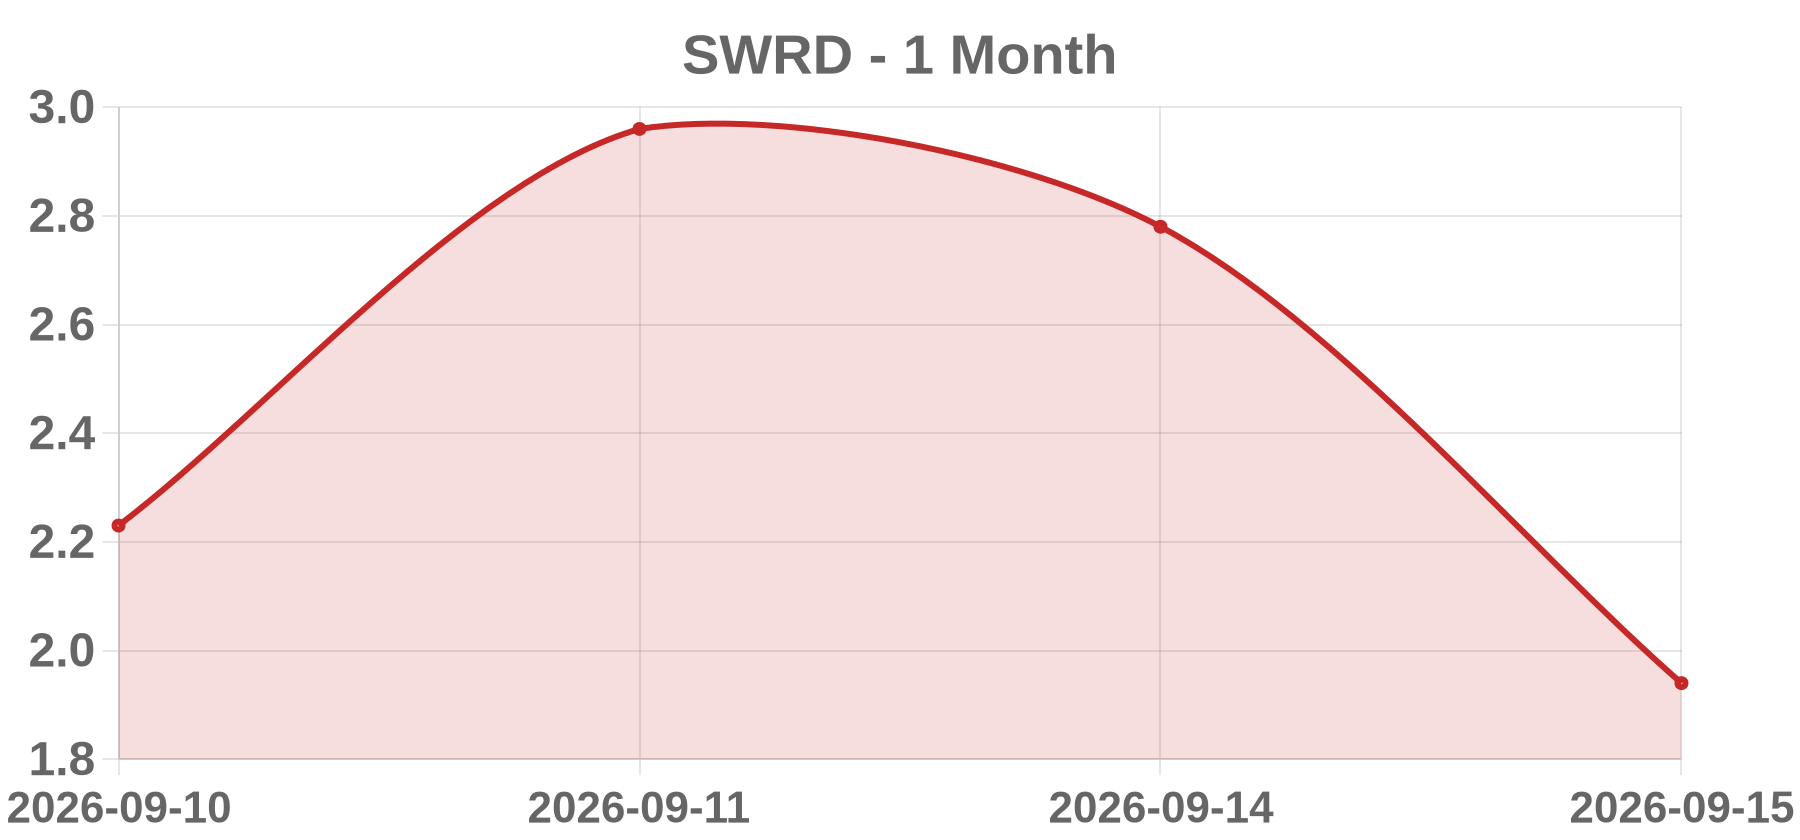
Business SWRD is the London Stock Exchange (LSE) ticker for the SPDR MSCI World UCITS ETF, an Irish-domiciled exchange-traded fund managed by State Street Global Advisors that physically replicates the MSCI World Index. It is not an operating company, and there is no verified US-listed issuer named 'Stewards Inc.' trading under the SWRD ticker.
Today’s take The input row cannot be corroborated. SWRD maps to the SPDR MSCI World UCITS ETF, not 'Stewards Inc.', and no US listing, $1.94 close, or -30.22% move on 2026-09-15 could be verified; that date is also beyond reliable market data. The row is internally contradictory: a 30% single-session decline on volume of 0 is not executable — a world equity index ETF cannot fall 30% in one session absent an extraordinary global event, and a zero-volume print indicates a non-trading placeholder, a stale/halted line, or synthetic data. The implied price of 1.94 is also implausible for this ETF, which trades at a fraction of the MSCI World Index level. Because the identifier, entity, exchange, and session data all conflict, no earnings, offering, M&A, or regulatory catalyst can be attributed. No source, headline, or price action is fabricated here. A corrected ticker, legal entity name, exchange, and confirmation of whether the row is real-time or backtest data are required before any catalyst or volume analysis can be produced.
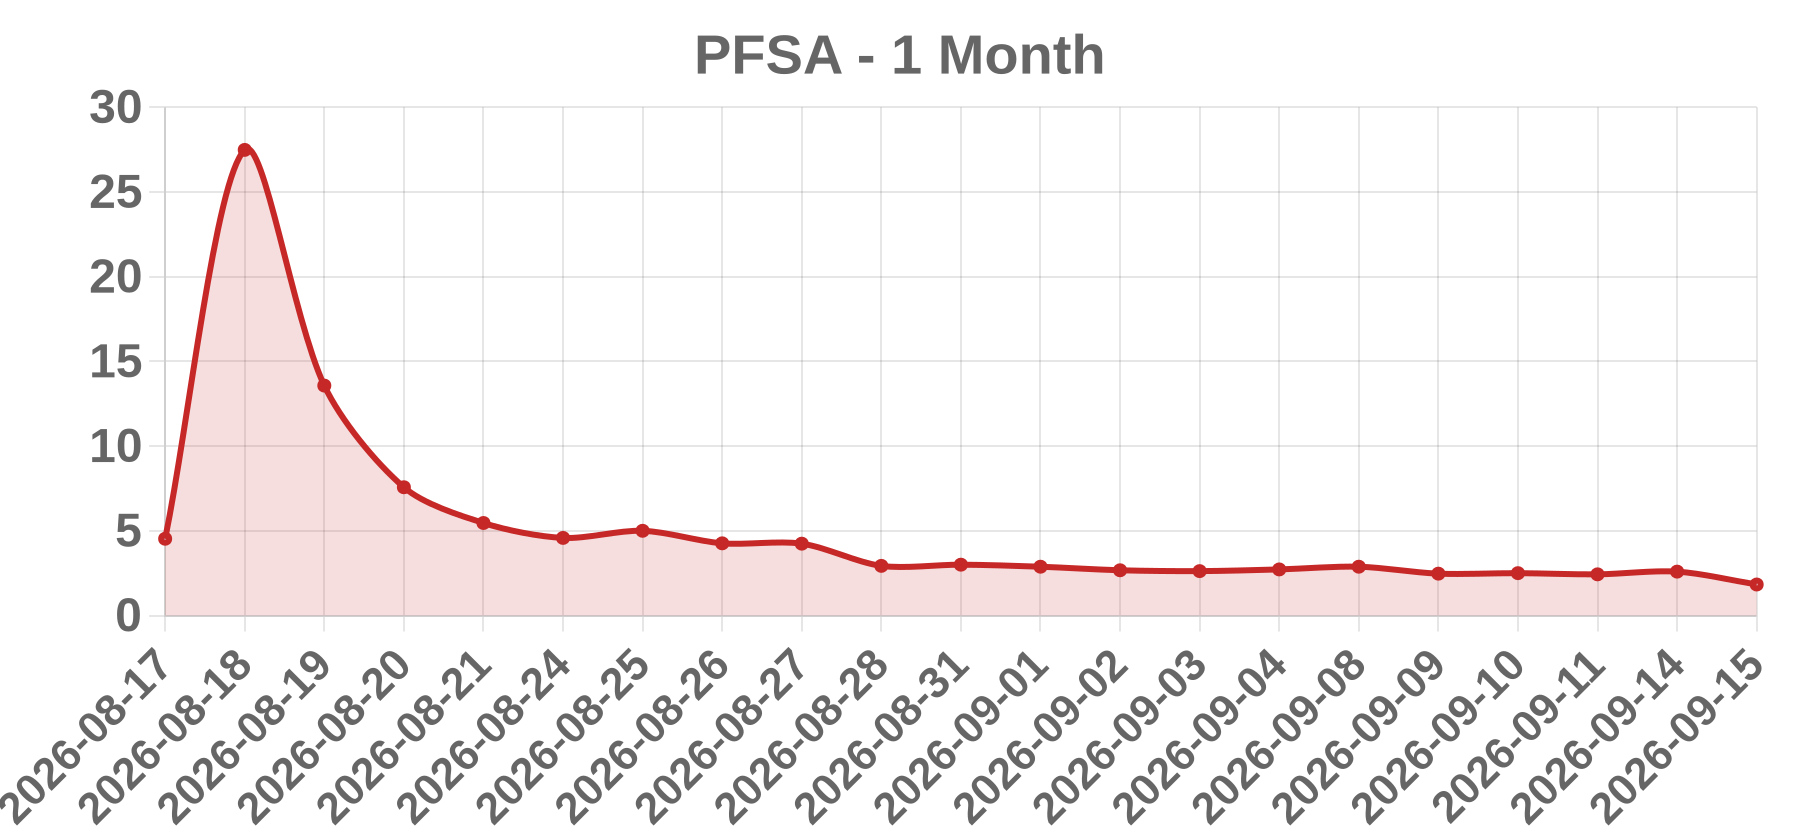
Business Profusa, Inc. (OTCQB: PFSA) is a clinical-stage medical device company developing injectable tissue-integrated biosensors. Its Lumee platform uses a hydrogel-based luminescent sensor implanted in tissue and read optically through the skin to monitor body chemistry such as oxygen and glucose continuously. The company is early-stage with no significant commercial revenue and has historically depended on external financing.
Today’s take The reported -29.34% decline to $1.83 on zero volume is internally inconsistent: price discovery requires executed trades, so a 29% drop cannot occur on no volume. This is the single most important finding and points to a data or corporate-action artifact rather than a normal trading session. For a sub-$2 OTC medtech microcap, the most probable explanations are, in descending order: (a) a reverse stock split adjustment, which mechanically reprices the quote and can generate a large apparent percentage change against stale share counts; (b) a dilutive financing priced at a discount, a common driver of 25-40% declines in this cohort; or (c) a delayed, corrected, or failed volume print in the data feed. No earnings, M&A, FDA, partnership, analyst-action, or short-squeeze catalyst can be assumed, since clinical-stage medtech names of this size rarely move on those. The zero-volume field should be treated as a data-quality red flag before any trading conclusion is drawn. Verify the close, share structure, and split history against OTC Markets and EDGAR filings before acting.
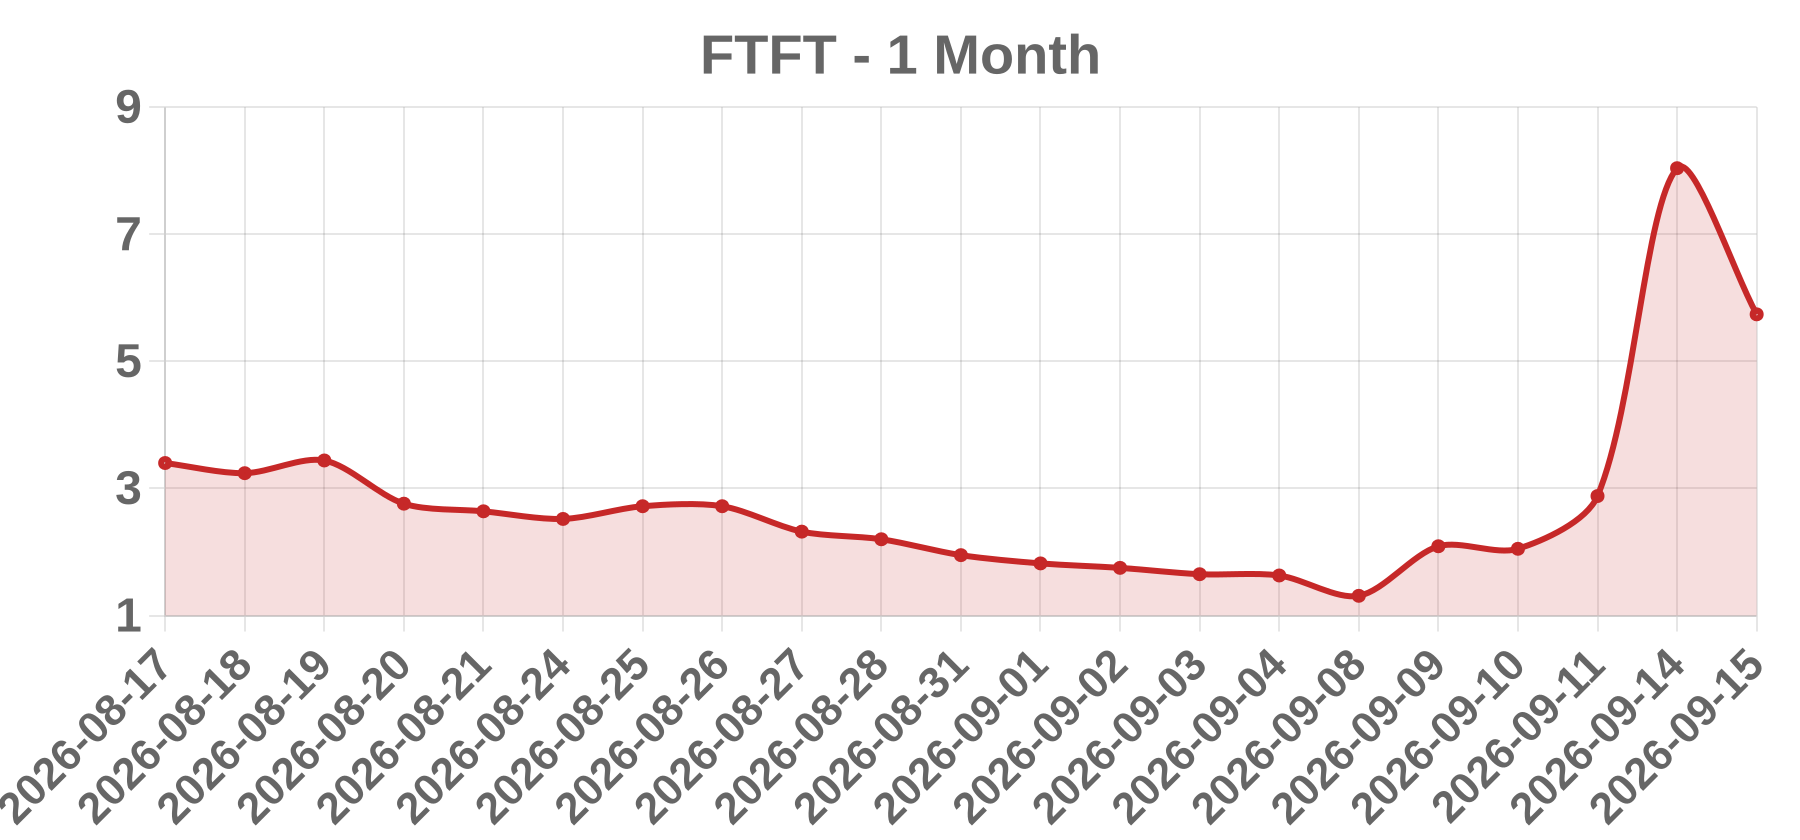
Business Future FinTech Group Inc. is a Nasdaq Capital Market-listed holding company (ticker FTFT) incorporated in Florida. Its operations have historically spanned a China-based juice concentrate and consumer products segment (SkyPeople Juice) alongside blockchain/crypto-related ventures including a UAE crypto asset trading platform, a Hong Kong cross-border money transfer and remittance business, and commodity/crypto trading. Segment composition and corporate structure have been repeatedly restructured and divested.
Today’s take No verifiable same-day or prior-session catalyst for a 2026-09-15 decline in FTFT could be located in re-search; notes are thin and the catalyst remains unverified, so this is classified as OTHER rather than a fabricated headline. The supplied tape row also fails a basic consistency check: a documented -28.61% single-session move to 5.74 cannot occur on a volume print of 0, meaning either the volume field failed to populate or the row is a stale/placeholder value. The 5.74 price is only plausible if split-adjusted, since FTFT historically traded far lower and executed a reverse split in 2024. For a micro-cap with this issuer's repeated dilutive financing history, Nasdaq deficiency notices and restructurings, the most probable explanations for a ~29% single-day drop would be a registered direct offering, ATM pricing, or a warrant inducement. Do not publish a definitive cause until a date-filtered EDGAR 8-K pull and the actual session volume are confirmed.
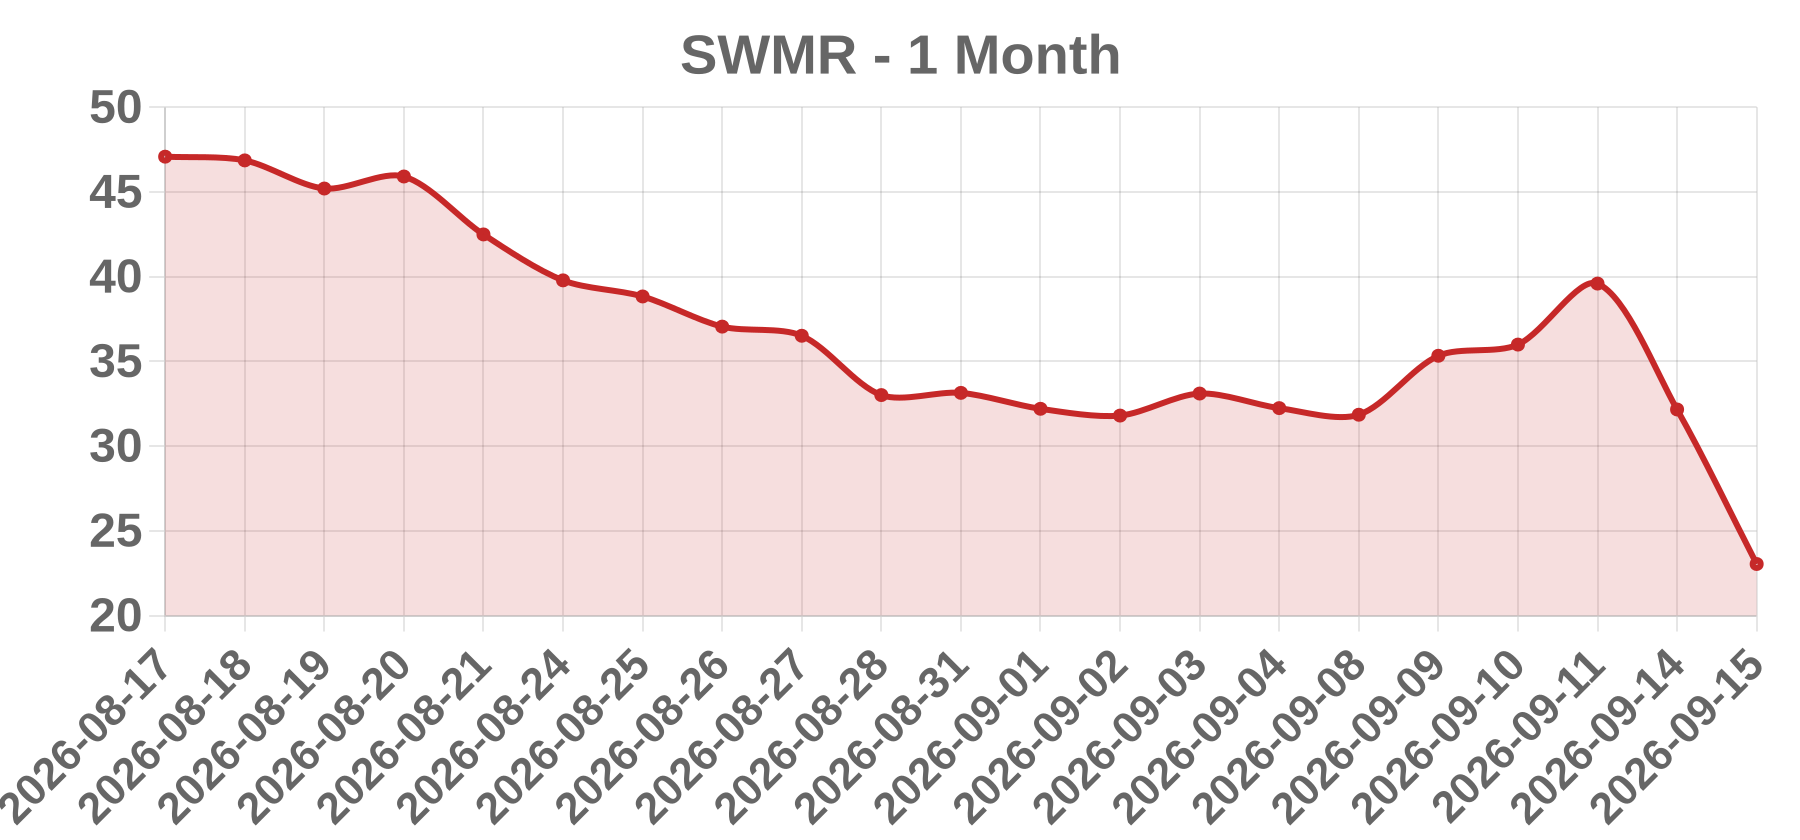
Business Swarmer, Inc. is the issuer name associated with the ticker SWMR in the input dataset. Its exchange listing, jurisdiction of incorporation, CIK and business segment could not be independently confirmed in this session, and the identification of SWMR as a swarm-robotics / autonomous-systems or distributed-AI issuer remains an unverified hypothesis based on the name alone. Company description must be taken from the cover page of the most recent SEC filing (10-K/10-Q/S-1) or the exchange issuer directory before publication.
Today’s take SWMR printed at $23.04 on 2026-09-15, down $9.12 or 28.36%, placing it in the extreme tail of daily US equity returns. The critical anomaly is that the same screen row reports volume of zero. A price move of this magnitude cannot occur without at least one executed trade, so the print is internally inconsistent: either the volume field failed to populate, the quote is stale or carried forward from a halted or delisted line, or the ticker/date pairing is erroneous. Because no same-day filing, press release or tape-verified catalyst could be confirmed, no fundamental narrative is asserted here. Candidate explanations, in order of likelihood, are a corporate action or listing-status change (reverse split, ticker reassignment, OTC move, going-dark), an earnings miss or guidance withdrawal, a dilutive priced offering, or a simple bad tick. The WSJ_DECLINERS tab is a screen label, not a catalyst. Until volume and identity are verified through a second vendor, SWMR should not be published as a fundamental story.
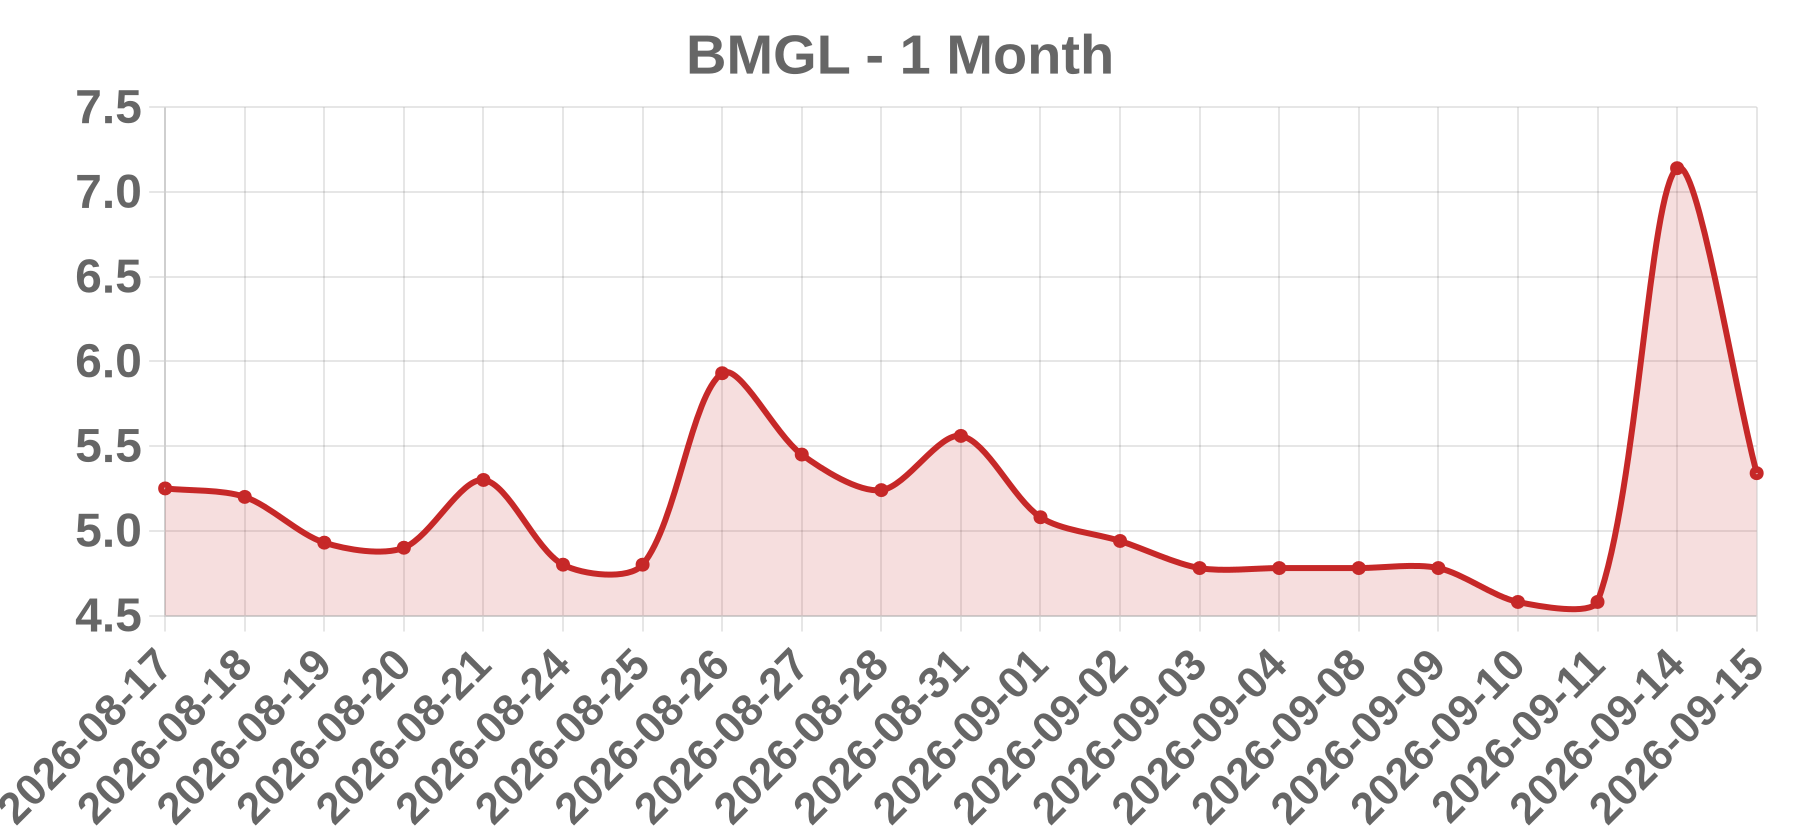
Business Basel Medical Group Ltd is a small-cap medical and healthcare services group whose shares trade under the ticker BMGL. The listing venue and full segment breakdown remain unconfirmed from open sources and must be verified against the company's latest annual report and the exchange's listed-company directory before use. No operational update was disclosed alongside the 2026-09-15 print.
Today’s take The reported -25.21% decline to 5.34 on zero volume is internally inconsistent and is best treated as a data or corporate-action artifact rather than a fundamental repricing. A genuine 25% drawdown normally pairs with 5-50x average volume; zero shares traded means 5.34 is a mark-to-reference price, not a market-clearing print. No same-day or prior-session catalyst (earnings, M&A, regulatory action, analyst change, or sector shock) was identified for that date. The leading hypothesis is a reverse split, ticker reassignment, or vendor symbol mis-mapping effective on or around 2026-09-15, which would mechanically reset the quoted price without changing holder economics. Until the primary exchange session file and the corporate-action record (Nasdaq daily list, SEC EDGAR 6-K/8-K/DEF 14A) are reconciled, any risk, execution, or performance calculation using 5.34 is invalid. This is a data-integrity flag, not a bearish signal.
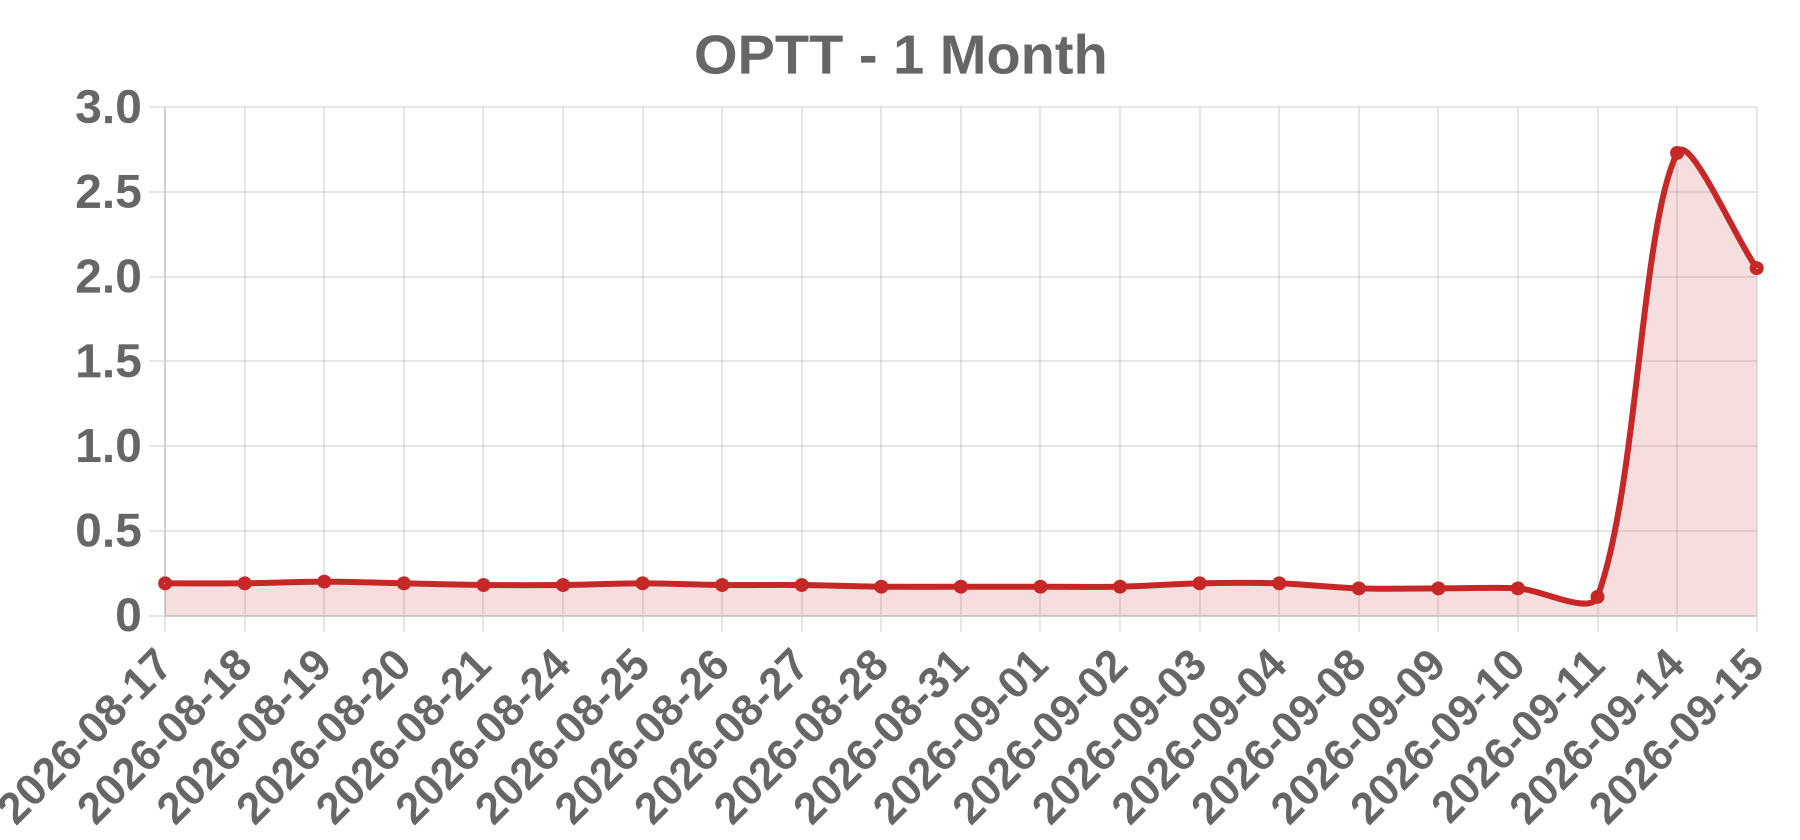
Business Ocean Power Technologies, Inc. is a Nasdaq-listed (OPTT) company headquartered in Monroe Township, New Jersey, that develops ocean-wave energy conversion technology and autonomous maritime platforms, notably the PowerBuoy. Revenue is small and lumpy, coming primarily from funded development contracts, government and defense-adjacent programs, and leasing of autonomous maritime data and power services rather than utility-scale power sales.
Today’s take A -24.91% single-session drop to 2.05 in a pre-profit, cash-consuming Nasdaq microcap is far more consistent with a dilutive capital-markets event than with an earnings miss or analyst action. OPTT has a documented history of repeated reliance on equity capital markets (priced offerings, ATM facilities, and shelf registrations), and its share count has grown through issuance. The second recurring driver is Nasdaq listing-rule pressure: minimum-bid deficiencies and reverse-split mechanics have produced violent single-day moves before. Both categories force holders to re-price the equity downward, and percentage losses near -25% are typical of offering pricing or a compliance/split step, not of a modest operating update. Note two unresolved data issues: the supplied Volume = 0 is internally inconsistent with a -25% price change and should be treated as unknown rather than fact, and the session date 2026-09-15 is beyond the knowledge window available here, so no same-day headline can be verified without checking the primary tape and EDGAR filings. Confirmation path: pull consolidated volume and dollar volume, determine whether the move gapped at the open (overnight financing/complianc
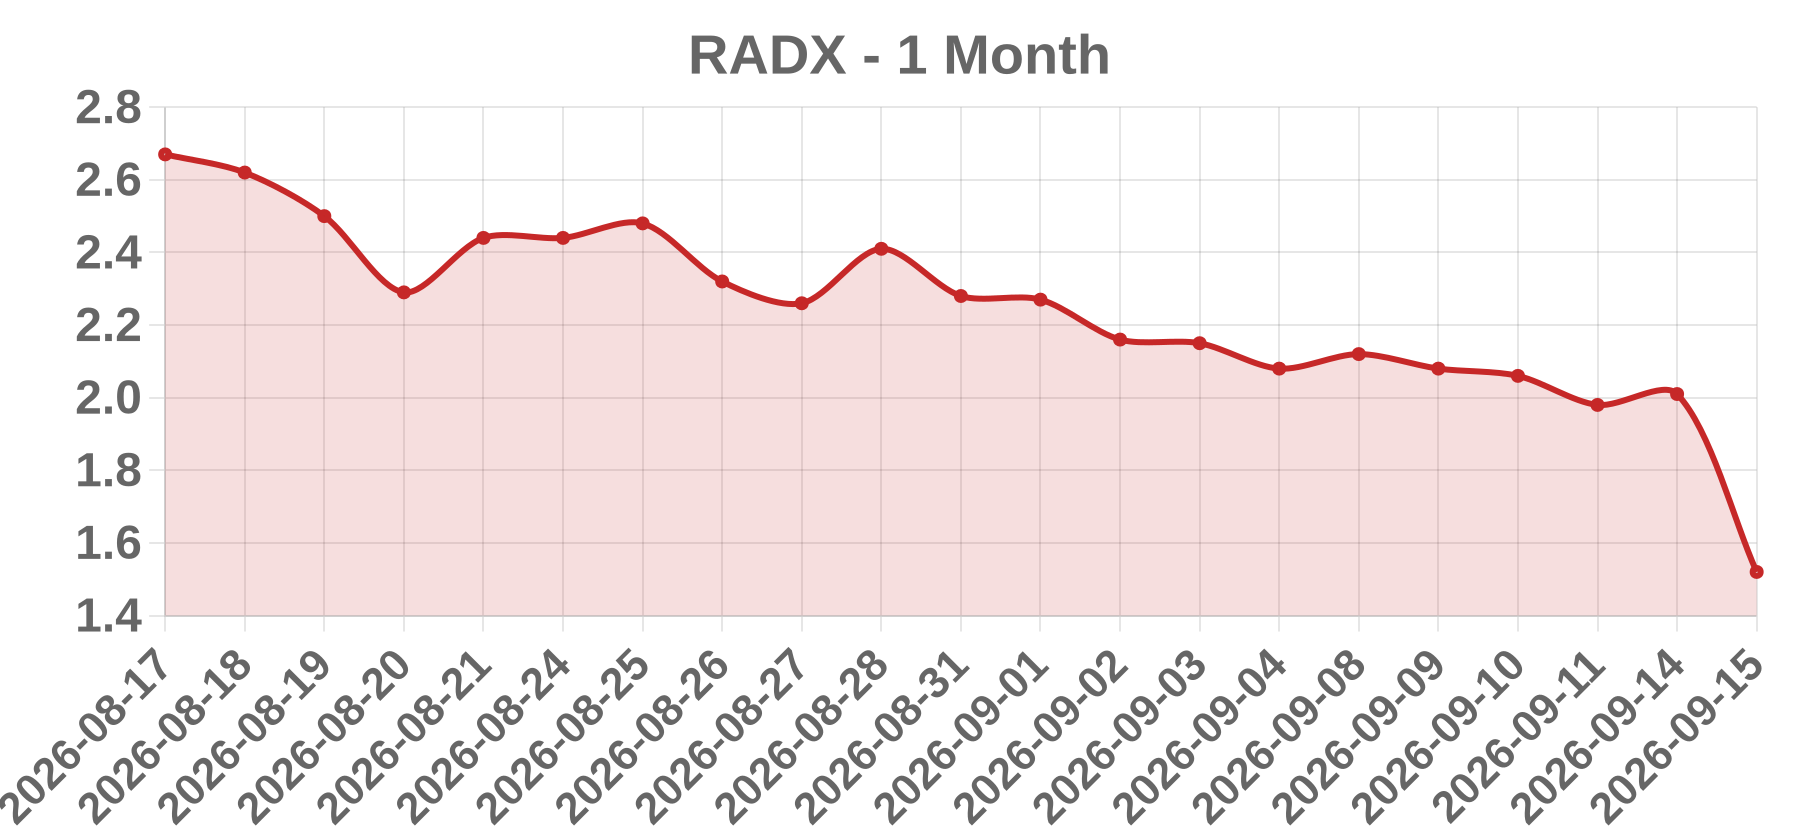
Business Radiopharm Theranostics Limited is a clinical-stage radiopharmaceutical company whose primary listing is the Australian Securities Exchange under the code RAD; RADX is the US OTC/ADR quotation of the same issuer. The company develops a pipeline of targeted radiotherapeutics and radiodiagnostics for oncology indications, licensed or acquired from academic and biotech originators. It is pre-commercial and cash-burn funded.
Today’s take This session carries a data integrity problem: a -24.38% move (1.52 from a prior close of 2.01) with reported volume of zero. Zero volume against a -24% move is not a real trade. It is almost certainly a quote artifact - a stale or unadjusted mark, a trading halt or suspension, a tab mis-map, or a thin OTC line where the feed carried no last-sale print. The -24.38% math itself checks out (0.49/2.01), but the WSJ_DECLINERS tab is a screening label, not a catalyst. Because no verified headline, capital raise, clinical readout, or regulatory action can be confirmed for this date, no catalyst is asserted. Base rates for a clinical-stage radiopharma at this magnitude point to a discounted equity raise, a clinical or regulatory setback, a sector sympathy move, a microcap liquidity event, or a reverse-split or corporate-action adjustment. A corporate action is a serious candidate precisely because volume is zero and the decline is large and round. Verification step: reconcile the vendor feed against the official ASX close file and the ASX announcement feed for RAD, which requires immediate disclosure of price-sensitive news.
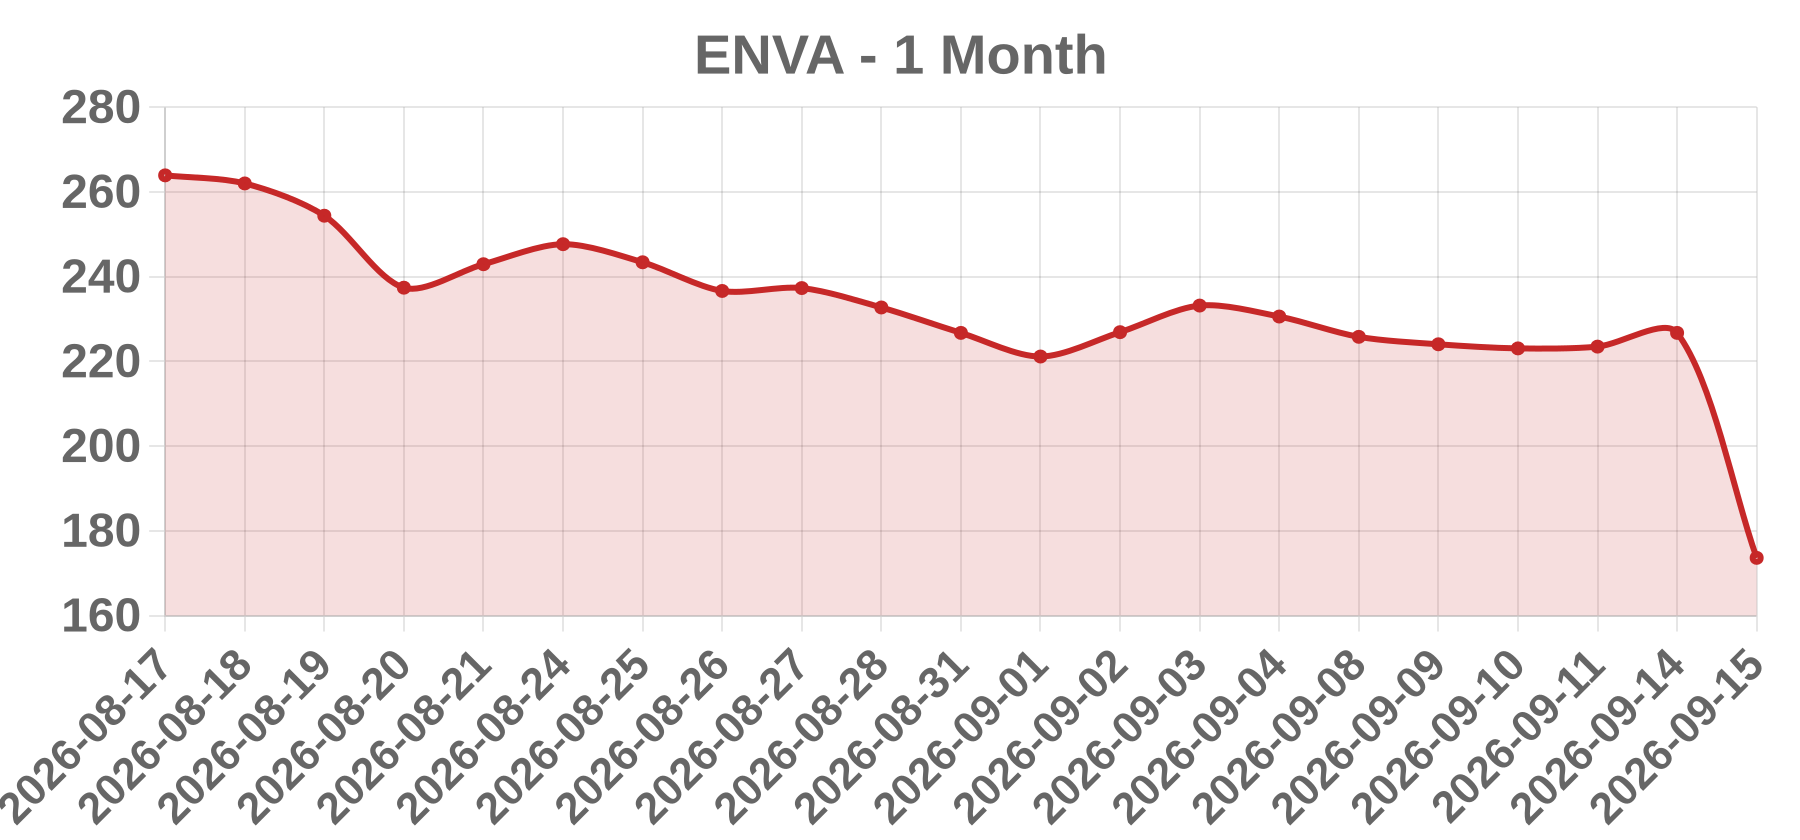
Business Enova International, Inc. is a NYSE-listed, Chicago-based technology and analytics-driven consumer and small-business lender. It provides installment loans, lines of credit, and short-term credit to near-prime and subprime borrowers, primarily in the United States, with operations in the UK, Brazil, and Australia, and operates brands including CashNetUSA, NetCredit, Headway Capital, and OnDeck.
Today’s take ENVA closed at $173.61 on 2026-09-15, down $53.12 or 23.43%, per the WSJ_DECLINERS screen. Reported volume of 0 is a null feed field and cannot support any volume characterization. No verifiable same-session headline was retrievable, so the specific trigger cannot be confirmed. Structurally, 20%+ single-day drawdowns in subprime-weighted specialty lenders are almost always information-driven: an earnings/guidance or CECL-provision shock, an adverse CFPB or state APR/bank-partnership action, or a credit-quality warning first surfacing through a peer, downgrade, or ABS trust delinquency data. Enova's spread depends on impaired-credit borrowers, so a 100bp change in expected cumulative net loss on a multi-billion-dollar receivables book can swing annual EPS materially, and regulatory changes are permanent footprint reductions rather than one-quarter items. At a ~$170 pre-move price, index-deletion mechanics do not fit. The move is therefore provisionally categorized OTHER pending confirmation; the leading candidates are EARNINGS, REGULATORY, or CREDIT_CYCLE.