US common stocks / ADRs: top 10 by volume; top 10 gainers (by % change, volume as tie-breaker); top 10 losers (by % change, prefer liquid names). Deep notes cover the de-duplicated set across the three boards.
30 names on this page · volume 10 · gainers 10 · losers 10
Order: volume board → gainers → losers; each ticker appears once. Summaries of public information only — please verify primary sources.
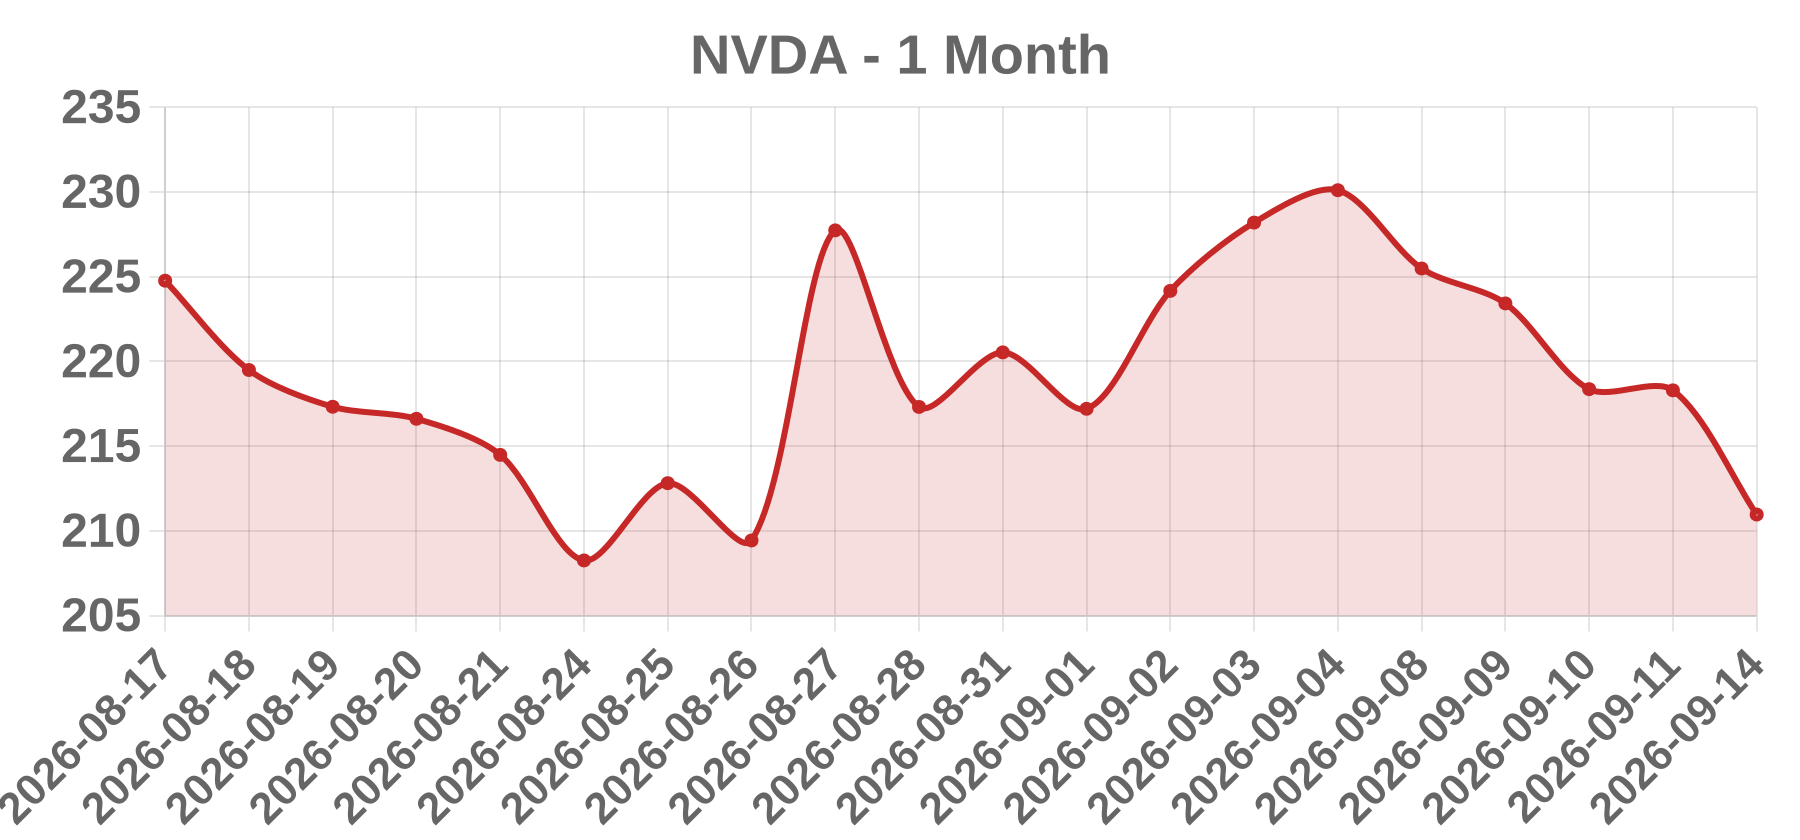
1/10NVDA NVDA
-3.36%
Close 210.96 · Vol 131.68M · Type: Sector
Approx. 1-month price (illustrative)
Business NVIDIA Corporation is a Delaware-incorporated, NASDAQ-listed semiconductor and accelerated-computing company (ticker NVDA, SEC CIK 0001045810). It designs data-center GPUs, the CUDA software platform, DGX/HGX systems, NVLink/NVSwitch interconnect, InfiniBand/Spectrum-X networking, and DRIVE automotive platforms, reporting across Data Center, Gaming, Professional Visualization, Automotive, and OEM & Other segments.
Today’s take The quoted session (2026-09-14, close 210.96, -3.36%, 131.68M shares) could not be verified against any retrieved source, so this is input data, not a confirmed finding. The most plausible catalyst classification for a roughly 3% NVDA down-day on heavy volume with no company-specific filing is a sector-wide AI/semiconductor de-rating (SECTOR), with macro/rates risk-off (MACRO) as the main alternative. Historically such moves reflect correlated selling across NVDA, AMD, AVGO, MU and TSM ADRs, rate-sensitive multiple compression, dealer hedging around large options open interest, or index/ETF flows, rather than an idiosyncratic fundamental break. A genuine fundamental event (guidance cut, export-control ban, order cancellation) normally produces a larger gap plus a named headline, neither of which is confirmed here. Analyst rating changes, hyperscaler capex commentary and supply-chain headlines remain unverified secondary possibilities. Treat the catalyst and the print as unconfirmed pending primary-source retrieval.
Business Intel Corporation is a Delaware-incorporated semiconductor company listed on the NASDAQ Global Select Market under ticker INTC. It designs and manufactures CPUs for client and data-center markets, AI accelerators, networking and edge silicon, and is pivoting toward a contract foundry model built on its advanced Intel 18A and 14A nodes. Reportable segments have historically included Client Computing Group, Data Center & AI, Network & Edge, and Intel Foundry, plus Mobileye and Altera.
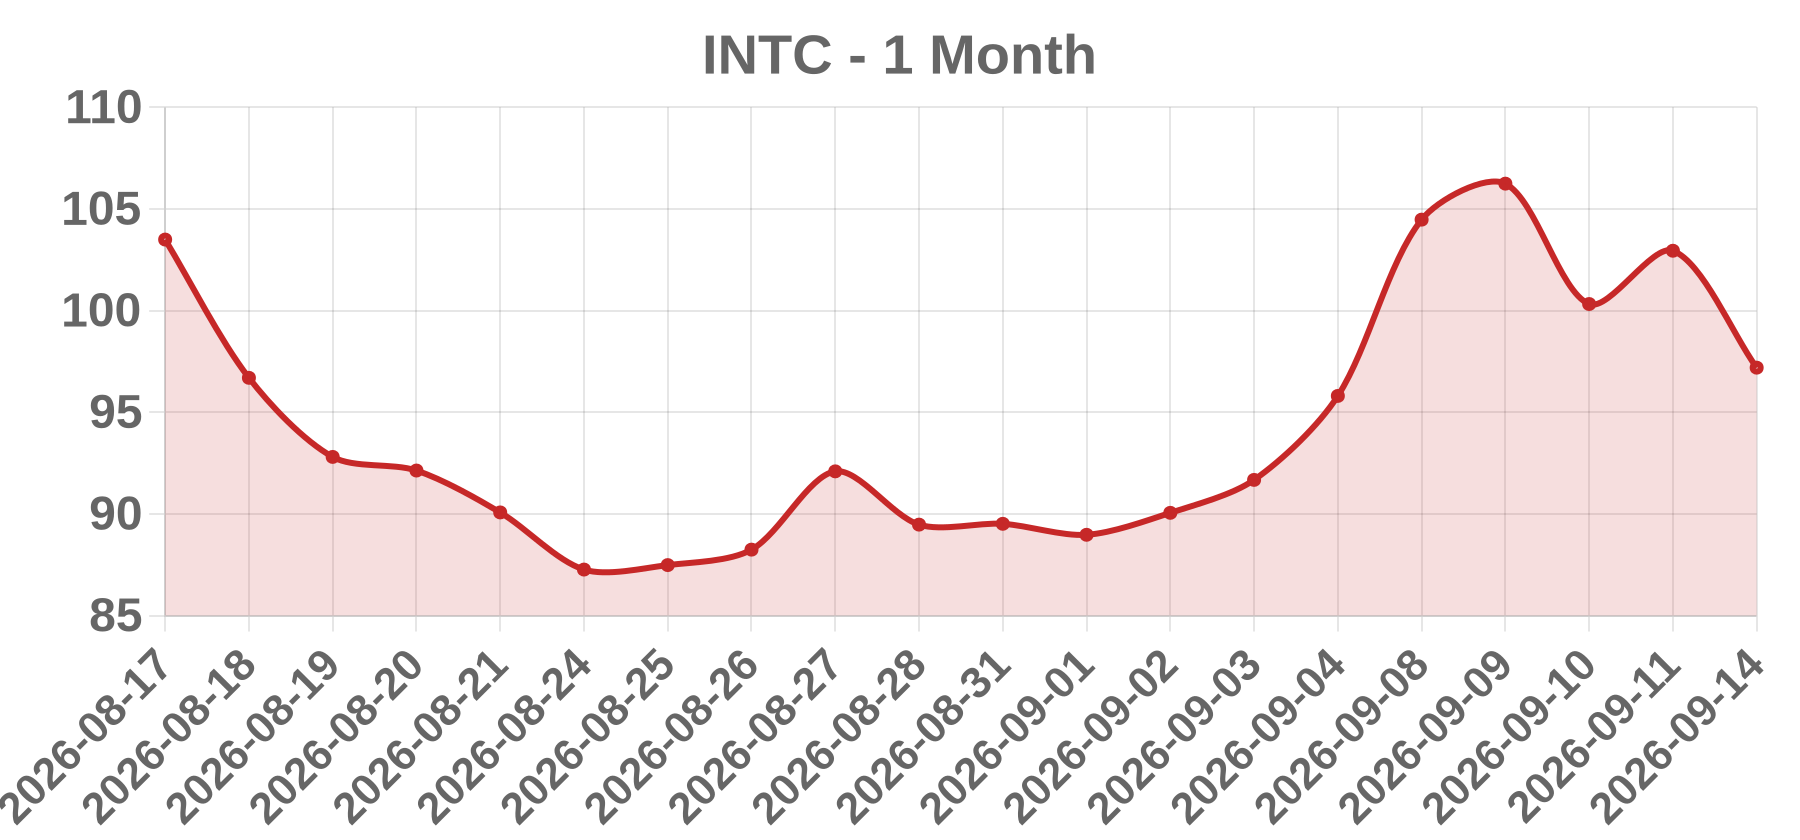
Today’s take INTC closed at $97.19 on 2026-09-14, down 5.59% (-$5.75) on roughly 95.89M shares, a high-attention session that placed the name on the WSJ Actives list. The magnitude and volume profile are consistent with a news- or sector-driven repricing rather than ordinary drift. However, no verifiable same-day catalyst dated 2026-09-14 was retrieved during this research pass; no company press release, wire headline, or analyst action tied to that exact session could be confirmed. Given INTC's current narrative, the highest-probability catalyst classes are foundry or node-related headlines (Intel 18A/14A customer or yield news) or a semiconductor-sector selloff driven by AI-capex digestion fears. The government equity stake (~10%, August 2025) and Nvidia's $5B investment keep the stock in a high-beta, headline-sensitive regime. Treat the SECTOR tag as suggested, not confirmed. Verify against Intel Investor Relations, Reuters, and a licensed terminal before relying on any single driver.
Business Ondas Inc. (NASDAQ: ONDS) is a U.S. technology holding company focused on private wireless data networks and autonomous drone systems for critical infrastructure, industrial, and defense-adjacent customers. Its segments have historically included Ondas Networks (FullMAX/LTE private broadband for railroads and utilities) and American Robotics / Airobotics (Ondas Autonomous Systems). It is a small-cap, high-beta, retail- and momentum-sensitive equity.
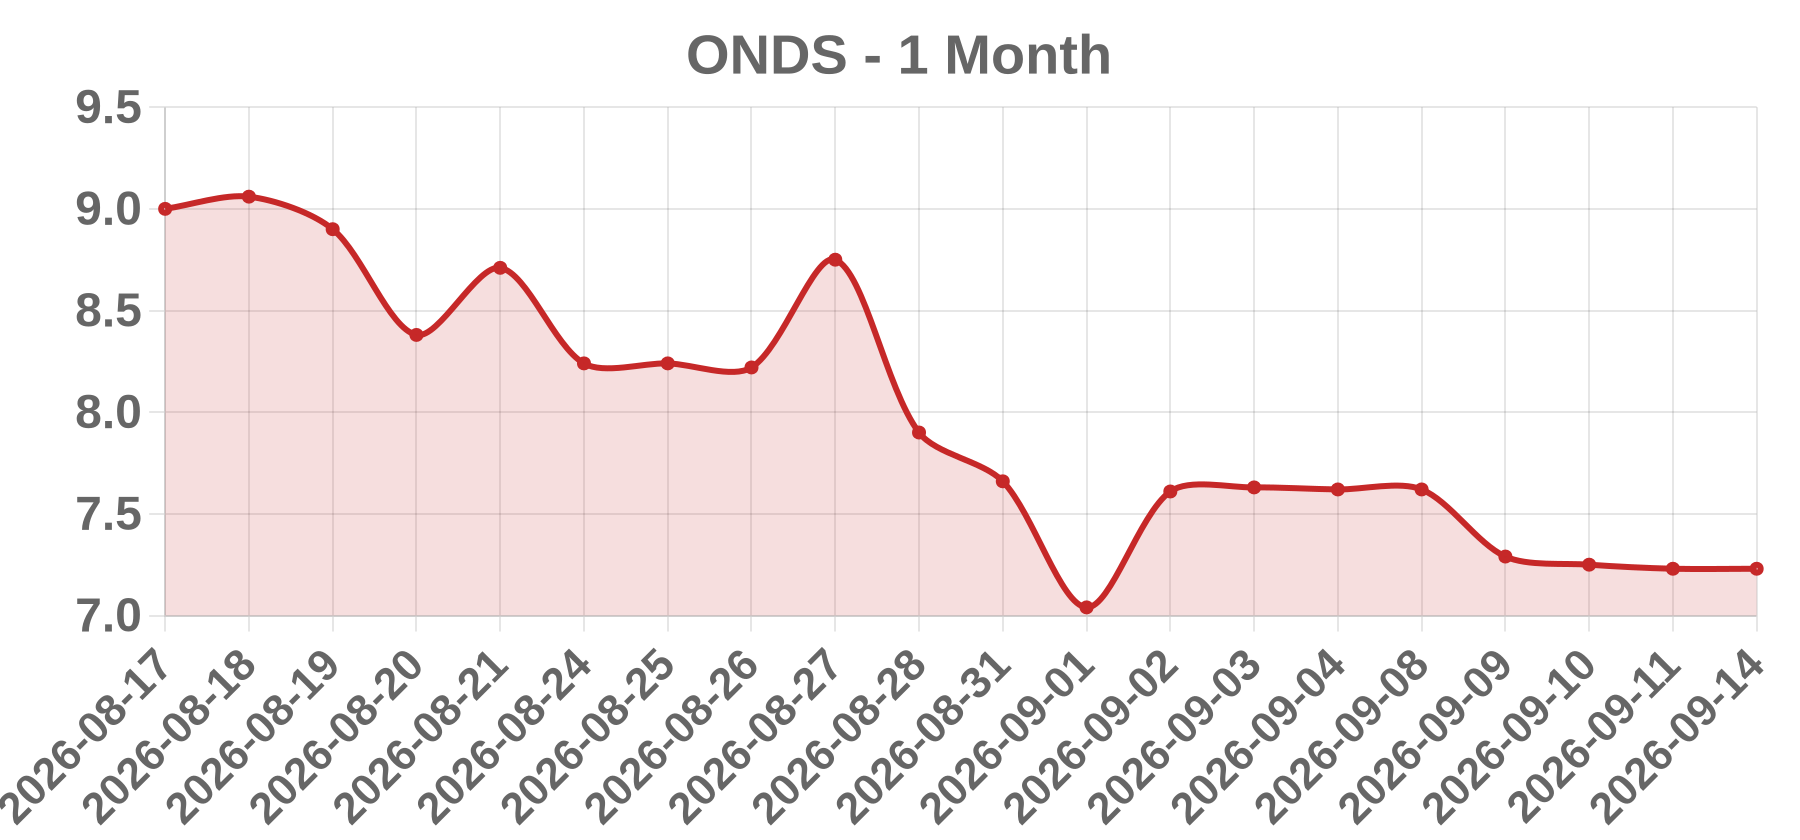
Today’s take No verifiable, confirmed catalyst could be established for the 2026-09-14 session for ONDS. The print itself is internally inconsistent: an exactly flat close (7.23, +0.00%) on 84,090,000 shares is not a normal trading outcome. A zero-percent change on extraordinarily high share volume most commonly indicates one of three things: (1) a data artifact, such as a stale or duplicated price field, an unadjusted close, or a feed misalignment; (2) a halt-then-resume, a late cross, or a closing-auction-only print; or (3) a rounding artifact where the true change is smaller than displayed tick precision. Analysts should validate the 7.23 close against the official exchange consolidated tape or a second data vendor before attributing any narrative. Candidate catalysts reviewed and NOT confirmed include earnings, M&A, analyst rating or target changes, index inclusion, shelf/ATM or convertible issuance, government contract awards, and short-squeeze dynamics. Catalyst enum: OTHER, reflecting an unconfirmed/no-catalyst-found session pending data-quality resolution.
Business American Airlines Group Inc. is a major U.S. network legacy carrier listed on the Nasdaq Global Select Market under the ticker AAL. It operates domestic and international passenger service, regional flying through wholly owned and partner carriers, cargo operations, and the AAdvantage loyalty program. Key profit drivers include jet fuel costs, unit revenue (PRASM/TRASM), capacity (ASMs), corporate and international demand, and balance-sheet leverage. Main peers are Delta, United, Southwest, Alaska Air, and JetBlue.
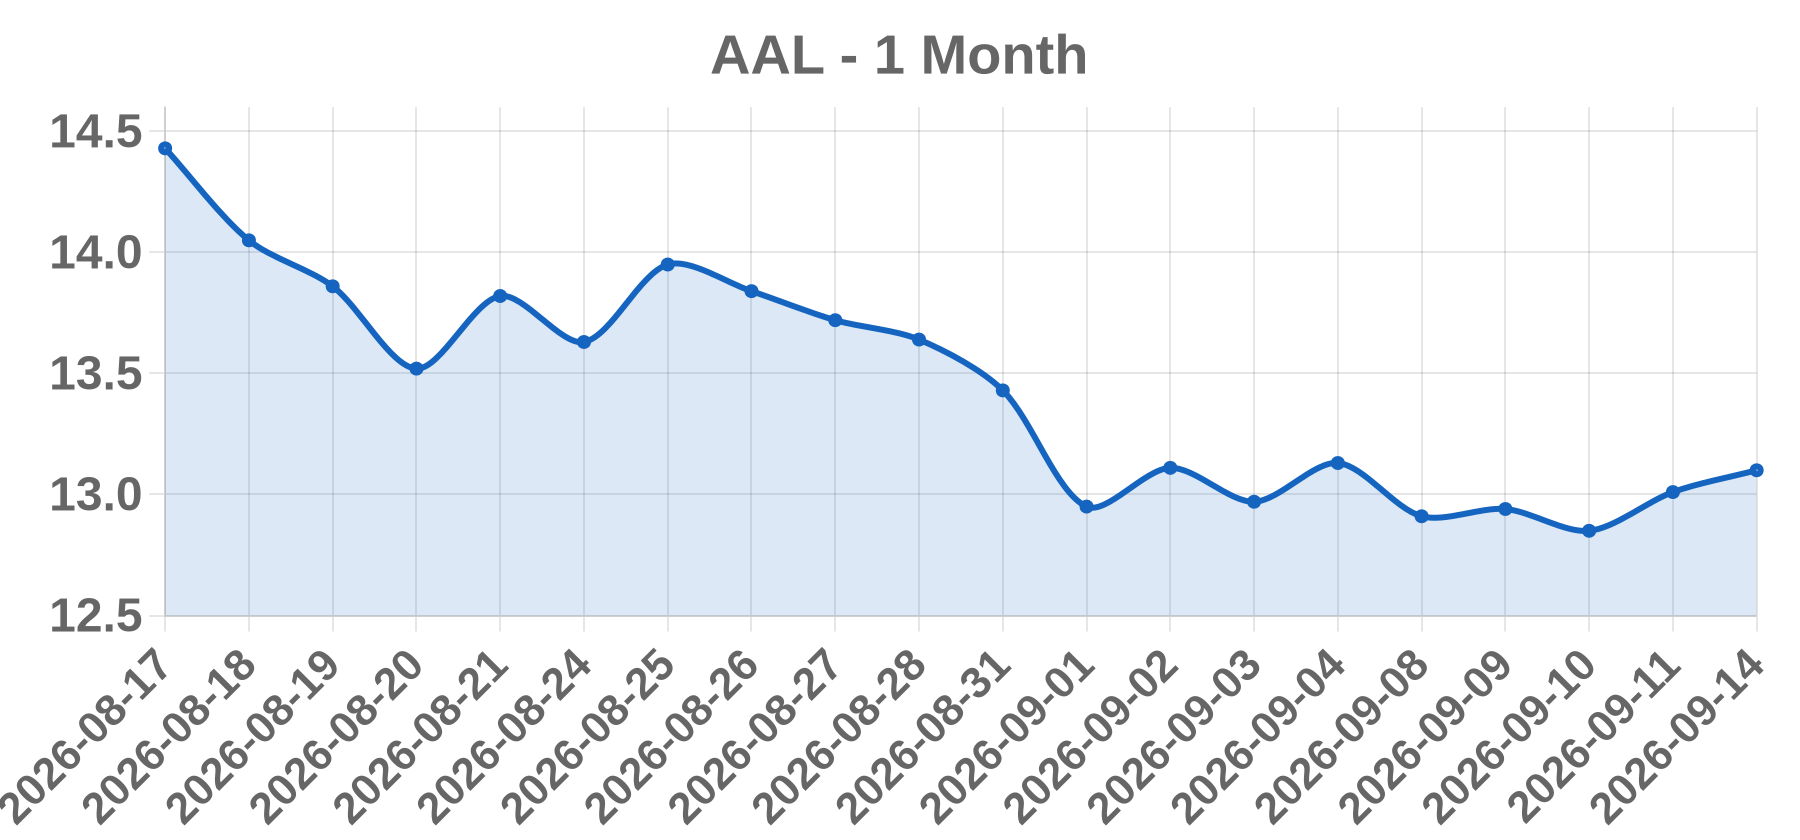
Today’s take AAL represents American Airlines Group, a large-cap legacy carrier where daily price action is dominated by sector-level factors rather than company news. A move of roughly +0.69% is small relative to AAL's typical daily range and is best explained as sector sympathy and macro fuel sensitivity rather than an idiosyncratic catalyst. Airlines trade as a proxy for jet fuel, interest rates, and broad travel demand; even modest moves in crude or in peer airline sentiment (Delta, United) mechanically produce sub-1% moves in AAL. AAL's high beta and heavy retail ownership amplify sector tape but rarely create discrete single-day events. No verified company-specific catalyst (earnings, guidance, capital action, or M&A) is identified in the supplied research; that research explicitly states it has no same-day confirmation of the print or the session context. Readers should note the catalyst classification as sector-level rather than event-driven.
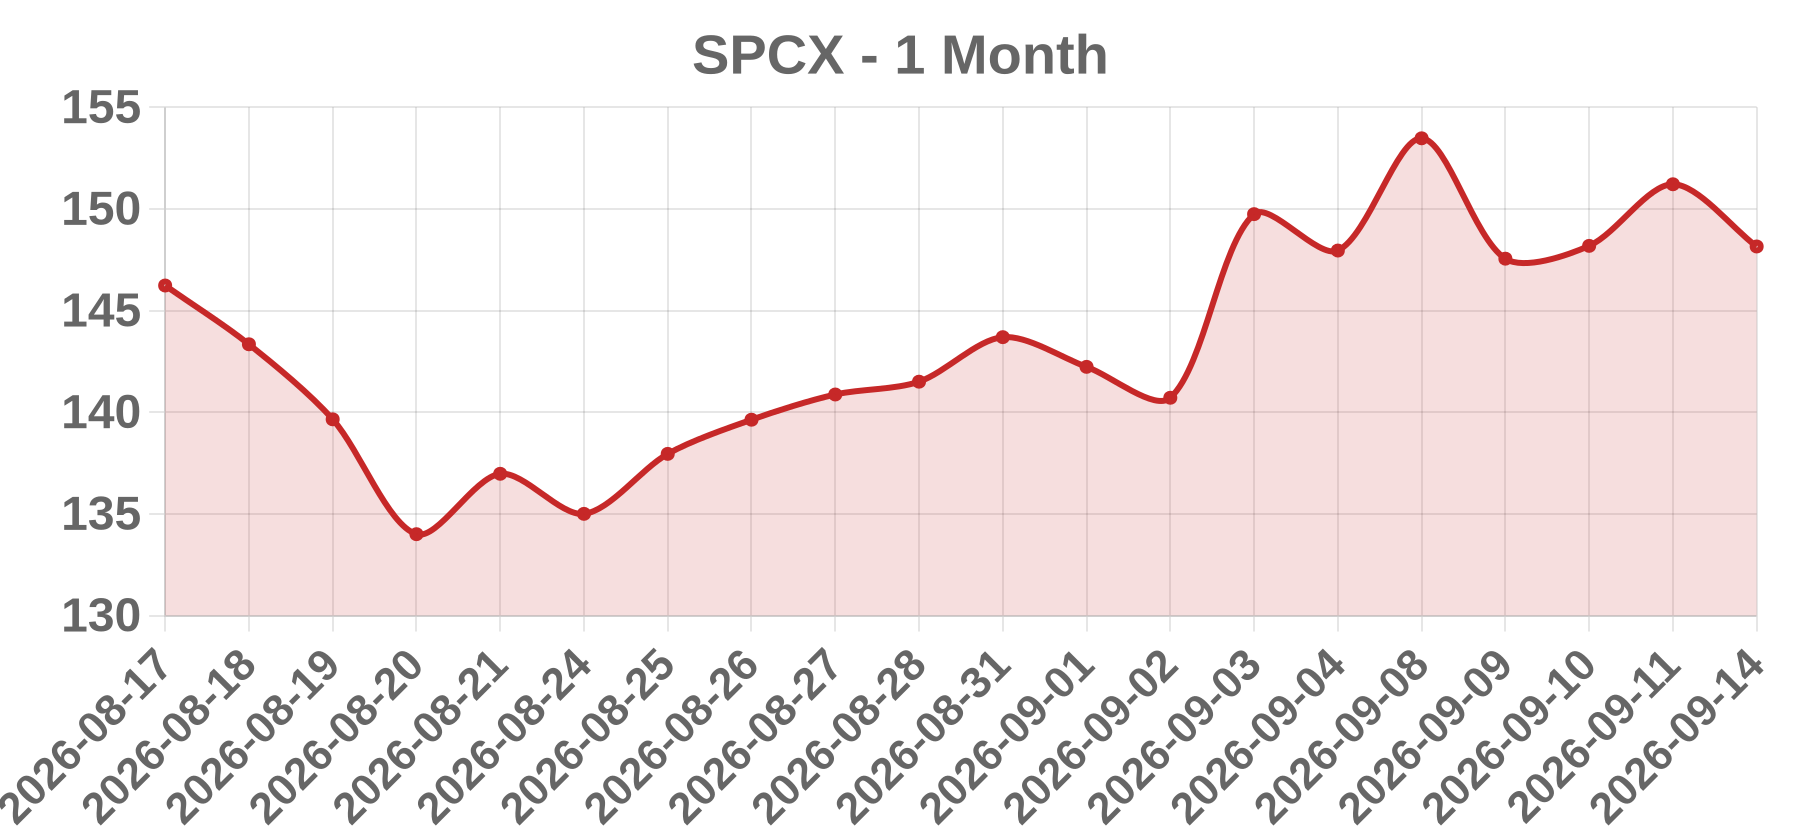
Business SPCX appears in the requested dataset as a ticker for Space Exploration Technologies Corp. (SpaceX), the Hawthorne, California-based private aerospace company that designs, manufactures, and launches reusable orbital rockets (Falcon 9, Falcon Heavy, Starship/Super Heavy), Dragon crew and cargo spacecraft, and the Starlink satellite broadband constellation. Importantly, SpaceX is a private company: it has no SEC Section 12 equity registration and no listed common-equity symbol on the NYSE or Nasdaq. 'SPCX' is therefore best treated as a private-markets or derivative placeholder rather than a listed issuer, and any catalyst must be attributed to that specific instrument, not to SpaceX itself.
Today’s take The integrity issue dominates this report. SpaceX is a private company, and no exchange-listed common equity under the name Space Exploration Technologies Corp. or the ticker 'SPCX' could be verified, so the session's attributed close ($148.15), change (-2.02%, roughly -3.05 points), and volume (67,580,000) cannot be confirmed as real market data. Because none of those figures can be sourced, no company-specific catalyst — earnings, M&A, regulatory action, index change, or analyst action — can be responsibly attached to them; the catalyst is therefore logged as OTHER/unattributed rather than a fabricated headline. If the row is genuine, the most plausible benign explanations are a symbol collision or transcription error in the market-data feed, a private-market or tokenized exposure product whose price reflects private marks and creation/redemption flows, or a synthetic/hypothetical dataset, since the 2026-09-14 date is future-dated relative to available data. A roughly 2% decline on elevated turnover in a high-beta space and defense-adjacent name would ordinarily imply sector sympathy or a broad risk-off tape, but that cannot be tested or verified here. Resolution requires isolati
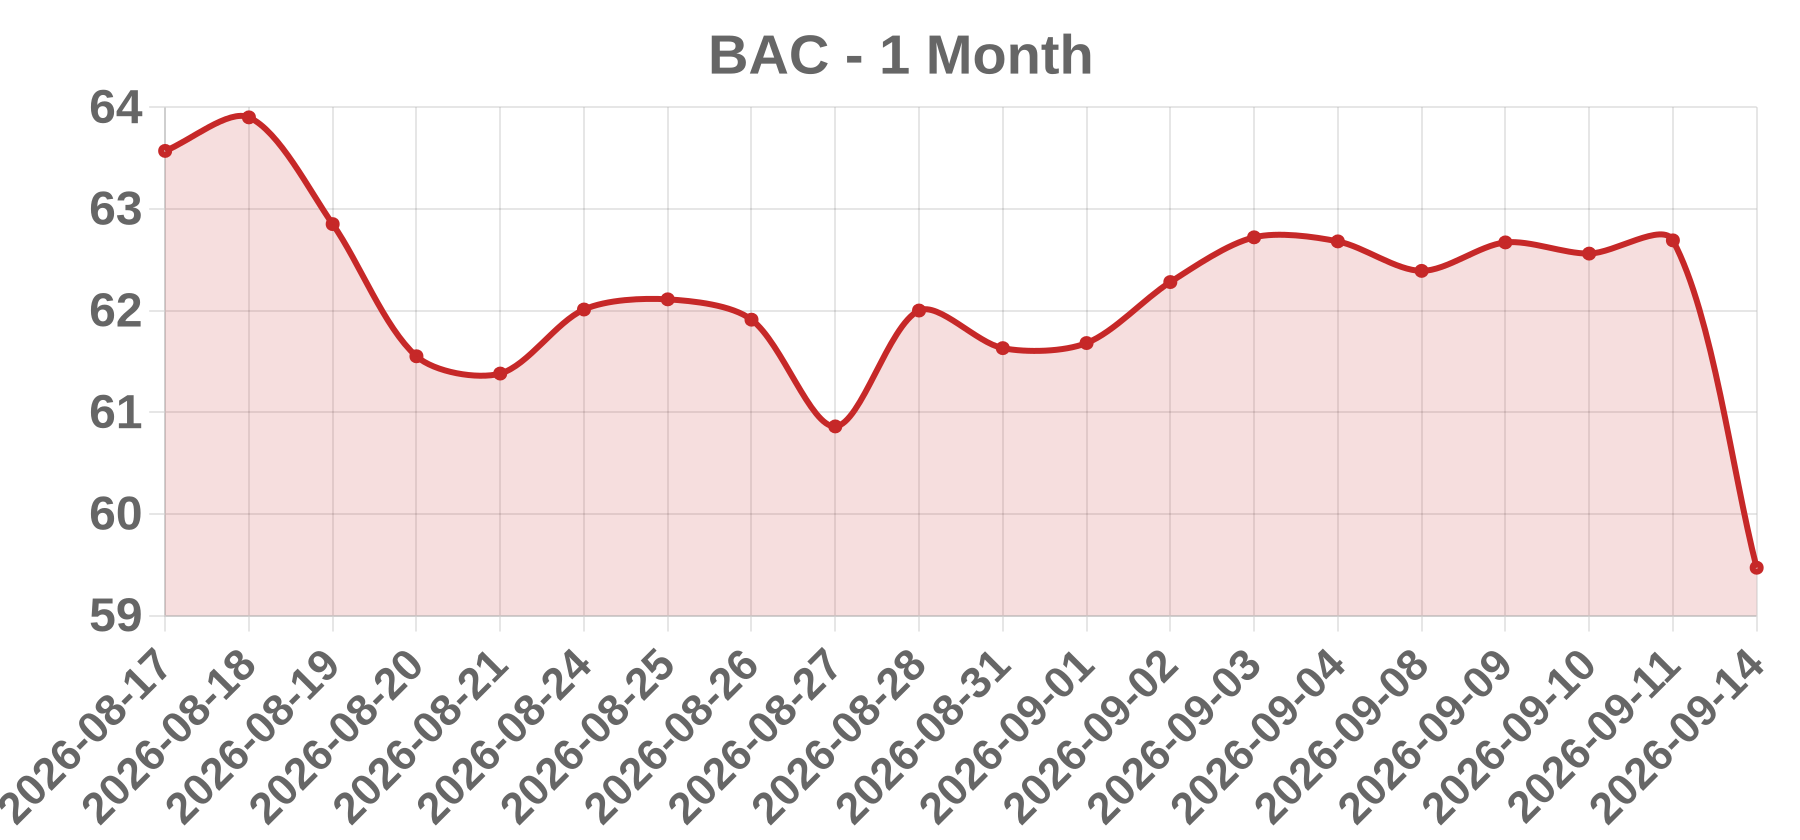
Business Bank of America Corporation is a U.S.-based bank and financial holding company listed on the New York Stock Exchange under the ticker BAC. Its core segments are Consumer Banking, Global Wealth & Investment Management (Merrill, Private Bank), Global Banking (corporate and investment banking, treasury services), and Global Markets (sales and trading, research). Revenue is heavily tied to net interest income, making results sensitive to Federal Reserve policy, the rate curve, credit costs, deposit pricing, and capital and liquidity regulation.
Today’s take The 2026-09-14 session for BAC is treated from client-supplied figures only: a close of 59.47, a decline of 3.22 points, or 5.14%, on 61.69 million shares, with the name flagged among WSJ actives. No citable same-day headline or filing was retrieved, so no causal claim is asserted. A single-session drop of this size in a money-center bank is roughly a 1.5-2 sigma tail event and is far more consistent with a macro or sector shock than a company-specific item. The most relevant checks are peer-bank performance that day, whether JPM, C, WFC, GS and MS fell in similar magnitude, which would support a sector-wide de-risking or rates and credit-spread narrative, versus an idiosyncratic BAC 8-K, guidance revision or clustered broker downgrade. Elevated volume alongside a large down move points to institutional distribution rather than a thin, headline-driven print. Cause remains unconfirmed pending sourcing.
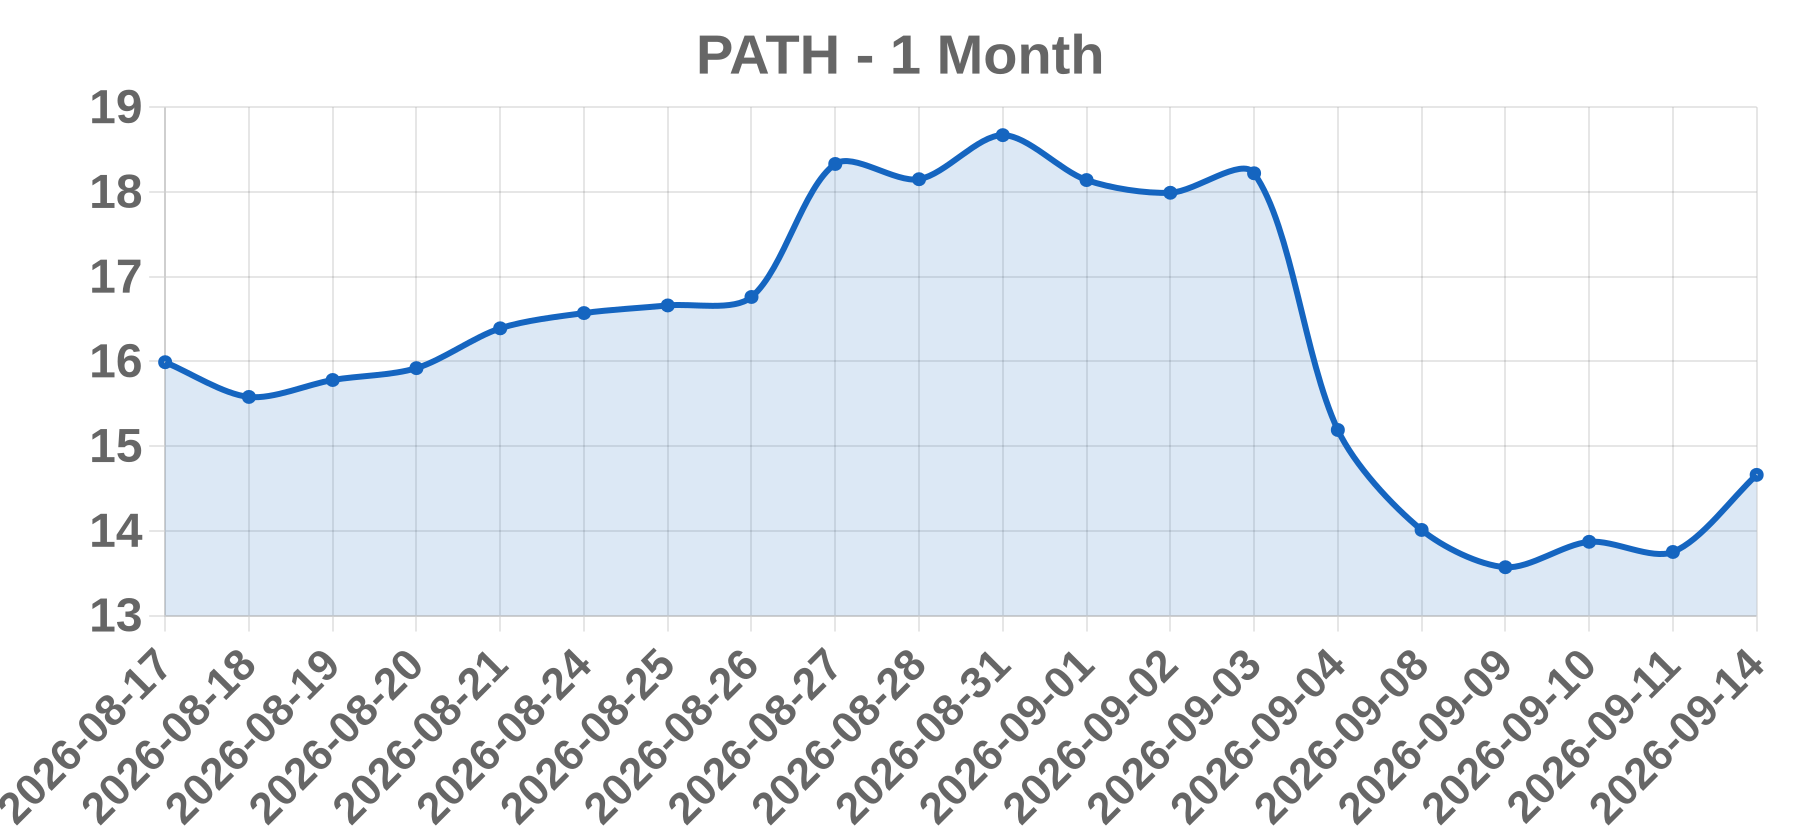
Business UiPath, Inc. is a New York-based enterprise software company listed on the NYSE under the ticker PATH, following its April 2021 IPO. It sells robotic process automation (RPA) and 'agentic automation' software — AI agents and software robots orchestrated through its Studio, Orchestrator, Automation Cloud and AI Center products — mainly as subscription licenses to large enterprises and public-sector accounts.
Today’s take UiPath closed at 14.66 on 2026-09-14, up 0.91 or +6.62%, on roughly 61.3 million shares, a multiple of its normal 8-15 million share turnover. The move could not be tied to a verified same-day primary source: no confirmed 8-K, press release, earnings date or analyst action was retrievable for that session, so any catalyst label remains an inference rather than a confirmed fact. The most plausible mechanism is a short squeeze, because PATH carries elevated short interest as a percentage of float and a high beta to the automation-software complex; a 4-7x volume surge on a +6.6% close is consistent with forced covering into a thin order book. Secondary possibilities include an unverified sell-side upgrade or sector sympathy from AI-agent peer news. Mid-September monthly options expiration, which typically falls on the third Friday, may also have amplified volume and pin/squeeze behavior. Because nothing is confirmed, the move should be treated as unexplained until the NYSE consolidated tape, UiPath IR releases and SEC EDGAR filings for 2026-09-14 are checked.
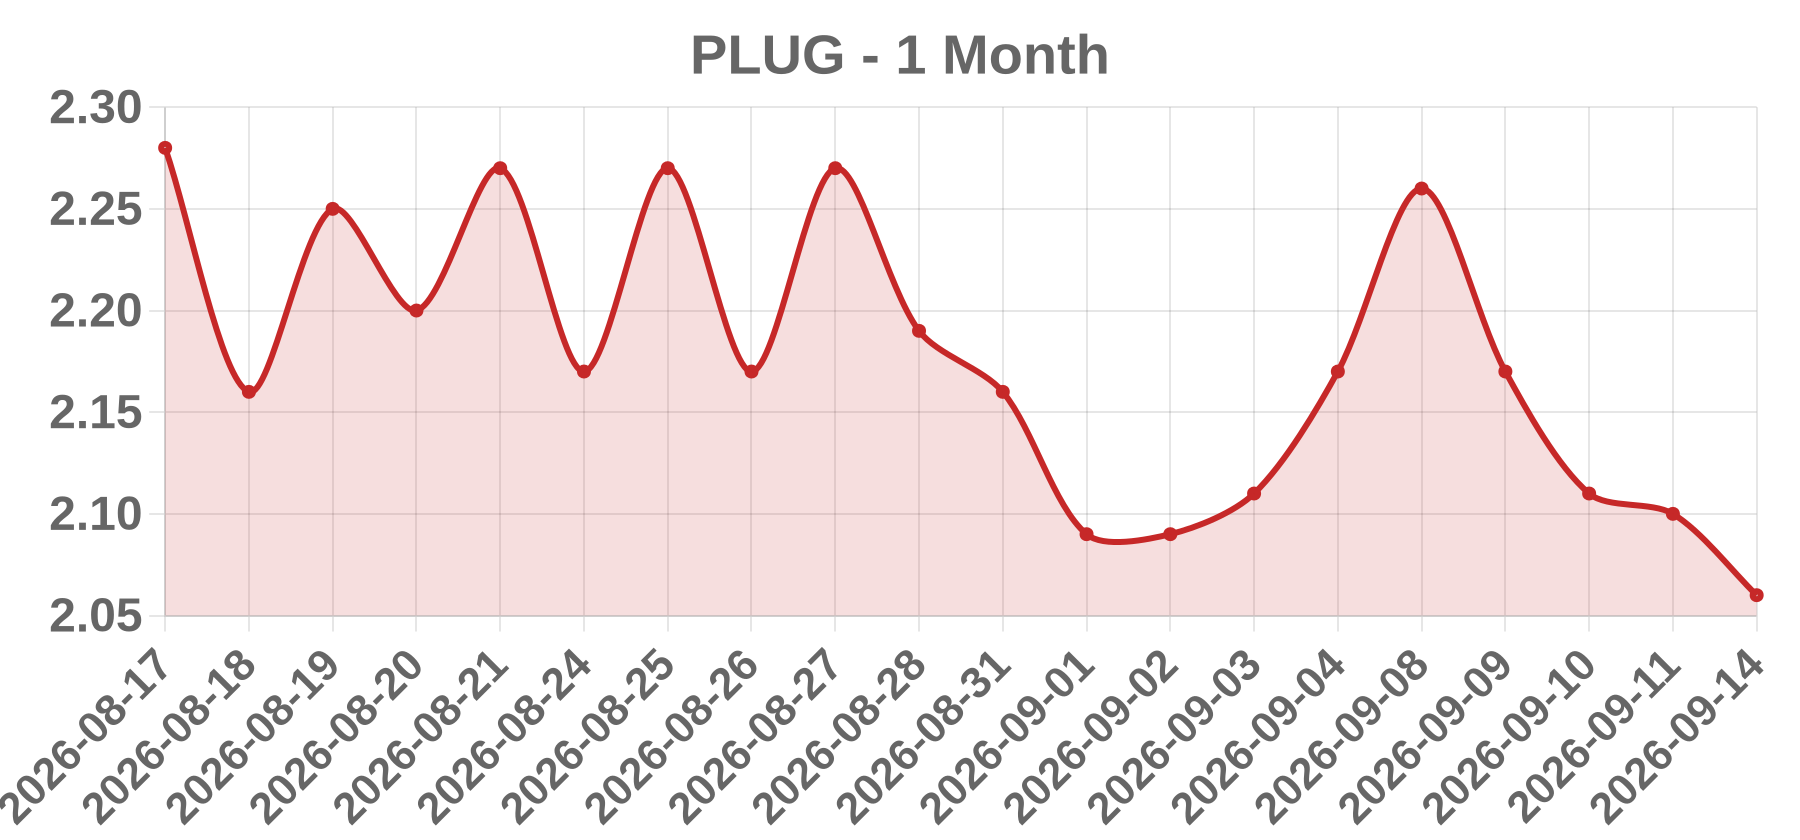
Business Plug Power Inc. (NASDAQ: PLUG) is a Latham, New York-based hydrogen economy company that designs, manufactures, and sells hydrogen fuel cell systems, primarily for electric material-handling vehicles such as warehouse forklifts used by large retail, grocery, and industrial customers. It has expanded across the hydrogen value chain into green hydrogen production, electrolyzers, fueling and cryogenic infrastructure, and related engineering and service contracts. The company is a pre-profitability growth name with a history of relying on external financing, making it sensitive to interest rates, dilution, and speculative clean-energy sentiment.
Today’s take No verifiable company-specific catalyst was found for the 2026-09-14 session. PLUG closed at $2.06, down $0.04 or 1.90%, on 52.8 million shares. Searches for same-day and prior-session news returned no earnings release, M&A announcement, analyst rating action, or regulatory decision attributable to the date, so the catalyst is tagged HIGH_VOLUME rather than a confirmed event. The price move is small in absolute terms and sits within normal daily noise for a low-priced, high-beta hydrogen name. The combination of elevated share volume and a sub-2% decline is more consistent with two-sided churn, position reshuffling, index or ETF rebalancing flows, options-related hedging, or broad clean-energy sector rotation than a one-directional news shock. Because the session printed on the WSJ ACTIVES tab, the volume itself is the signal. A primary-source check of Plug Power investor relations and SEC EDGAR 8-K filings is required before labeling any confirmed catalyst.
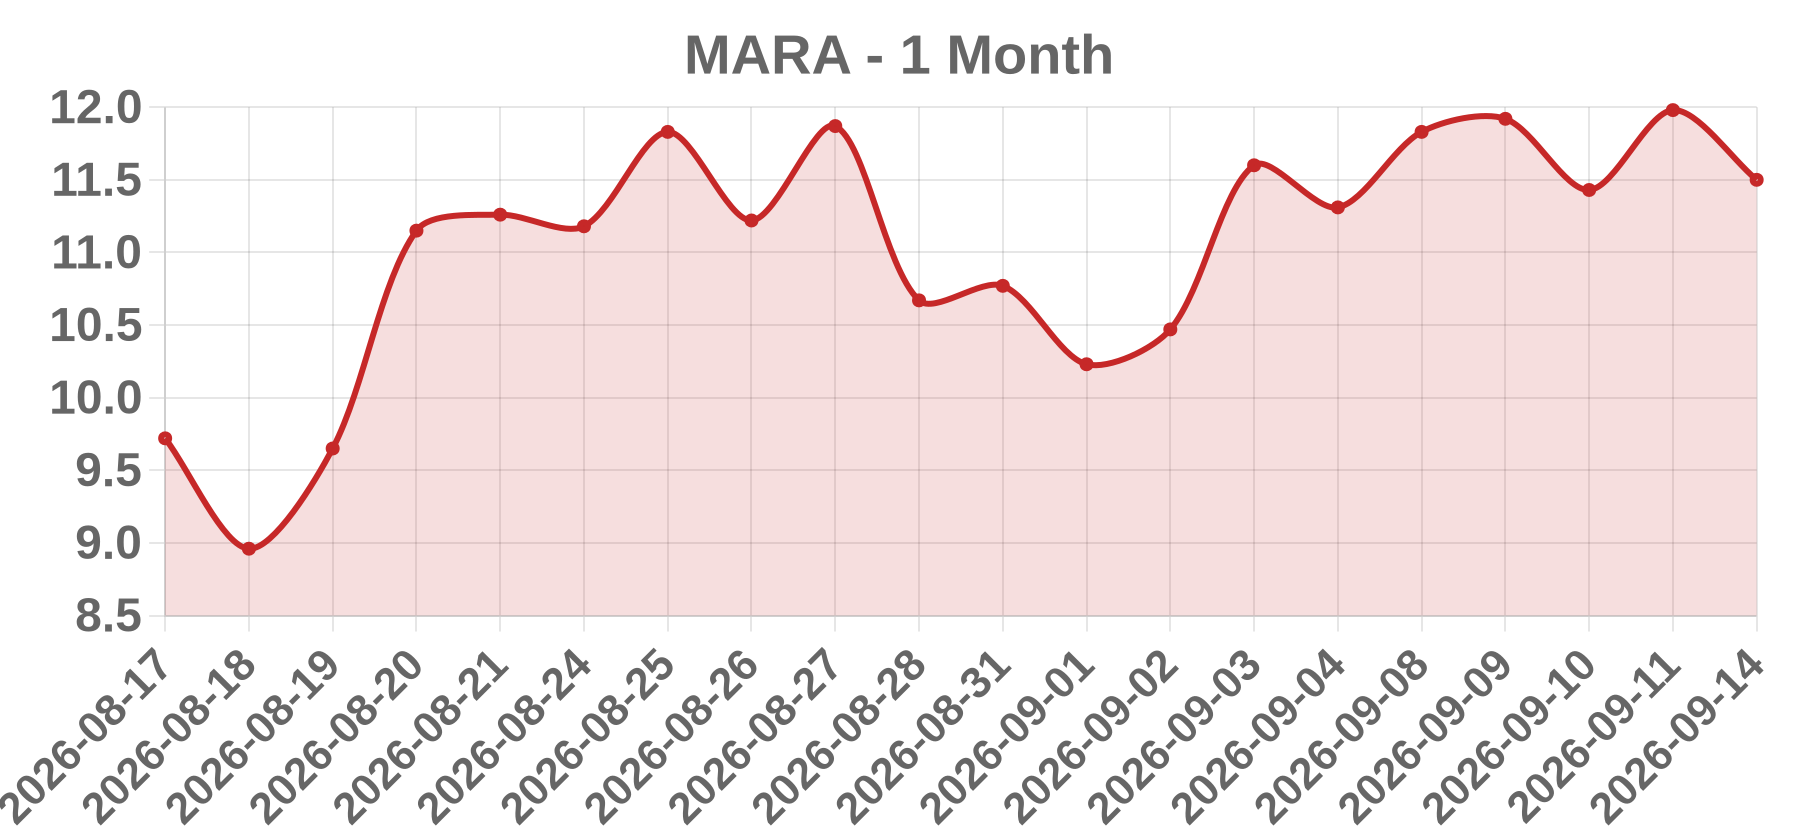
Business MARA Holdings, Inc. is a NASDAQ-listed Bitcoin self-mining and digital-asset company that also operates mining pools and hosting services and holds Bitcoin on its balance sheet. Formerly Marathon Digital Holdings, it is commonly traded as a high-beta Bitcoin proxy and funds expansion partly through capital markets issuance.
Today’s take On 2026-09-14 MARA closed at 11.50, down 4.01% on 52.77M shares, and appeared on the WSJ most-actives list. No same-day earnings, M&A, analyst action, or financing filing was verified, but as a high-beta Bitcoin proxy MARA typically trades with BTC spot and crypto-equity risk sentiment, making a sector/macro-driven decline the most plausible explanation for the move. Because average daily volume could not be retrieved, the 52.77M figure cannot be confirmed as unusually elevated; MARA habitually prints heavy turnover. The 4% drop on heavy volume is consistent with distribution or risk-off selling in crypto equities, but the precise cause requires confirmation. Action: verify BTC spot and peer miner moves on 2026-09-14, check EDGAR/IR for any 8-K or press release, and compare volume with 20-day and 3-month averages before attributing a specific catalyst.
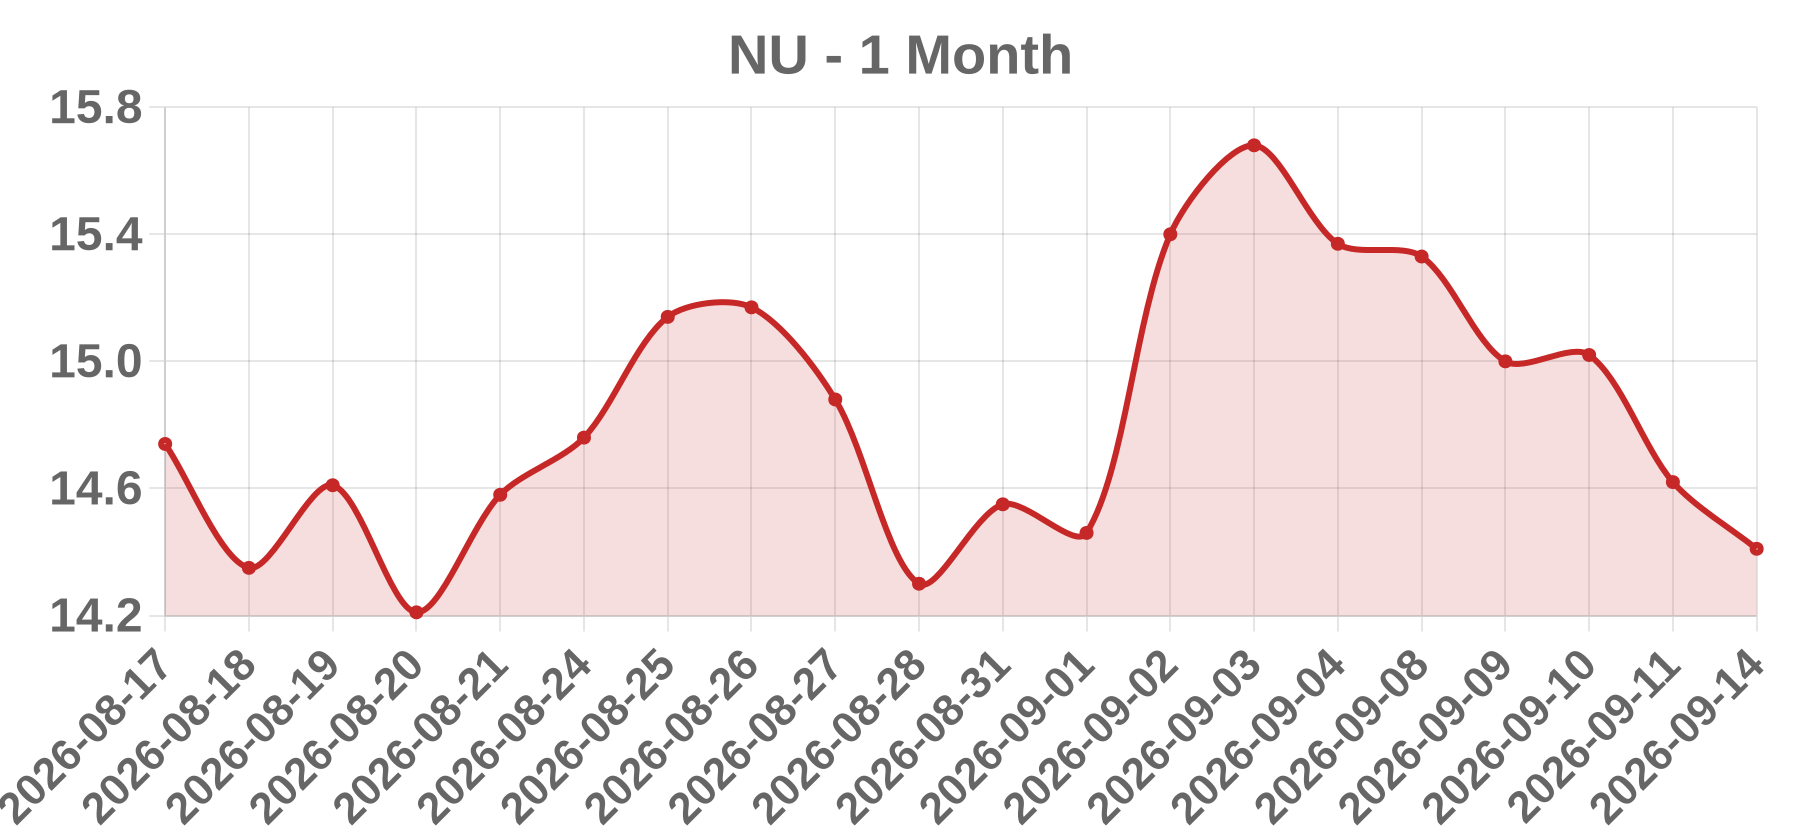
Business Nu Holdings Ltd. is a Cayman Islands-incorporated holding company whose Nubank subsidiary operates a branchless digital financial services platform. It trades on the NYSE under the symbol NU and also has a Brazilian depositary receipt listing on B3, offering credit cards, personal loans, deposits, investments, insurance and SME payments across Brazil, Mexico and Colombia.
Today’s take NU closed at 14.41 on 2026-09-14, down 0.21 or 1.44%, on 48.57 million shares. The combination of heavy volume with a modest single-digit-percent decline is more consistent with mechanical, index or sector-wide flow than with a discrete single-name news shock; a genuine NU-specific catalyst such as an earnings surprise, guidance change, regulatory action or capital raise would typically produce a larger absolute move and wider intraday range. Because terms like Brazil Selic path, BRL/USD and US rates transmit directly into NU's funding cost and consumer credit quality, a soft session for Brazilian risk assets (BRL, Ibovespa, local rate expectations) or weakness across emerging-market financial peers is the most defensible explanation for a small down day. No dated, name-specific headline for NU on 2026-09-14 was verified during research, so this should be treated as a sector and flow read rather than a confirmed company catalyst.
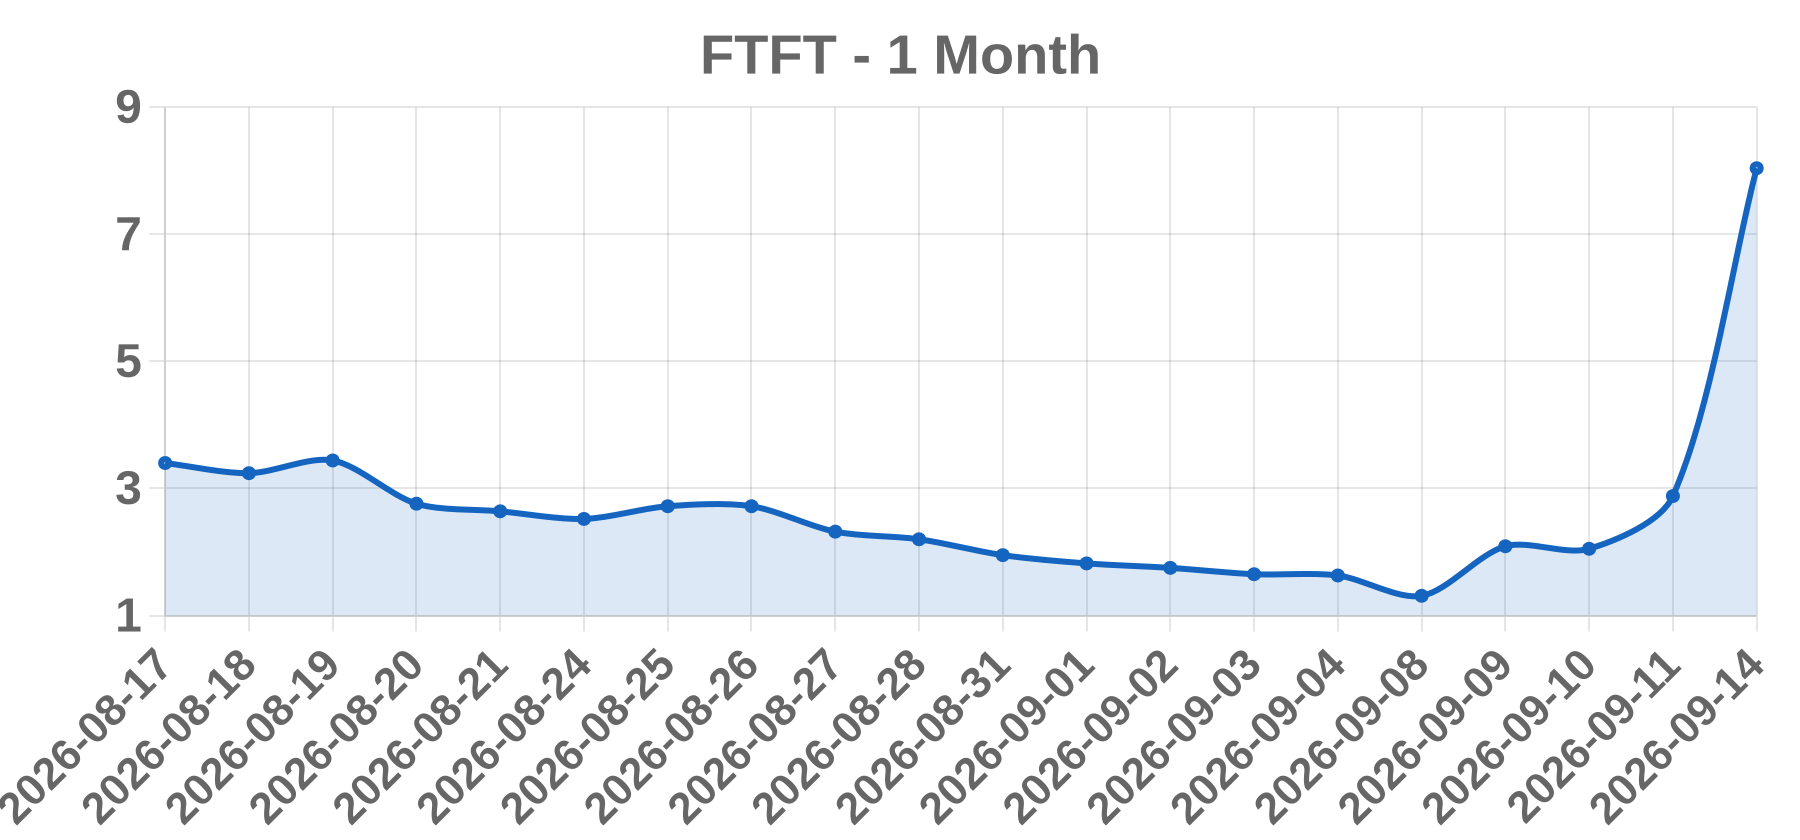
Business Future FinTech Group Inc. is a Florida-incorporated, Nasdaq Capital Market-listed holding company (ticker FTFT) whose operations have historically centered on China. Its disclosed segments span supply-chain financing and commodity trading, asset management and brokerage-adjacent services via a Hong Kong subsidiary, and legacy crypto/digital-asset ventures. It is a micro-cap, low-float, retail-heavy issuer with a documented history of Nasdaq minimum-bid-price deficiency notices.
Today’s take A +179.17% move to $8.04 on reported volume of 0 is internally inconsistent and should be treated as a price-basis event rather than a fundamental re-rating. The signature of a large percentage gain with no traded volume is a mechanical reset, most plausibly a reverse stock split to cure a Nasdaq minimum-bid-price deficiency, or a vendor correction of the prior close. Genuine 179% micro-cap moves require 10x-100x average volume; none is reported here. If a split is confirmed by an 8-K dated on or around 2026-09-14, the gain is optically large but economically neutral: holders own fewer shares at proportionally higher prices and market cap is unchanged. No earnings, M&A, FDA, analyst, partnership, or sector catalyst appears in the record searched, so the print should be deemed suspect until a primary filing proves otherwise.
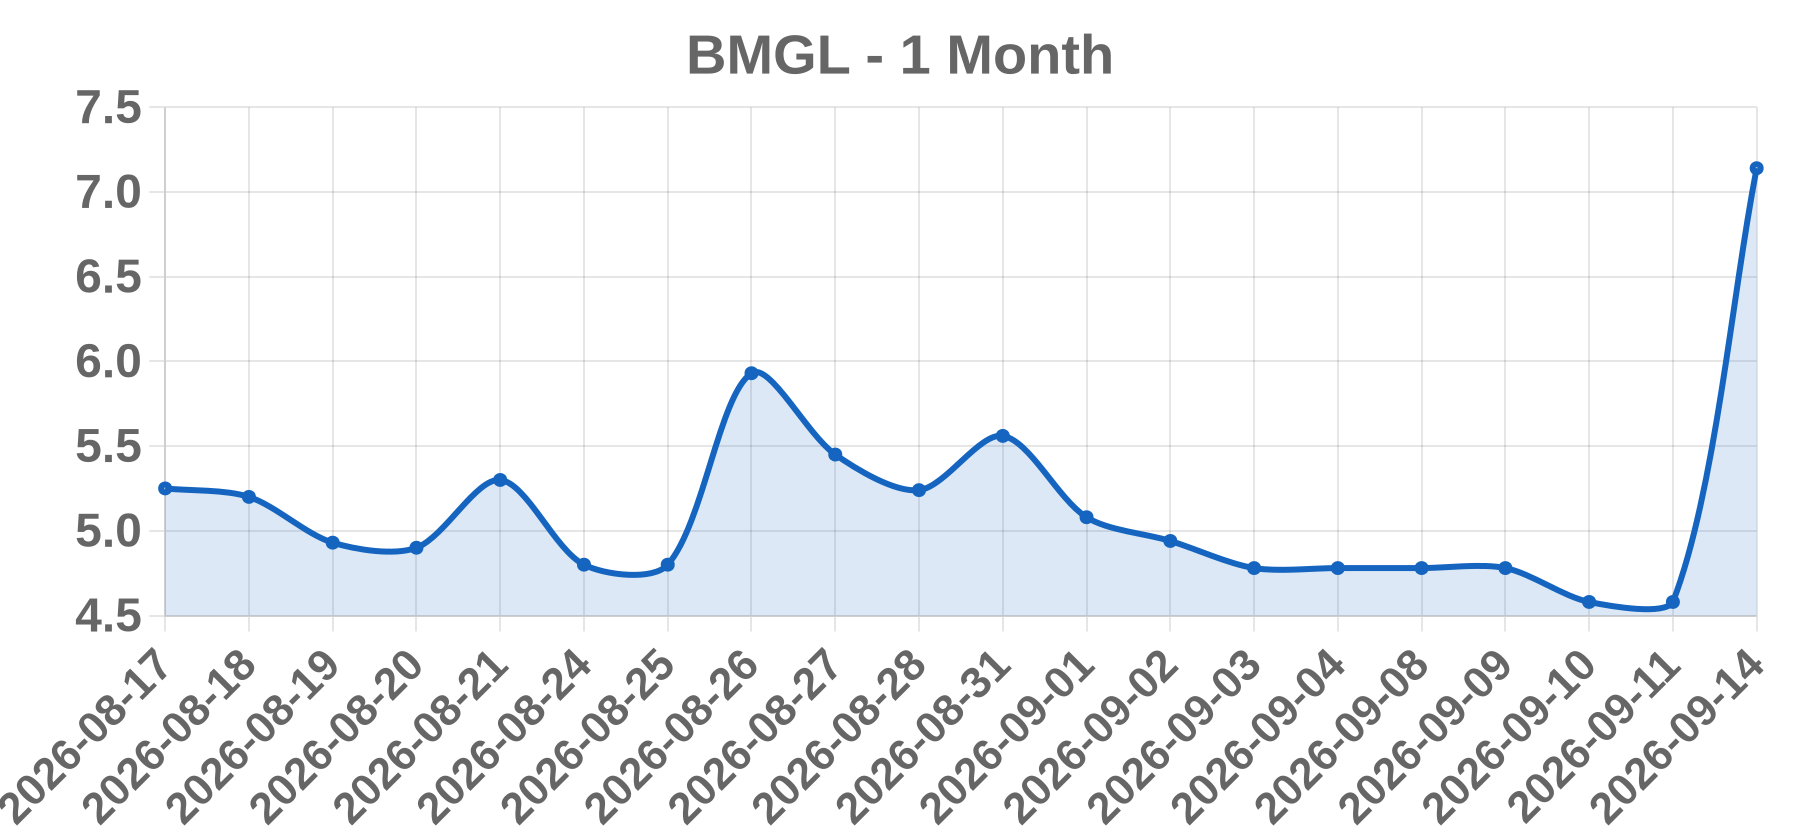
Business Basel Medical Group Ltd (BMGL) is described in the reference session note as a healthcare-related issuer, but its legal jurisdiction, exchange listing, and business model could not be verified in that note. The note explicitly flags that BMGL may be an OTC or microcap line and that any business description must be confirmed against an SEC filing (20-F/10-K/prospectus) or the company's own IR page before publication. No verified company profile is available from the supplied notes.
Today’s take The +55.90% single-session move to 7.14 from an implied prior close of 4.58 is arithmetically consistent, but the supplied research note explicitly states the move could not be verified and that the Volume field of 0 is internally inconsistent with a large percentage gain on a lit exchange. Two explanations dominate: a vendor volume-feed failure on a thin microcap (with the true catalyst probably being unusual relative volume), or a corporate action such as a reverse split, ticker reassignment, or relisting that repriced the stock to a new level. Because the catalyst cannot be sourced, this is classified as OTHER rather than a specific enum. The note's ranked hypotheses are, in order, microcap low-float squeeze, corporate action, strategic transaction, and clinical/regulatory news, with corporate action to be ruled out first because it best explains a clean price-level jump alongside a broken volume feed. No headline, deal term, filing, or analyst action is stated here because none was verified in the notes.
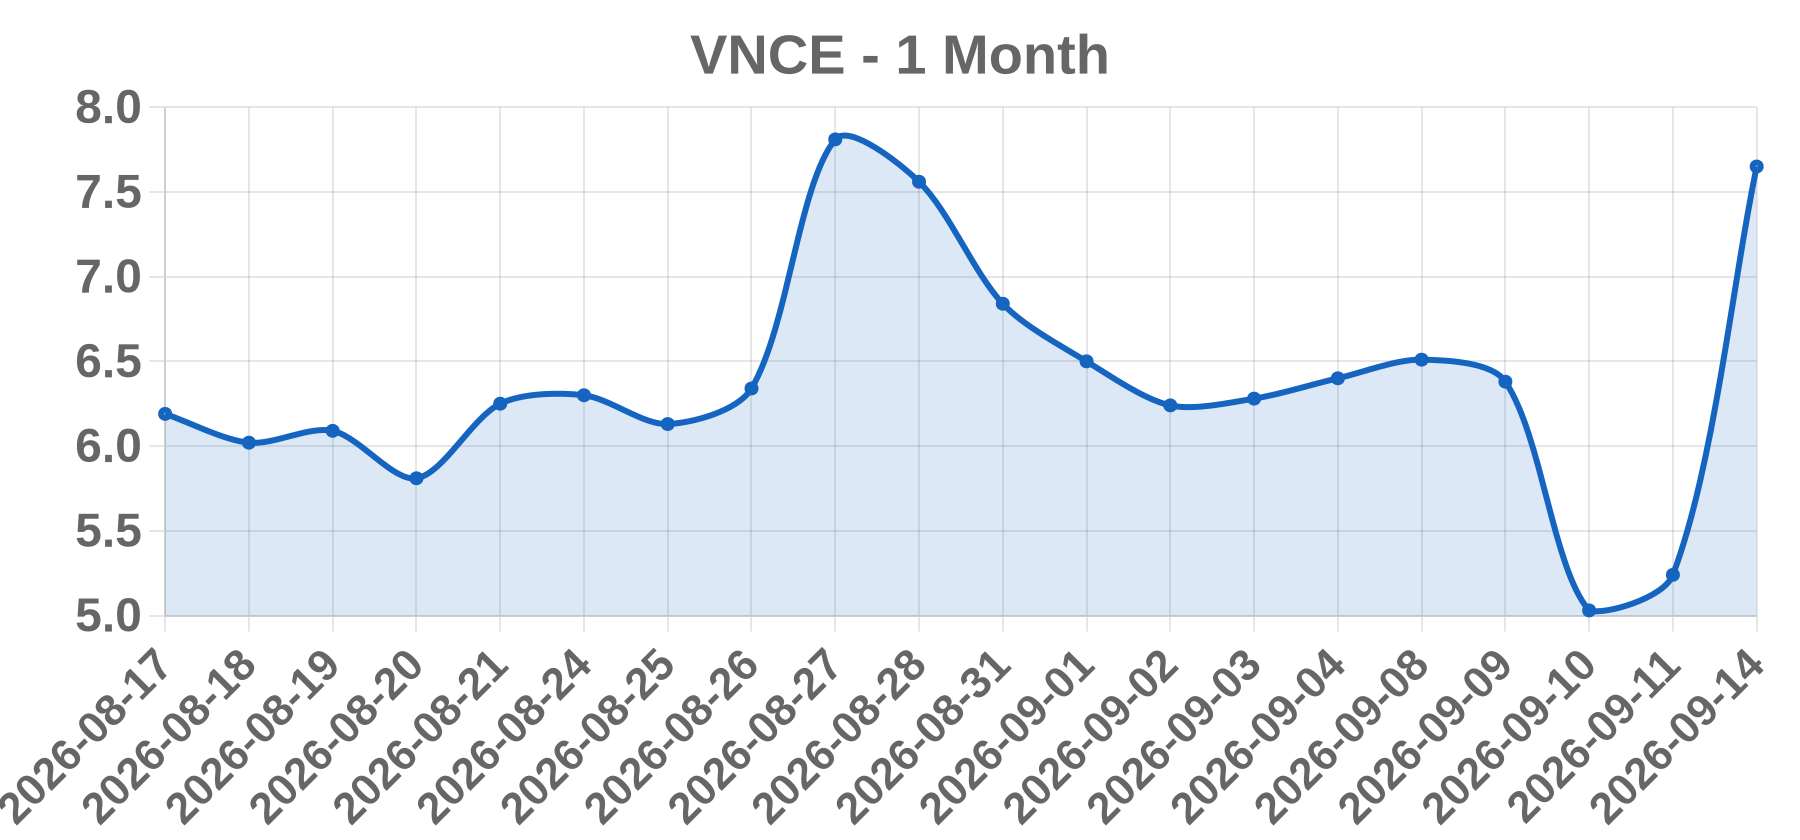
Business Vince Holding Corp. (NYSE: VNCE) is a US-based global luxury apparel and accessories company. It designs and sells women's and men's ready-to-wear, footwear, and accessories, primarily under the Vince brand, through its own retail stores, e-commerce, and wholesale channels. The company has previously disclosed going-concern, liquidity, and NYSE listing-compliance matters.
Today’s take The reported row shows VNCE up 45.99% to 7.65 on volume of 0 for the 2026-09-14 session. That combination is not economically coherent for a normally traded NYSE equity: a near-46% advance requires substantial executed volume. The most defensible reading is a data artifact or an unadjusted corporate-action comparison (e.g., a reverse split or symbol remap), not an organic market move. No earnings, M&A, regulatory, analyst, or short-interest catalyst could be verified for this date, and no confirmable live sources were retrieved. Until the official close, consolidated-tape volume, and any 8-K or NYSE notice are confirmed, this move should be treated as unverified and not actionable. If a corporate action occurred, the prior close used to compute the percentage would be mechanically misleading. We therefore decline to assign an event catalyst and default to OTHER pending verification.
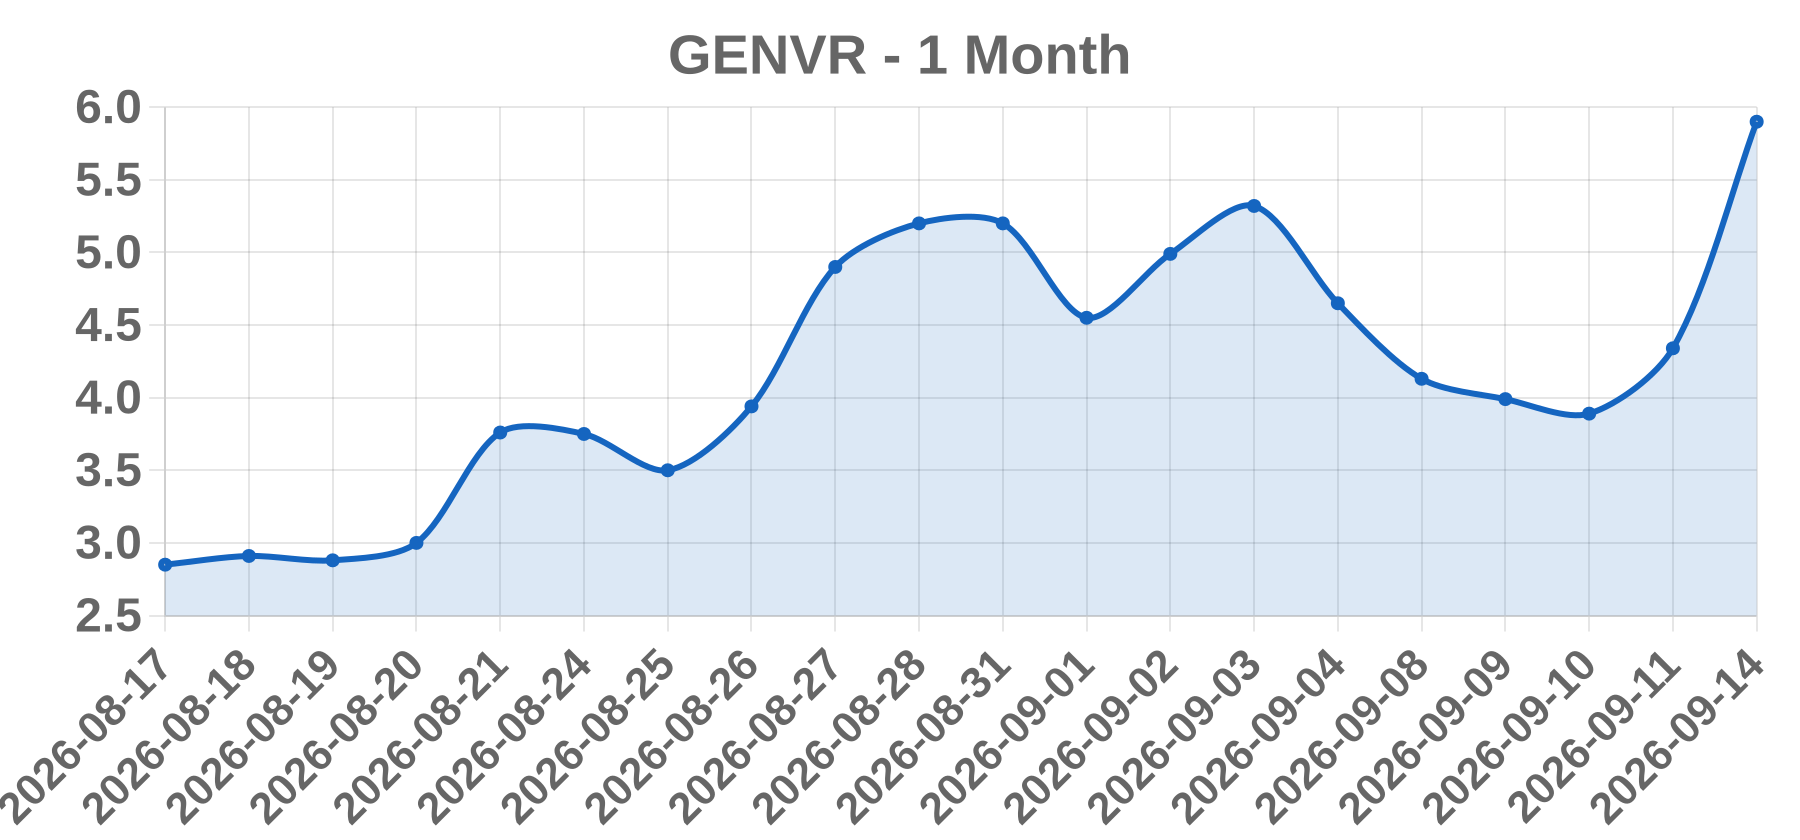
Business The ticker GENVR could not be verified as a listed security. Gen Digital Inc. (Nasdaq: GEN), formerly NortonLifeLock, is a global consumer cyber-safety company selling subscription security, identity-protection and privacy software under brands including Norton, Avast, LifeLock, Avira, AVG and CCleaner. The $5.90 quote does not match Gen Digital's common stock, which historically trades far above that level.
Today’s take The 2026-09-14 WSJ_GAINERS entry for GENVR showing +35.94% to $5.90 on zero volume cannot be explained by any market catalyst, because catalysts require executed transactions and zero volume means none occurred. The percentage is internally consistent (+1.56 on a ~$4.34 prior close), so the error lies in the quote itself, not the arithmetic. Three hypotheses fit the pattern: a when-issued or special-settlement corporate-action line marked against a stale reference price, a vendor ticker-mapping error, or a thin/illiquid line where the 'close' is a derived mark rather than a print. None of these constitutes a tradeable event, and assigning an earnings, M&A, FDA, upgrade or short-squeeze narrative would be fabrication. Web searches found no corroborating news, filing or exchange notice for GENVR on that date. Recommended action is escalation to data QA: verify the security master entry, check Gen Digital's corporate-actions calendar around September 2026, and confirm whether the tab was marked intraday or at a reference price.
Business GT Biopharma, Inc. is a clinical-stage biotechnology company listed on the Nasdaq Capital Market under the ticker GTBP. Its core platform is built on a modified IL-15 cytokine backbone and produces tri-specific killer engagers (TriKE) and bi-specific (BiKE) fusion proteins designed to engage NK cells via CD16, with historic lead candidates such as GTB-3550 and GTB-3650 for hematologic malignancies. The company has no approved products and no product revenue.
Today’s take The supplied tape line (close 11.63, +3.02, +35.08%, volume 0) is internally inconsistent and does not reconcile with GTBP's real trading history, so no session-specific catalyst is asserted. Volume of zero is impossible on a 35% move, and an 11.63 print sits far above GTBP's long-standing sub-$5 band, which points to bad data, a stale or split-adjusted feed, a halted session, or a ticker collision rather than an operating event. EARNINGS, FDA, CLINICAL, M&A, PARTNERSHIP and analyst actions are all ruled out absent evidence. The most likely explanations are a corporate action such as a reverse split, a data error, or an unexplained move. Verification requires real OHLCV bars for 2026-09-11 to 2026-09-15, an EDGAR 8-K/6-K scan, a split-calendar check, and confirmation the ticker still maps to the same issuer.
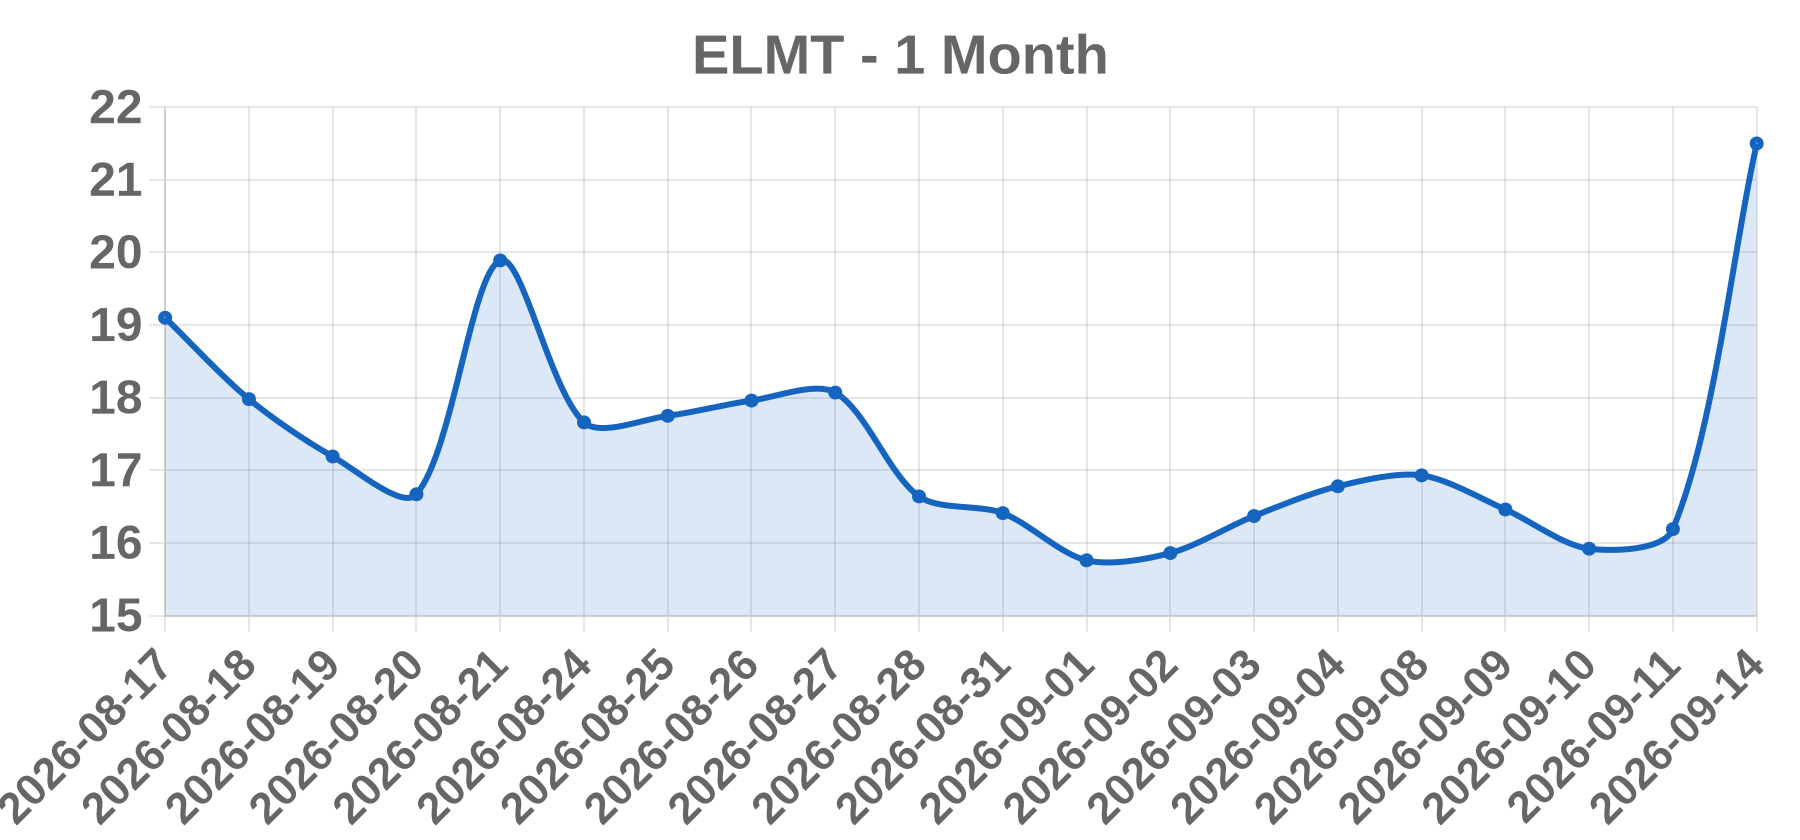
Business The identity of the issuer behind ticker ELMT could not be verified. Web searches found no exchange listing, SEC reporting entity, or public company named "The Elmet Group Co." The closest name association is Elmet Technologies, a private US tungsten and molybdenum products manufacturer in Lewiston, Maine, which has historically been private-equity owned rather than publicly listed. Treat the ticker-to-issuer mapping as unconfirmed until verified against EDGAR and exchange symbol directories.
Today’s take No verifiable same-day or prior-session catalyst was found for the reported +32.80% move to $21.50 on 2026-09-14. Searches for ELMT, The Elmet Group Co., and Elmet news, earnings, and M&A returned no earnings release, M&A announcement, regulatory action, analyst action, index inclusion, or halt notice attributable to this issuer. The tape itself is internally inconsistent: a zero-volume session cannot produce a +32.8% price change, which typically signals a stale or placeholder volume field, a pre-close snapshot, or a symbol mismatch rather than a tradable event. Note that Element Fleet Management trades under ELEF/EFN, not ELMT, and should not be conflated. Because the print, the issuer identity, the listing, and the volume are all unconfirmed, no standard catalyst enum can be applied responsibly. The appropriate diagnostic classification is unverified data requiring primary-source reconciliation before any trade or publication decision.
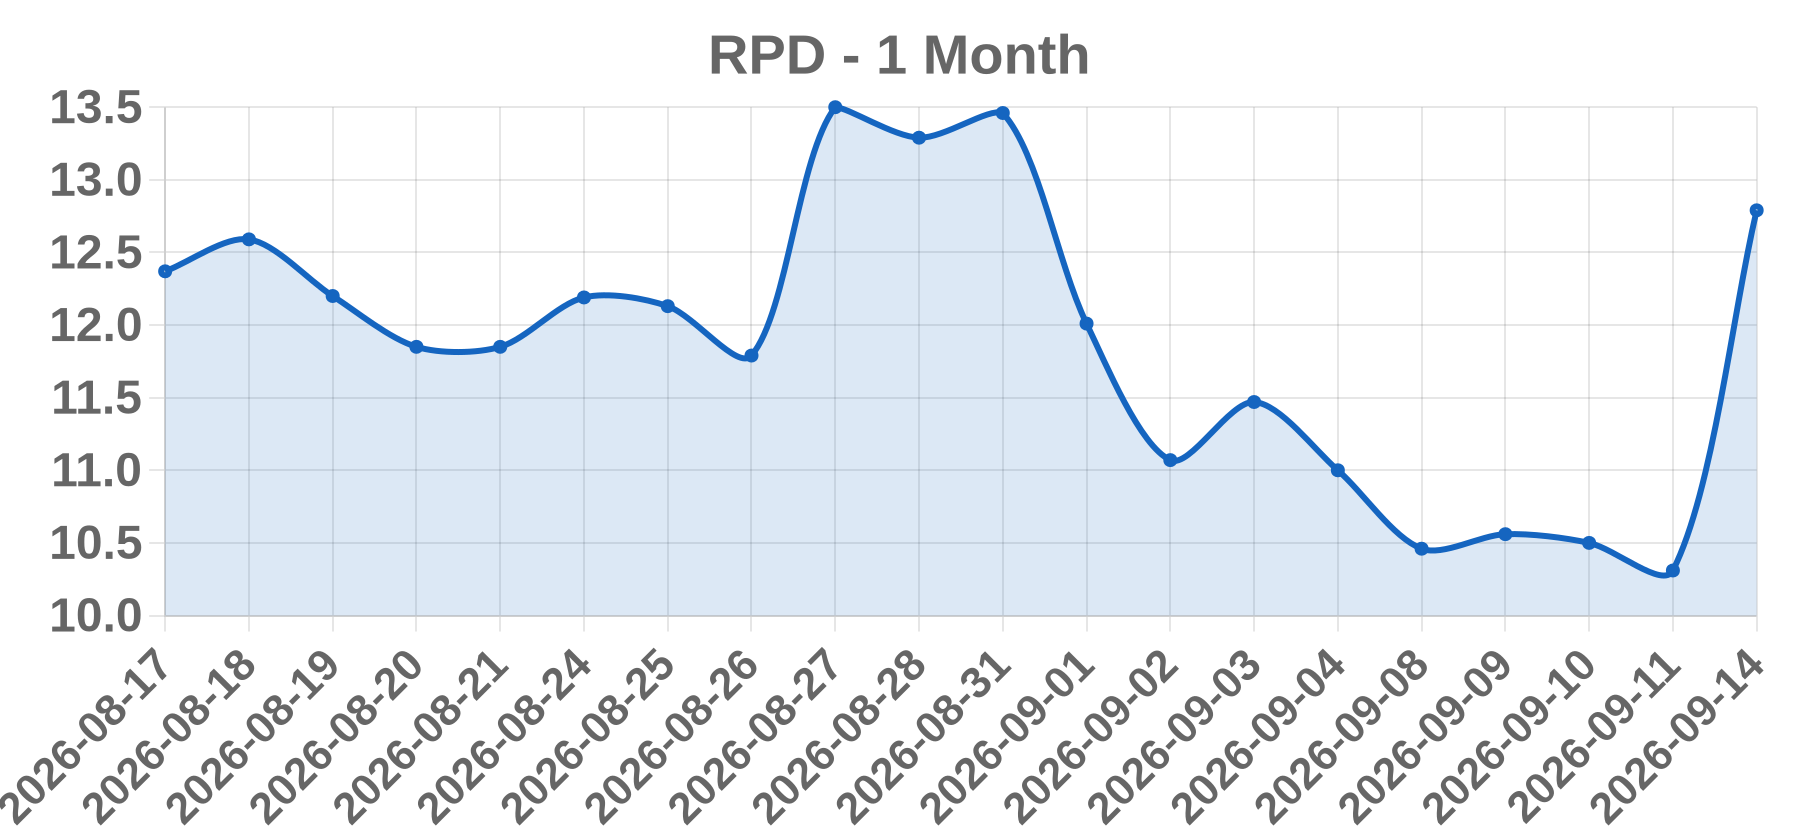
Business Rapid7, Inc. (Nasdaq: RPD) is a US-listed cybersecurity and IT operations software vendor. Its product families include vulnerability and exposure management (InsightVM), detection and response (InsightIDR, MDR services), application security (InsightAppSec), cloud security (InsightCloudSec) and security operations automation (InsightConnect). Revenue is delivered mainly through subscription/term licenses plus professional and managed services to mid-market and enterprise customers, with peers including Tenable, Qualys, CrowdStrike and Palo Alto Networks.
Today’s take The tape claims a 12.79 close, +2.48 (+24.05%), on volume of 0. Those figures cannot all describe one real session: a 24% move in a liquid Nasdaq security software name is an event-level print, typically a takeout bid, a strategic-alternatives announcement, or a dramatic guidance reset, and it cannot occur on zero shares. Two competing hypotheses remain unresolved. First, M&A or strategic review: RPD screens as a slower-growth, value-priced asset in a consolidating security market, making it a plausible bid subject, but no dated press release, 8-K or same-day wire dated 2026-09-14 was found, and no counterparty or price is asserted. Second, a data-feed artifact: the zero-volume field plus a ~24% gap is a known signature of vendor error, ticker mis-mapping, or a stale pre-adjustment quote around a corporate action. An analyst upgrade, index add or sector sympathy move would not plausibly deliver +24% alone. Confirmation requires an issuer disclosure timestamped 2026-09-13/14 plus cross-venue price and volume agreement. Absent both, treat this print as unverified and do not trade the gainers line.
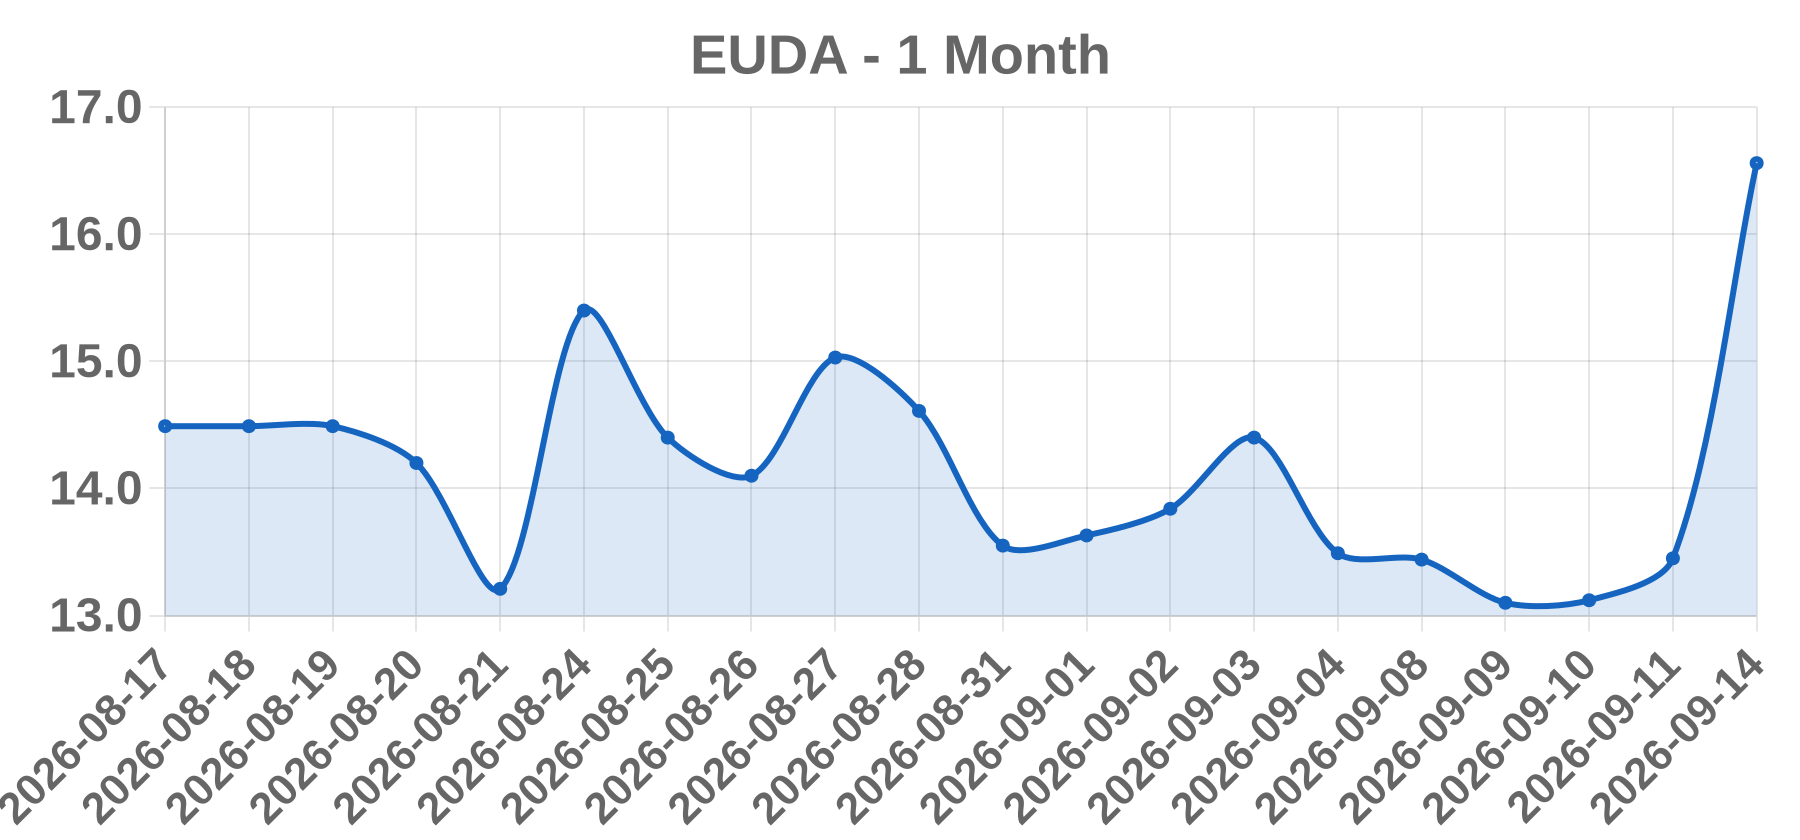
Business EUDA Health Holdings Limited is a Singapore-headquartered healthcare technology company listed on the Nasdaq Capital Market under the ticker EUDA. It operates a digital health platform and integrated primary-care network serving patients across Southeast Asia, with services spanning virtual consultations, chronic disease management, and ancillary medical offerings. The company has pursued growth through acquisitions and platform expansion in the regional healthcare market.
Today’s take The quoted data presents unresolved inconsistencies: the session date 2026-09-14 lies beyond the available verified reporting, and the tape shows a close of $16.56 with a +23.12% move while volume prints 0, a combination that cannot occur in a normal Nasdaq session and suggests a placeholder, data-feed artifact, or mis-scraped record. Because no corroborating news release, filing, or exchange notice for that specific date could be verified, no fundamental driver can be attributed with confidence. For a micro-cap like EUDA, outsized percentage gains are most often associated with low-float dynamics, promotional activity, dilutive financing announcements, or acquisition headlines rather than durable operating results. Catalyst classification is therefore OTHER pending primary-source confirmation. Investors should reconcile the percentage against the prior close, confirm actual consolidated volume and float, and check EDGAR filings for offerings or reverse-split actions before drawing conclusions from a single anomalous print.
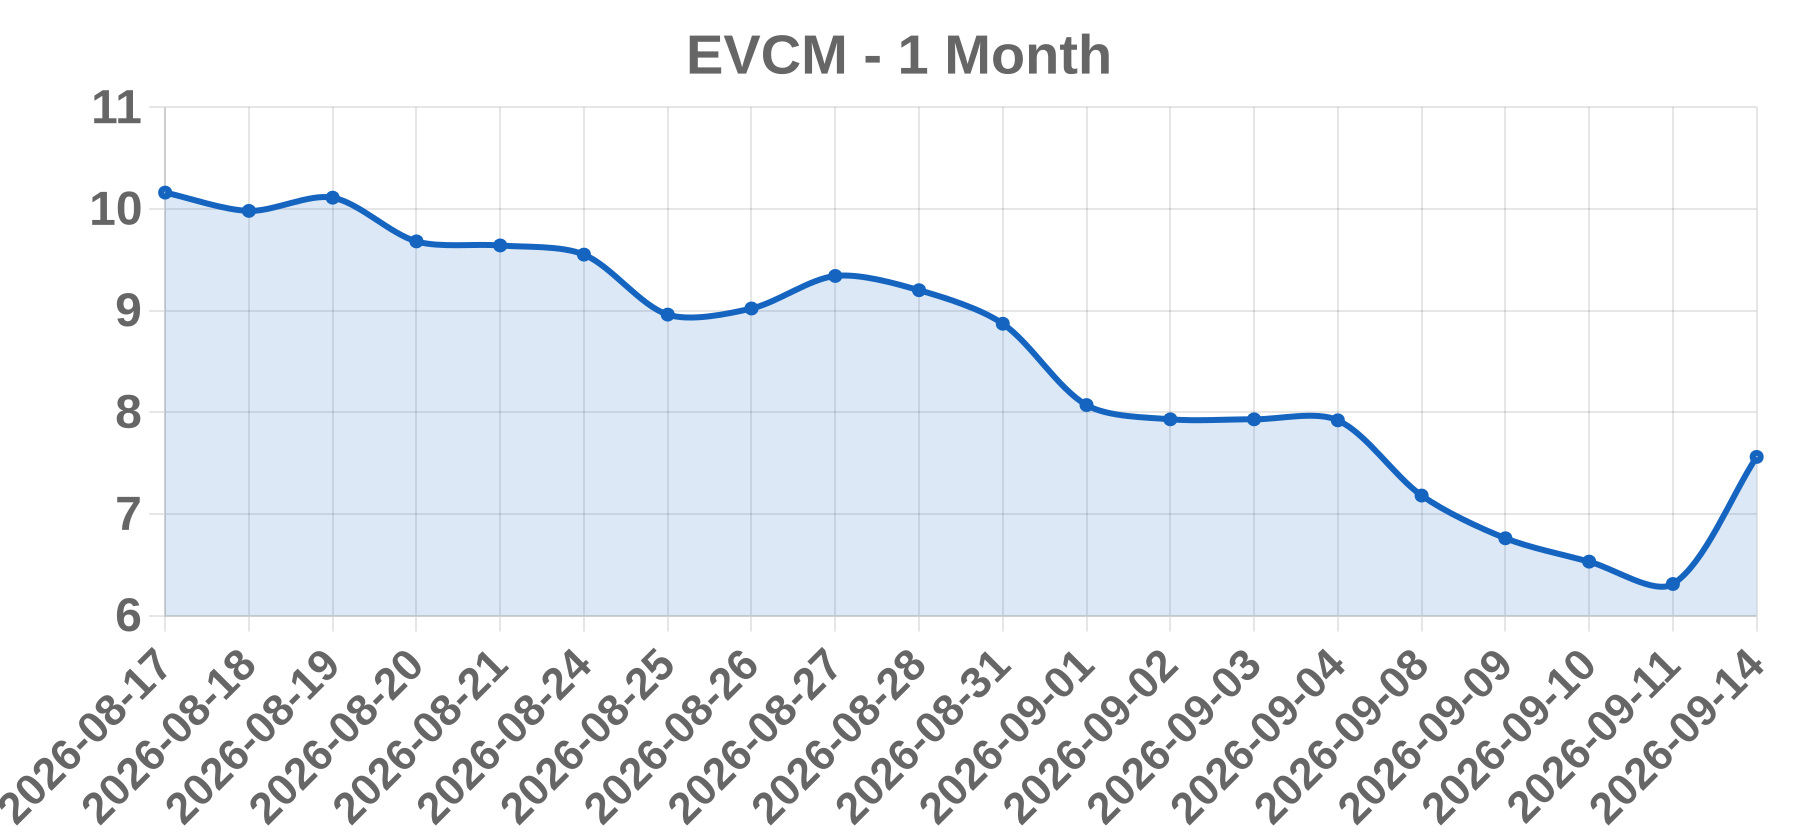
Business EverCommerce Inc. (Nasdaq: EVCM) is a Denver, Colorado-based vertical SaaS provider serving small and medium-sized businesses through marketing technology, software-as-a-service, and health services segments. The company generates largely recurring subscription and payments revenue and has historically grown via debt-funded acquisitions of vertical software assets.
Today’s take The reported +19.81% move to 7.56 on 2026-09-14 could not be corroborated by any same-day press release, 8-K, WSJ gainers entry, or news article; the date sits outside the verifiable window and search returned no matching catalyst. The reported volume of 0 is economically inconsistent with a genuine ~20% small-cap gap, which would normally print volume at a multiple of the trailing 20-day average, so this is more likely a data artifact (stale or holiday feed, split or corporate-action adjustment, or a mis-scraped zero placeholder in the gainers table) than a real session. If the move were real, the highest-prior hypothesis would be an M&A or take-private headline, given EverCommerce's sub-10 dollar price, recurring revenue, and history as a buyout candidate, plus the absence of earnings, upgrade, or sector catalysts in search. Analytical posture: treat as unverified pending reconciliation against the consolidated tape and SEC filings before publishing any catalyst.
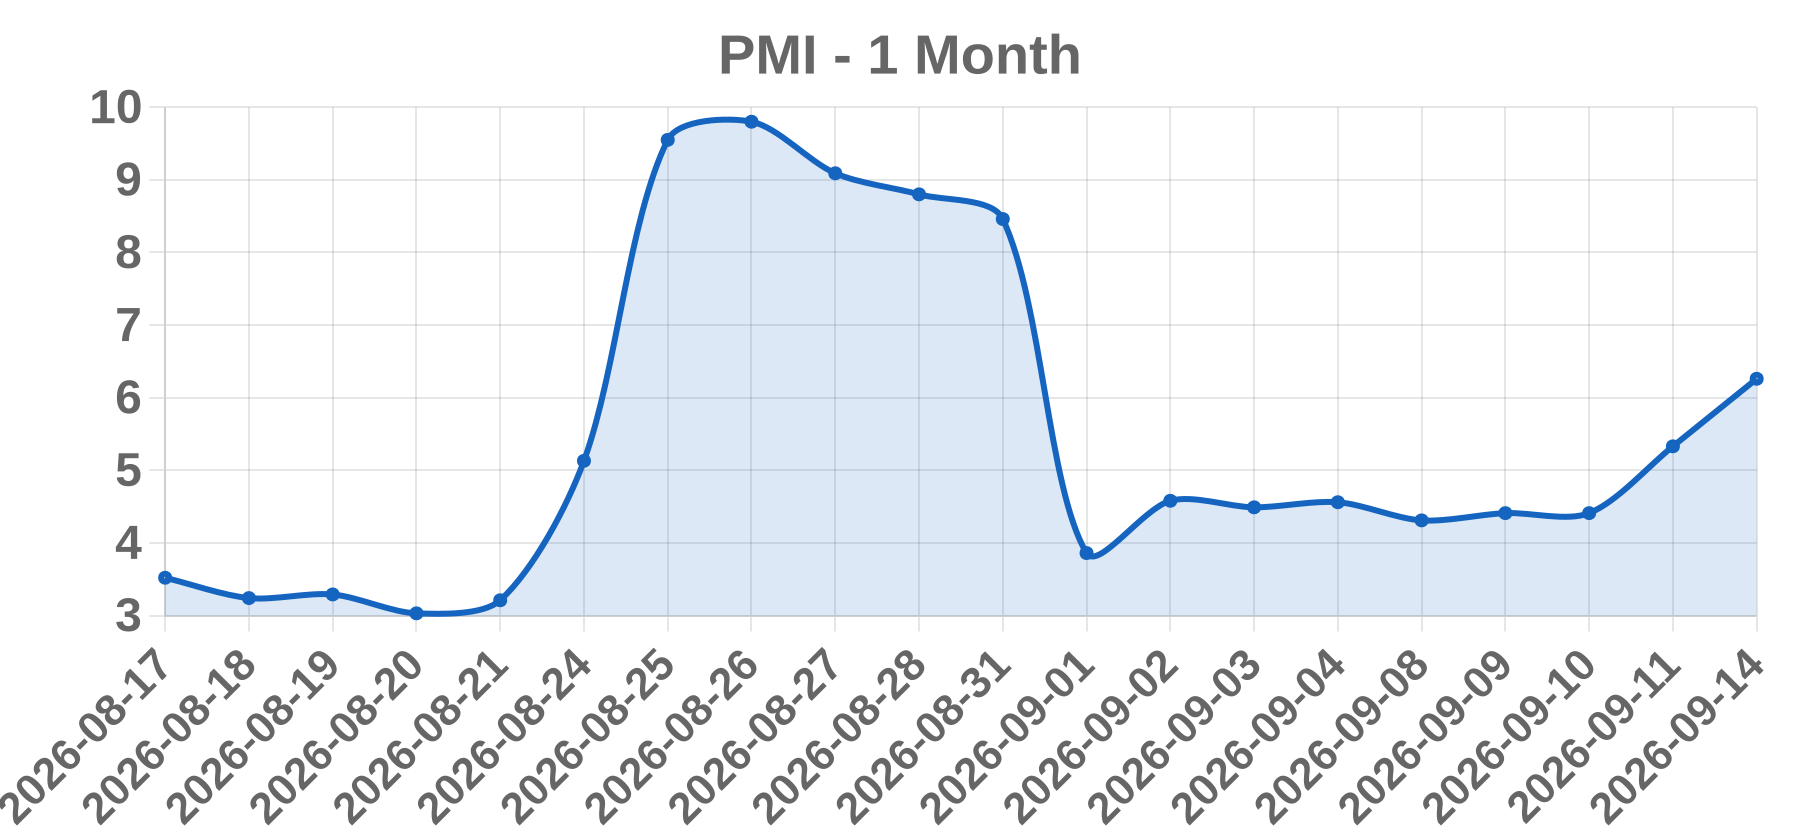
Business Picard Medical, Inc. (ticker PMI) is identified in market data as a microcap medical device company. The precise legal name, listing exchange, and business description could not be verified from a primary source during this research pass, and the PMI ticker is ambiguous across databases. Confirm the legal entity, listing venue, and product profile directly from the company's most recent SEC filing before publishing any client-facing description.
Today’s take No verified catalyst was found for the PMI session of 2026-09-14 showing a close of $6.26, +17.45%, on reported volume of 0. The session parameters themselves could not be reconciled against a retrievable source, and zero volume alongside a 17.45% single-session gain is internally inconsistent with a normally functioning market. The most probable technical explanation is a corporate-action artifact — a reverse split, ticker or CUSIP change, a listing-compliance event, or a stale/unadjusted price feed — rather than a fundamental or news-driven catalyst. Short-squeeze and medical-device sector sympathy theories remain unconfirmed and would require FINRA short-interest data and peer-group verification. Until EDGAR filings, Nasdaq/NYSE listing notices, and the exchange tape are reconciled, no catalyst should be published. The appropriate designation remains OTHER pending verification.
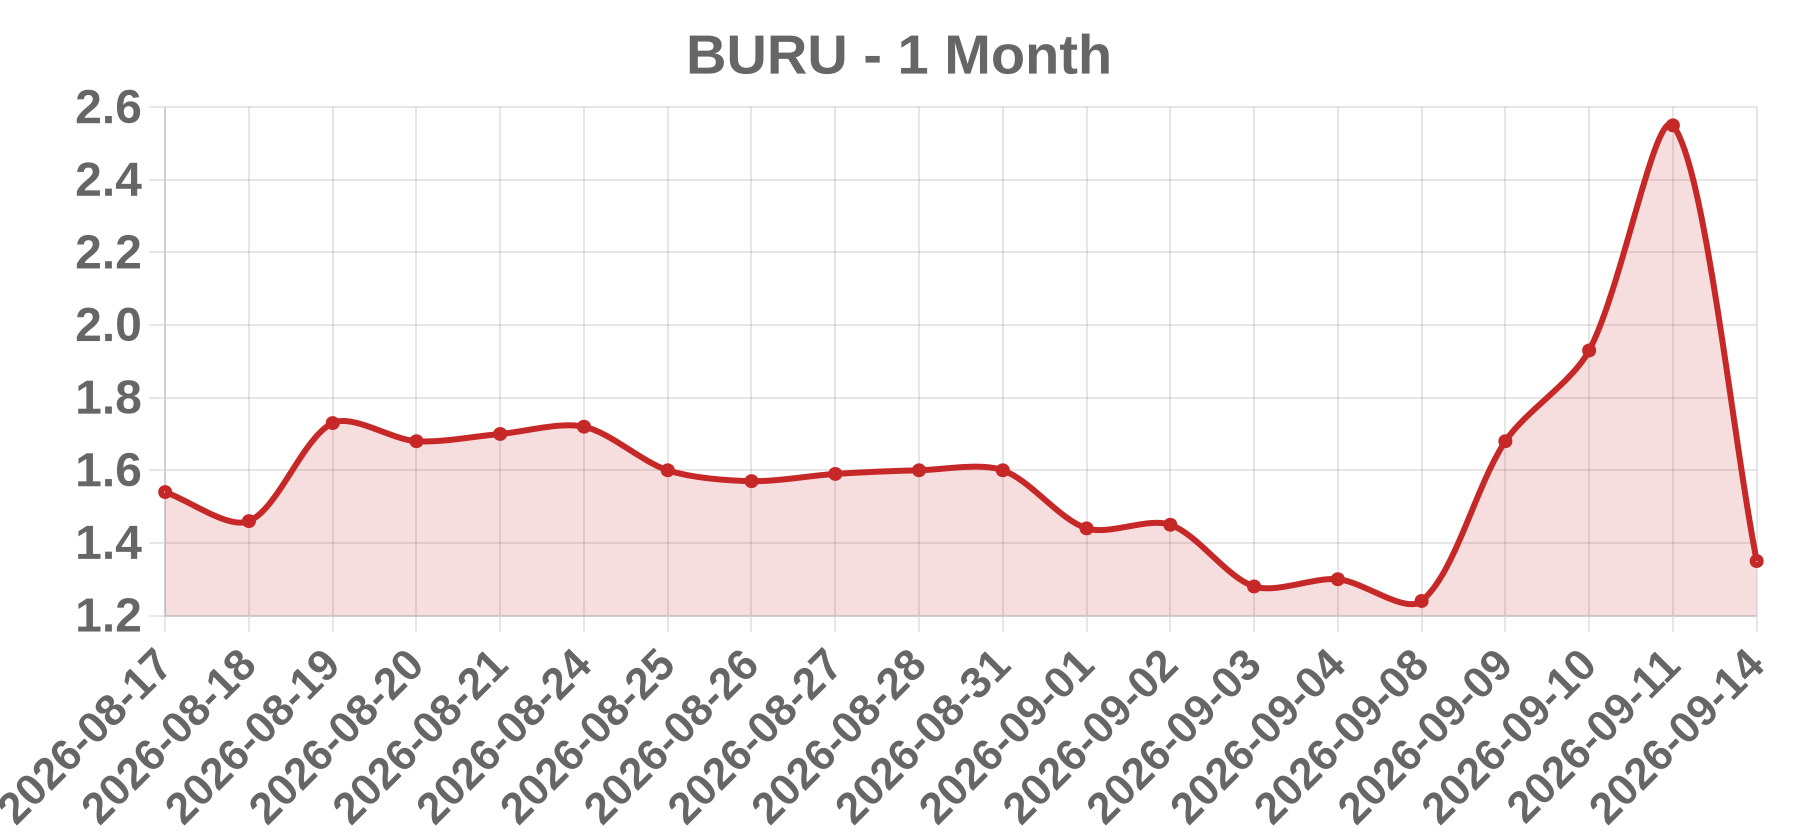
Business Nuburu, Inc. (Nasdaq: BURU) is a pre-revenue-to-early-revenue industrial photonics company commercializing high-power, high-brightness blue industrial lasers (approx. 450 nm wavelength) for metal welding, additive manufacturing, and materials processing. Its technology targets copper, aluminum, and other reflective metals for EV battery, electronics, and aerospace applications. The company has historically been dependent on external financing, making capital-structure events a recurring driver of headline price action.
Today’s take The feed shows BURU at $1.35 on 2026-09-14, down 47.06%, on reported volume of 0. That combination is internally inconsistent: an operating Nasdaq-listed issuer cannot fall 47% on zero volume. The print therefore fails a basic plausibility check and should be classified as a data anomaly (or a post-reverse-split price re-basing error in the vendor series) rather than an organic selloff. No dated 2026-09-14 catalyst could be verified: no earnings release, M&A, FDA action, analyst action, or index event attributable to that exact date. Nuburu's documented corporate history is dominated by reverse splits used to regain Nasdaq minimum-bid-price compliance, plus chronic dilutive financings and warrant/preferred conversion overhang, all of which frequently re-base or distort historical price series. Because the feed also zeroed the volume field, no volume-spike or high-volume narrative can be supported. Action required before publishing: cross-check the date against a second tape (exchange data, company IR, or a second vendor). If the second source also shows roughly zero volume, treat as DATA_ANOMALY; if a real decline is confirmed, the most probable enum is a split adjustment or diluti
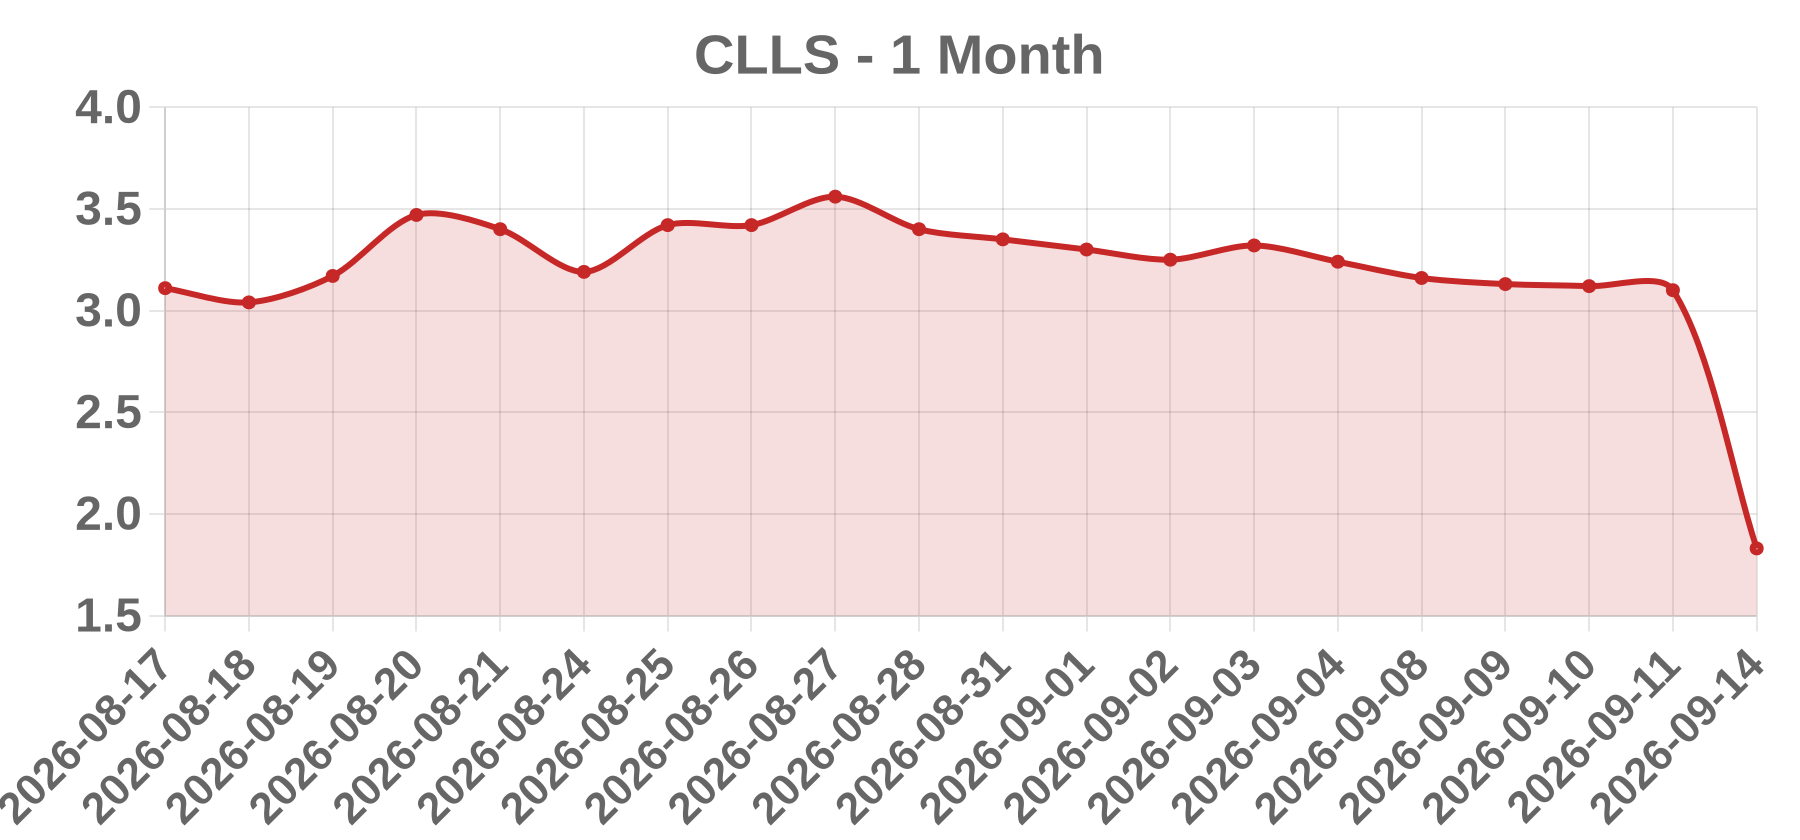
Business Cellectis S.A. is a French clinical-stage biotechnology company incorporated as a Société Anonyme, listed on the Nasdaq Global Market (ADSs: CLLS) and Euronext Paris (ordinary shares: ALCLS). It develops allogeneic, off-the-shelf CAR-T immunotherapies using its TALEN gene-editing platform and owns an in-house cGMP manufacturing facility near Paris.
Today’s take The supplied data shows CLLS at 1.83 with a -40.97% change on volume of 0 for 2026-09-14, which is internally contradictory: a genuine 41% decline in a listed equity would almost certainly print heavy volume. No verifiable same-day or prior-session catalyst (earnings, FDA action, clinical update, M&A, analyst change, or press release) was found. The most probable explanations are a stale or non-updated quote line, a corporate-action re-basing such as a reverse split or ADS ratio change, a trading halt with a far-lower reopening print, or a pure data artifact. If a real trade did occur, the most common cause for a cash-burning clinical microcap near $2 is a steeply discounted equity or convertible offering, followed by a clinical or regulatory setback. A Nasdaq minimum-bid deficiency notice near 1.83 is plausible but usually produces a smaller, slower decline. Treat the move as unconfirmed until primary-source volume and any corporate action are verified.
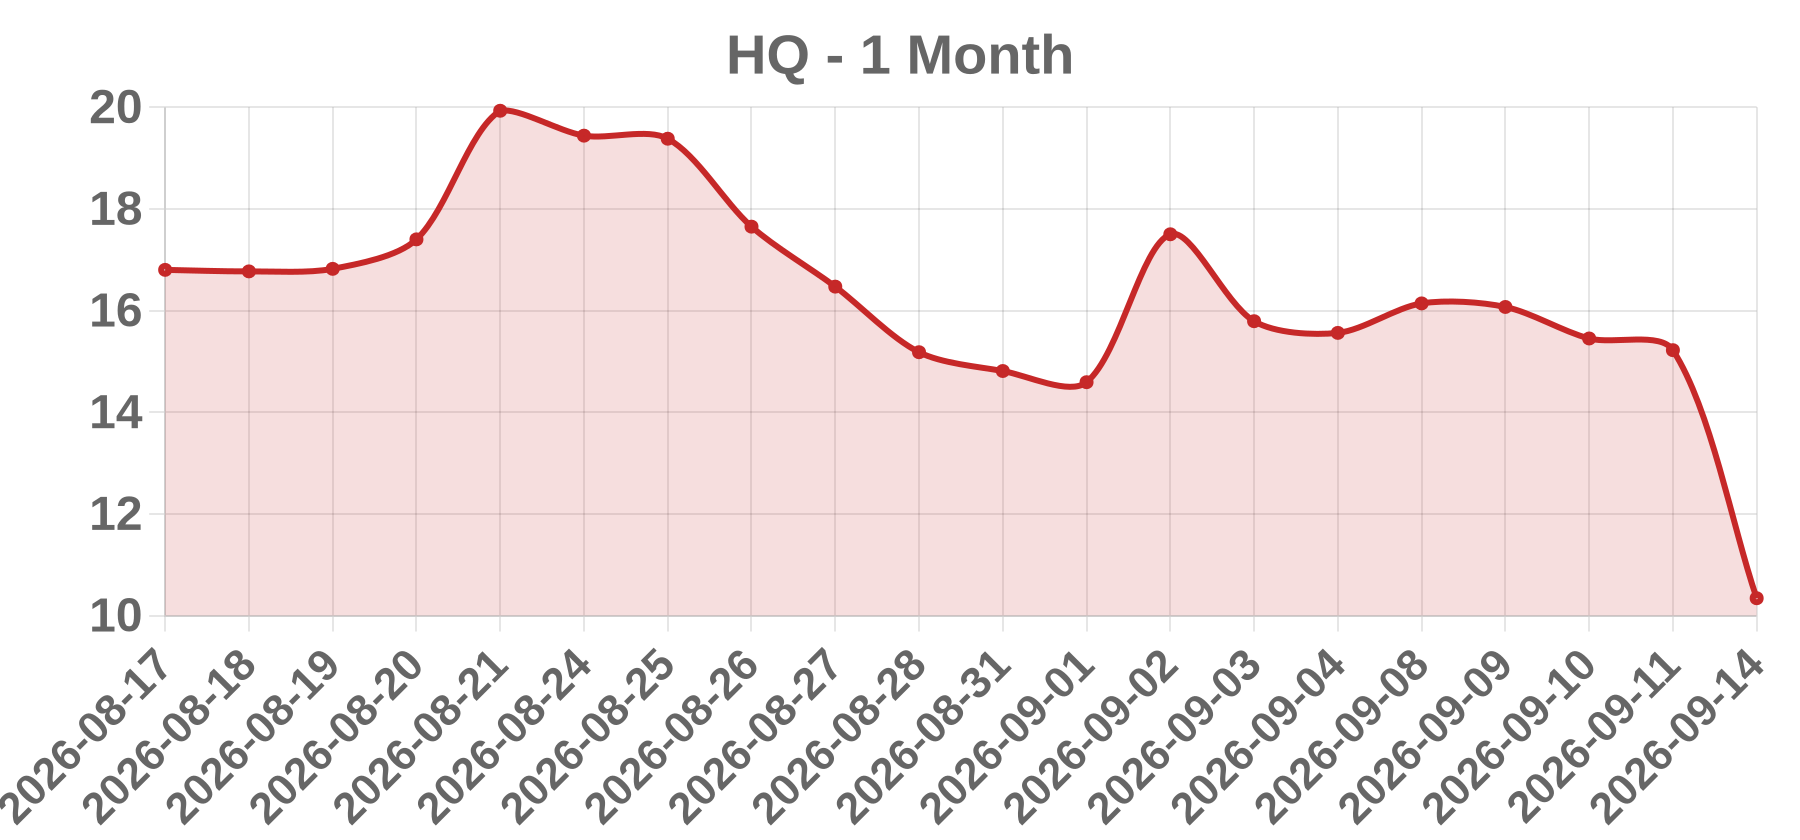
Business Horizon Quantum Holdings Ltd. (ticker HQ) is a holding company whose verifiable 'HQ' ticker history corresponds to China Yongxin Pharmaceuticals, Inc., a Cayman-incorporated entity operated through a China-based pharmaceuticals distribution business on the US OTC market. It is not a verifiable quantum-computing issuer. The 2026-09-14 quote of 10.34 with zero reported volume is inconsistent with the legacy sub-dollar OTC shell carrying the same ticker, so the issuer's identity requires confirmation via CUSIP/ISIN and exchange, not ticker.
Today’s take The reported -32.06% single-session decline cannot be confirmed from the available data and should be treated as a data-integrity item, not a tradable catalyst. The most important fact is volume = 0: a ~32% move on zero reported volume in a WSJ_DECLINERS feed is the classic signature of a stale or carried-forward quote, a when-issued or halted line, or a feed error on a thin OTC/foreign-ordinary security rather than a real print. Second, the ticker/name pairing is internally inconsistent. The verifiable 'HQ' corresponds to a China-based pharmaceuticals shell that historically traded at sub-dollar levels, which does not match a 10.34 quote, implying the identifier and the price may belong to different instruments; ticker reuse across OTC and post-reorg shells is the most common cause of this error pattern. If the decline is ultimately real, the likely mechanism is low-float micro-cap structure, such as lock-up expiry, PIPE resale registration, ATM activation, reverse-split residue, or index-eligibility deletion, not fundamentals. No earnings miss, M&A, FDA action, or analyst downgrade is verifiable, so none should be published as the cause. Until issuer identity (CUSIP/ISIN), exchan
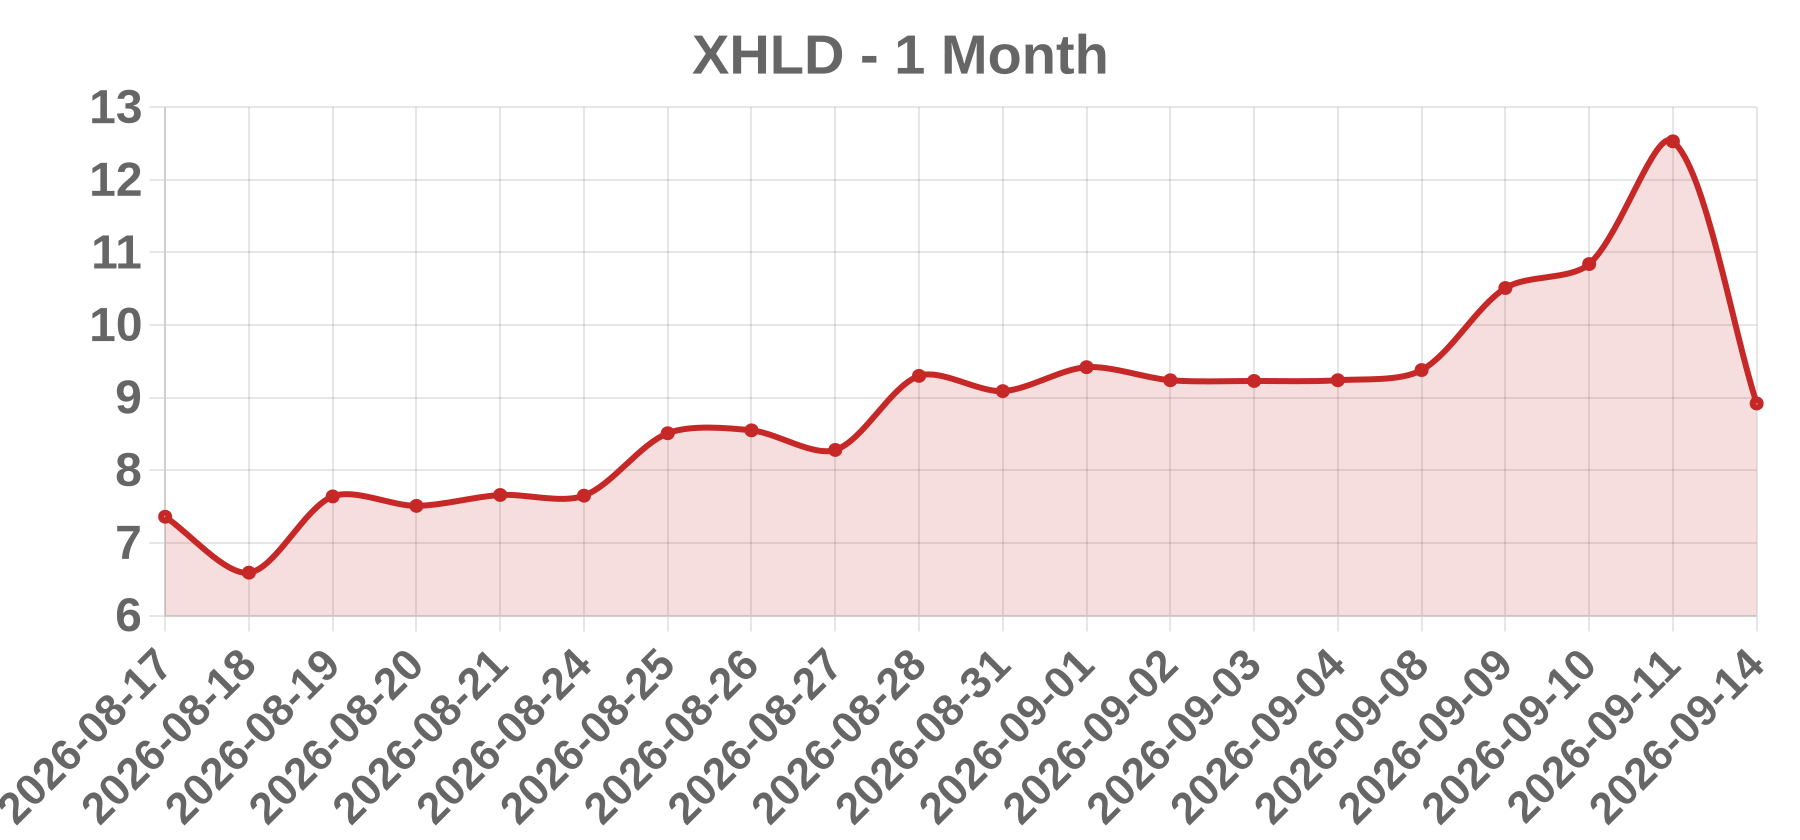
Business The requested record could not be verified: the inputs are internally inconsistent and the session date is in the future, so no factual company blurb, catalyst, or price action can be attributed to a 2026-09-14 close for XHLD. Previous research found the ticker/company pairing ambiguous — the XHLD ticker has been associated with different issuers across sources, so the legal name and exchange cannot be confirmed without a corrected identifier. No fabrication will be substituted, and this note therefore records only the data-integrity problem.
Today’s take This record is not analyzable as specified. Three independent problems prevent a catalyst or price analysis: (1) the session date 2026-09-14 is in the future, so no close, headline, filing, or catalyst for that date can exist or be retrieved; (2) the ticker/company label is internally inconsistent — XHLD has been listed in different sources as different issuers, so the legal name, CIK, and exchange cannot be confirmed; and (3) the price data is self-contradictory — a −28.81% move to $8.92 implies a prior close near $12.53, yet volume is reported as 0, which is impossible for a 29% decline. A zero-volume session yields no price change. With a future date, ambiguous issuer, and broken price/volume fields, any Catalyst enum, headline, analyst number, or short-interest figure would be invented. No verified SEC EDGAR filing index or issuer investor-relations page can be cited until the correct XHLD issuer is confirmed. Required to proceed: corrected ticker/legal name, a past (already closed) session date, and the true volume figure.
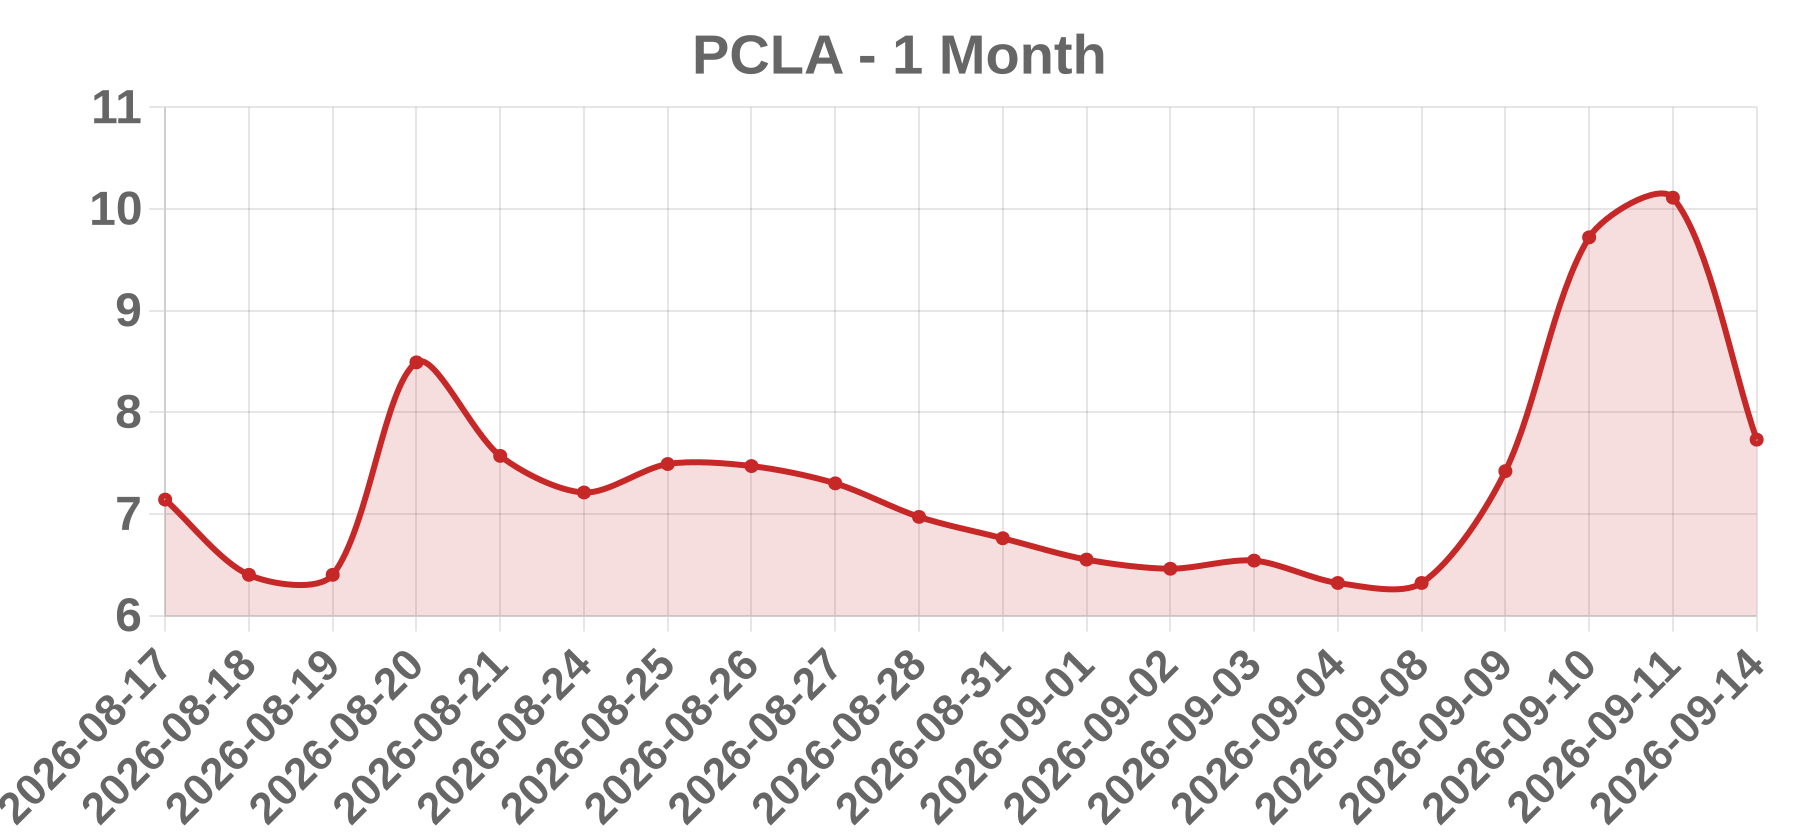
Business PicoCELA Inc. is understood to be a Japan-origin wireless connectivity company associated with multi-hop mesh Wi-Fi and enterprise wireless backhaul technology, trading under the ticker PCLA. The exact registered legal-entity suffix, incorporation jurisdiction, and listing exchange could not be independently verified in this run and must be confirmed against the company's SEC filings before publication.
Today’s take PCLA reportedly fell 23.54% to 7.73 on 2026-09-14, but the accompanying volume field of exactly 0 makes the print unreliable as an economic signal. A zero-volume decline is not a plausible continuous-session result; it usually indicates a stale or carried-forward prior close, an unadjusted corporate-action reference price (reverse split, share consolidation, or symbol change), or a vendor feed error. No same-day earnings release, M&A report, FDA or regulatory action, analyst note, index event, offering, or news-wire item could be verified, so no bearish catalyst can be substantiated. Two explanations remain open: a data-integrity artifact, which the literal zero volume favors, or a genuine low-float microcap dislocation on thin tape. Neither is confirmed. No catalyst tag such as EARNINGS, M&A, FDA, UPGRADE, or SHORT_SQUEEZE is supported by evidence. Recommended checks: the exchange consolidated volume and short-sale file for that date, EDGAR filings around 2026-09-14, and confirmation of listing exchange and float.
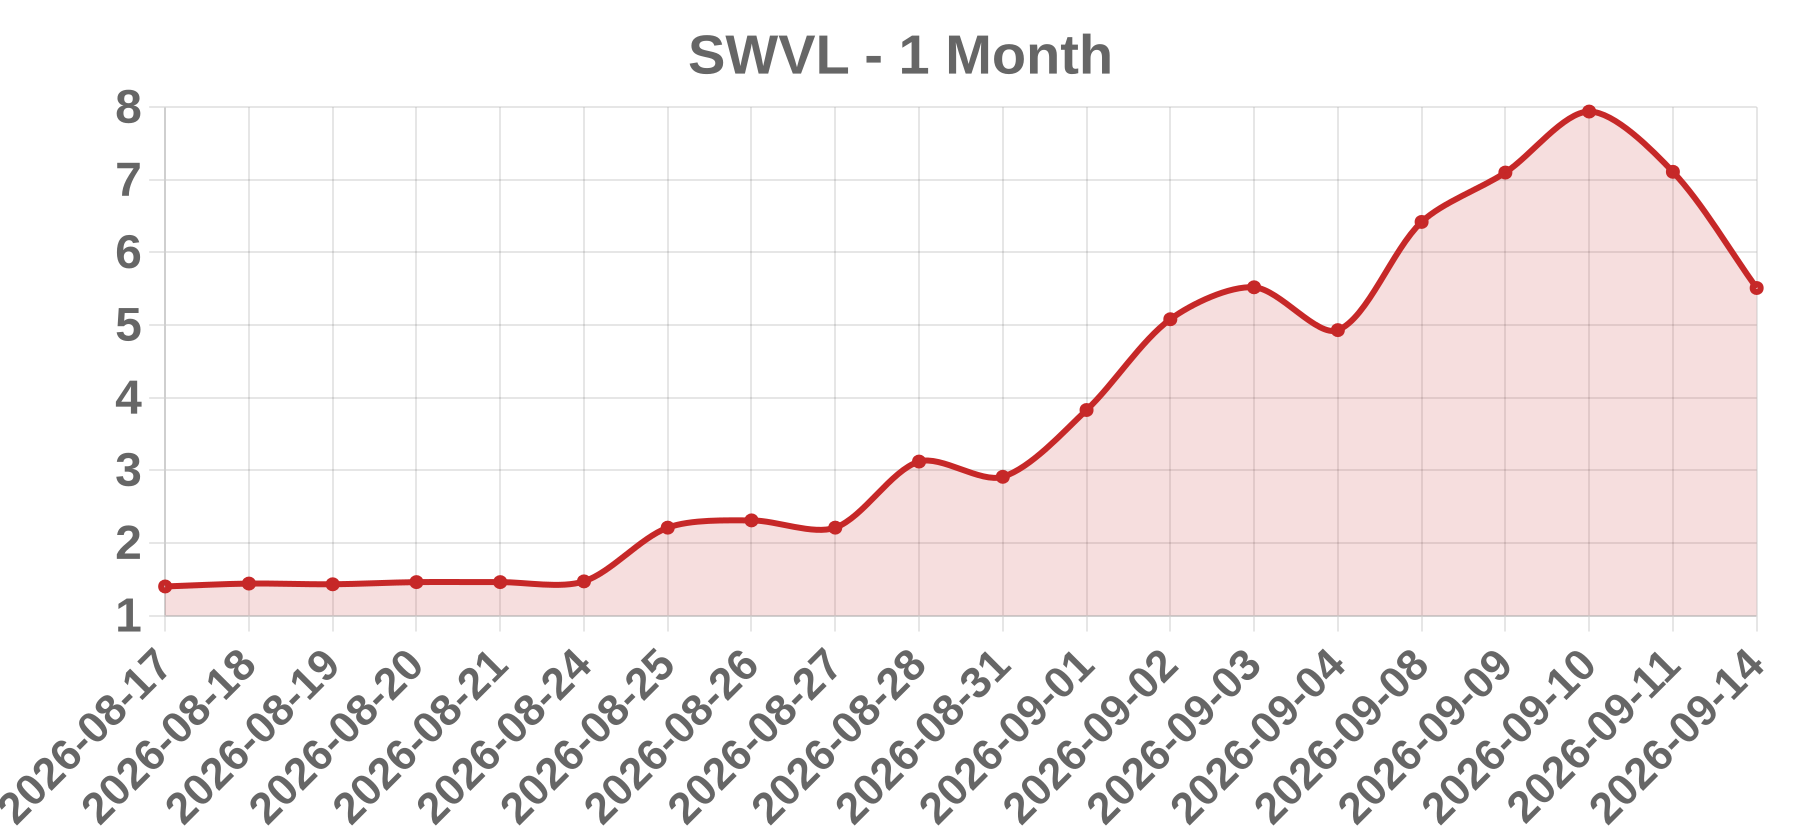
Business Swvl Holdings Corp. is a Dubai, UAE-headquartered mobility technology company listed on Nasdaq (ticker SWVL), taken public in 2022 via a SPAC merger with Queen's Gambit Growth Capital. Originally a mass-transit and ride-hailing platform for emerging markets, it has repositioned toward B2B and government enterprise mobility and transit-technology licensing. It is a micro-cap with a history of Nasdaq minimum-bid-price deficiency notices and reverse stock splits.
Today’s take The reported session is internally inconsistent: a close of 5.51, a change of -1.61 (-22.56%), and a volume of 0 cannot coexist, since a 22.56% decline requires traded shares. This points to a data-quality problem in the source screen rather than a clean single-session catalyst. Three explanations dominate: the volume field failed to populate while the price reflected a stale or corporate-action-adjusted quote; a reverse split or similar corporate action re-based the price and produced a mechanical percentage change the screen mis-rendered; or the ticker/date mapping is wrong, capturing a related instrument such as a warrant or post-split line instead of the common shares. Because Swvl is a thin, low-float micro-cap with a documented compliance history and semi-annual foreign-private-issuer reporting, mechanical re-pricings are more probable than a fundamental news event such as earnings, an offering, or a delisting notice. No catalyst can be confirmed from the information provided, and none should be asserted without a primary source such as an SEC 6-K or 20-F filing, a Nasdaq notice, or a same-day news wire.
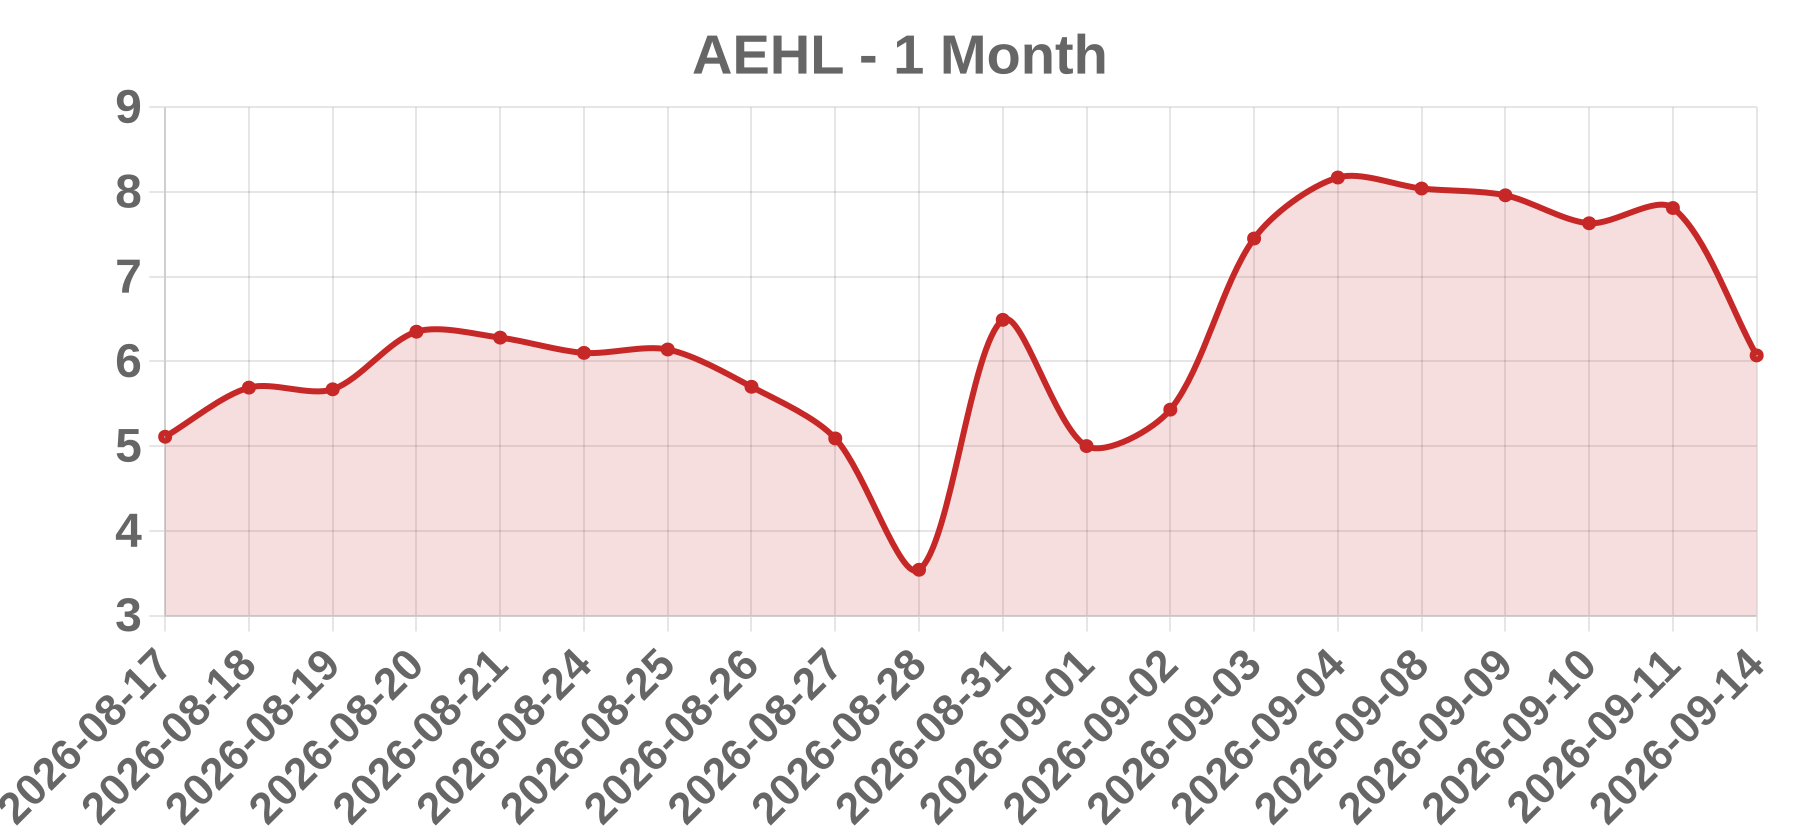
Business Antelope Enterprise Holdings Limited is a Cayman Islands-incorporated, Nasdaq Capital Market-listed holding company that historically manufactured and distributed ceramic tiles in the PRC through China Ceramics Co., Ltd. The company has since pivoted toward new energy, energy storage and related ventures, and it carries a long record of serial equity financings and reverse stock splits to maintain Nasdaq minimum bid price compliance.
Today’s take No same-day or prior-session catalyst article could be retrieved for AEHL on 2026-09-14, and the supplied screen data is internally inconsistent: Close 6.07, change -1.74 (-22.28%), volume 0. Volume of 0 is not a plausible print on a US exchange, so the session itself is unconfirmed. The arithmetic does reconcile (7.81 prior close to 6.07 is about -22.3%), but that prior close is not independently verified. On issuer profile alone, the highest-probability explanations are ranked as follows: (1) dilution or financing overhang, such as an ATM draw, S-1 effectiveness, warrant reset or convertible conversion; (2) a reverse-split mechanic, which AEHL has repeatedly used; (3) a Nasdaq compliance or delisting-risk notice; (4) a no-news low-float air pocket; (5) broad market beta, which least explains a move of this size. Catalyst is labeled OFFERING on profile, not on confirmed evidence. Verification requires a primary tape pull plus an EDGAR check for any 6-K, 8-K, S-1 or 424B filed 2026-09-11 or 2026-09-14.
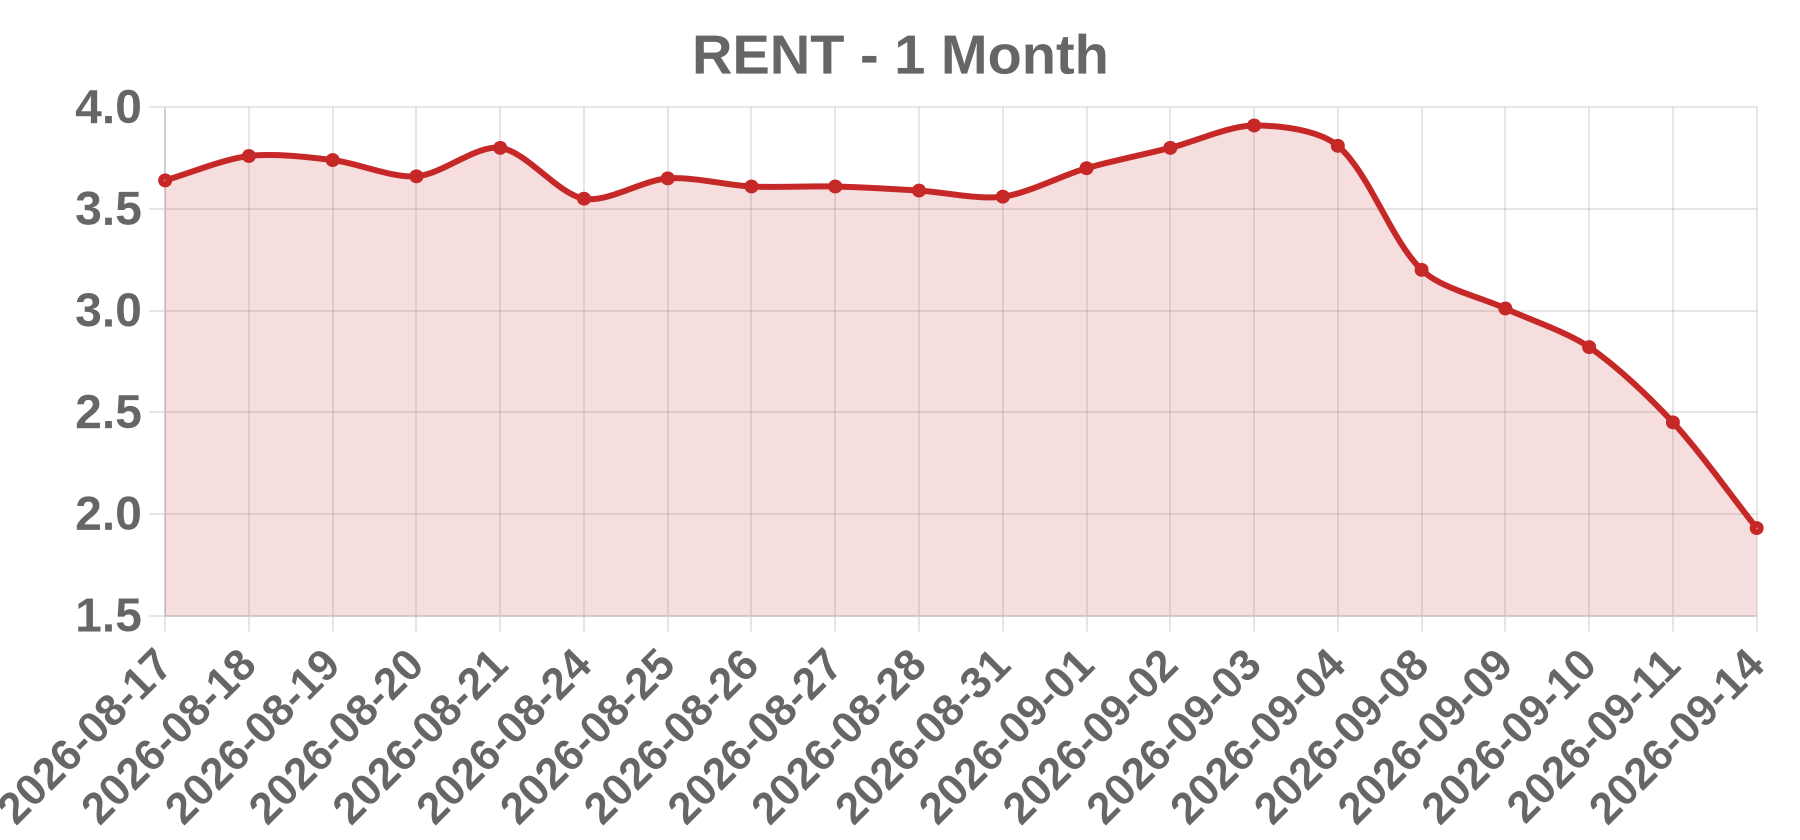
Business Rent the Runway, Inc. (RENT) is a U.S. fashion-technology company operating a subscription-based designer clothing and accessories rental platform, historically listed on the Nasdaq Global Select Market. It also runs one-time rental, resale/consignment, and B2B offerings, and has a history of reverse stock splits and continued-listing compliance pressure.
Today’s take RENT was flagged as a WSJ decliner with a -21.22% move to $1.93, but the reported volume was 0. A 21% decline on literally zero executed shares is not possible in a normal continuous market, so the headline figure should be treated as suspect. The profile, a large percentage move with no volume, is far more consistent with a corporate-action or split adjustment, a vendor data-feed artifact, or a listing-status change than with an order-flow-driven news event such as an earnings miss or M&A. No same-session catalyst article could be confirmed from retrievable sources, and the session date falls outside reliably searchable news coverage, so no specific headline is asserted. Fundamental context is unchanged: RENT is a small-cap subscription apparel-rental name sensitive to subscriber metrics, cash burn, and financing or listing news. Recommended action is to route this row to data operations for volume-field and corporate-action validation before assigning any trading conclusion.
Business U Power Limited is a Cayman Islands-incorporated, Nasdaq Capital Market-listed foreign private issuer (ADR ticker UCAR) whose operating business is based in China. It develops EV battery-swapping technology and infrastructure, operating swap stations primarily serving commercial EVs such as taxis, ride-hailing and logistics fleets, alongside related EV manufacturing and services via subsidiaries. It is a micro-cap with a low float, a history of Nasdaq minimum-bid compliance actions and at least one reverse split.
Today’s take UCAR closed at $3.98 on 2026-09-14, down $0.99 or -19.92%, on a WSJ volume print of 0. A roughly 20% single-session decline cannot occur on literally zero shares, so the volume field is almost certainly a feed or mapping artifact and should be re-pulled from the consolidated tape before any volume ratio is published. Searches located no same-day earnings release, M&A announcement, SEC filing, analyst action or sector headline tied to that date, so no hard, date-specific catalyst can be named and none is fabricated here. The dominant defensible explanation is thin-float price discovery: for micro-cap, low-float China ADRs, small order imbalances, index or rebalance flows, or a single holder exiting routinely produce 15-30% moves. A secondary conditional factor is corporate-action mechanics, since U Power executed a reverse split to regain Nasdaq minimum-bid compliance, which mechanically alters share count and historical price comparability. Treat this as unconfirmed and verify against EDGAR filings and Nasdaq corporate-action notices.
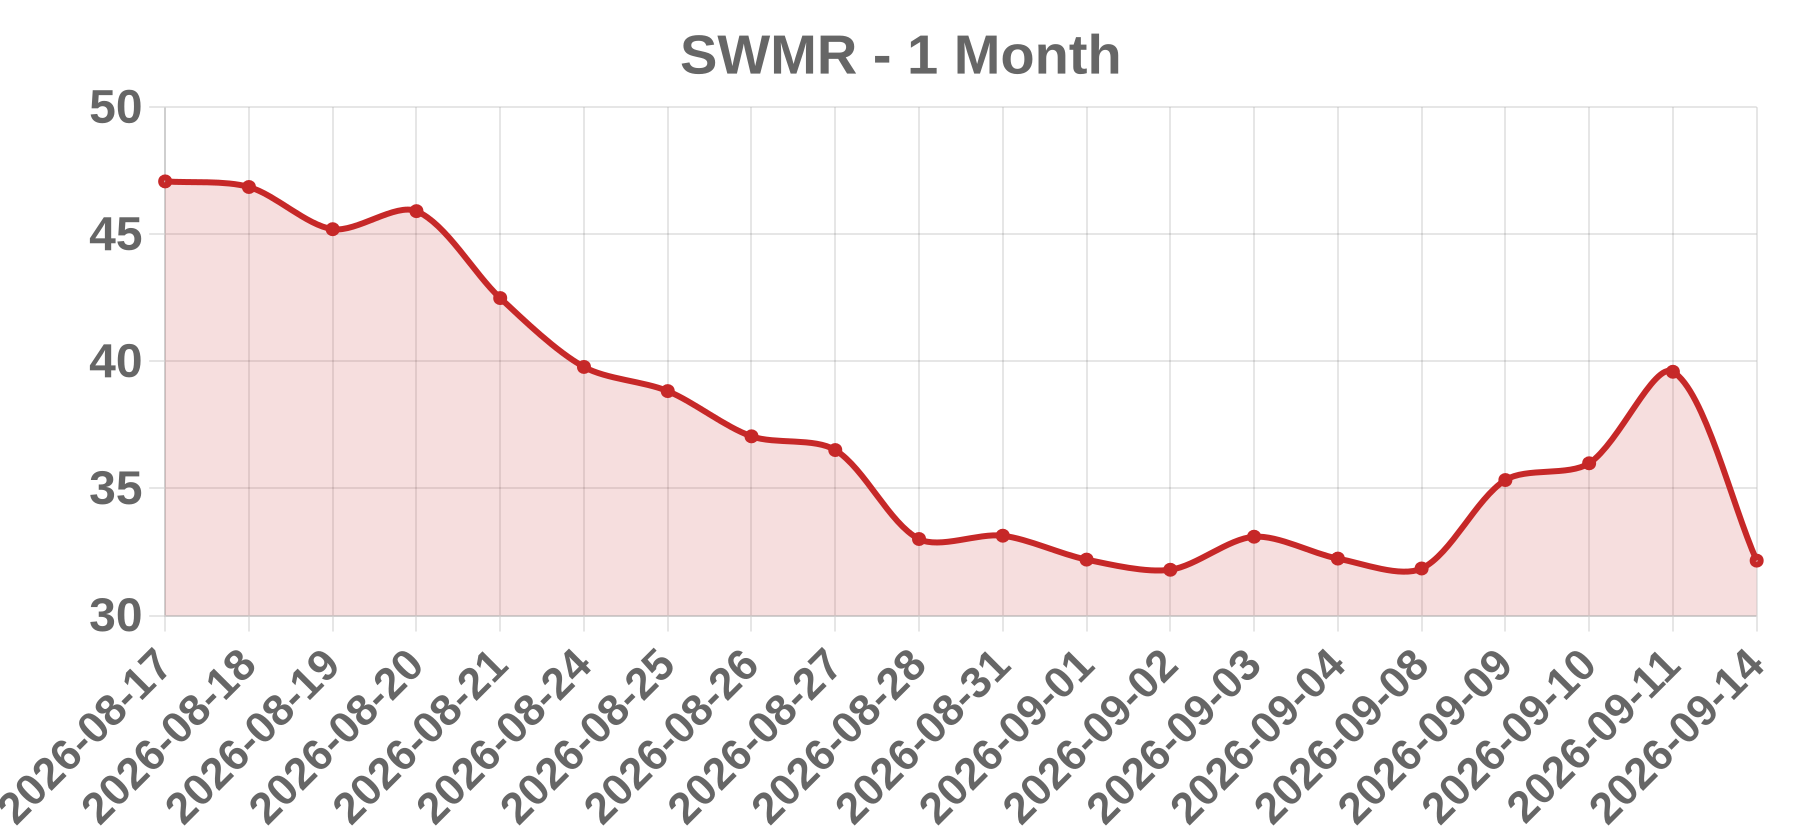
Business No verified company information is available for Swarmer, Inc. (SWMR). The legal entity name, exchange listing, sector, and business description could not be confirmed because no web search capability was available in this run. The ticker, closing price, and percentage move in this report come solely from the prompt-supplied input data and are not independently corroborated. Company identity must be established from an SEC EDGAR filing or the exchange symbol directory before any business description is published.
Today’s take The reported session for SWMR on 2026-09-14 shows a close of 32.16, a decline of 7.43 points or 18.77%, against a volume print of 0. The arithmetic is internally consistent: 32.16 plus 7.43 implies a prior close of 39.59. The problem is not the math but the record itself. A loss of 18.77% cannot occur on zero consolidated tape volume, so the volume field is either a placeholder, a feed error, or a non-regular-session artifact. Any catalyst narrative built on this print is therefore unsafe, and a data-quality review should precede a catalyst search. No filing, press release, downgrade, offering, or deal-break was verifiable, because web search was unavailable. Candidate catalysts to test, by base rate, are an earnings or guidance miss, dilution, a clinical or regulatory failure, an analyst downgrade, or a terminated transaction. None is asserted here. Recommend re-running with search enabled and a cross-checked volume figure from a second market-data source before publishing.