US common stocks / ADRs: top 10 by volume; top 10 gainers (by % change, volume as tie-breaker); top 10 losers (by % change, prefer liquid names). Deep notes cover the de-duplicated set across the three boards.
30 names on this page · volume 10 · gainers 10 · losers 10
Order: volume board → gainers → losers; each ticker appears once. Summaries of public information only — please verify primary sources.
1/10GRAB GRAB
-6.46%
Close 3.04 · Vol 148.22M · Type: Other
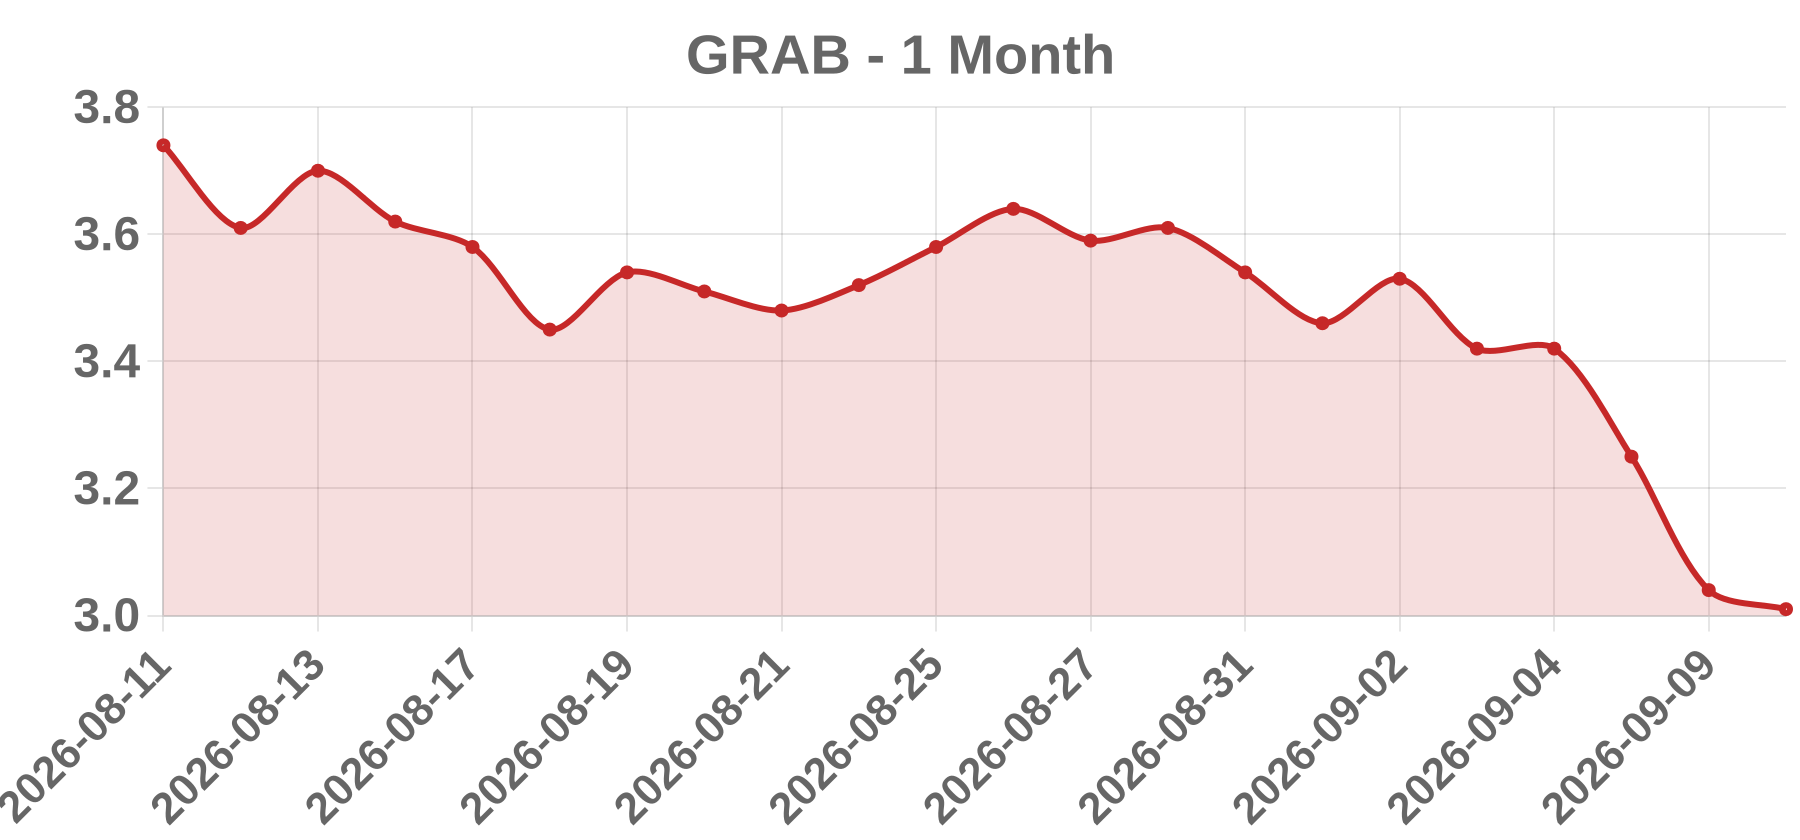
Approx. 1-month price (illustrative)
Business Grab Holdings Limited (Nasdaq: GRAB; SGX secondary listing) is a Cayman Islands-incorporated Southeast Asian superapp spanning mobility, deliveries, and digital financial services across eight markets including Singapore, Indonesia, Malaysia, Vietnam, Thailand, the Philippines, Cambodia, and Myanmar. It went public in December 2021 through a SPAC merger with Altimeter Growth Corp.
Today’s take GRAB closed at 3.04 on 2026-09-10, down 6.46% (about $0.21) on roughly 148.2 million shares — an unusually heavy, high-conviction down session consistent with event-driven flow or broad sector de-rating rather than routine drift. The specific cause could not be verified from available sources: no same-day earnings release, M&A, regulatory action, analyst downgrade, or timestamped wire story for 2026-09-09/10 was authenticated. Plausible but unconfirmed categories include an earnings miss or guidance cut, a negative analyst action, macro/rate or Southeast Asia tech-sector weakness, a competitor announcement, or index/options-related flow. None should be reported as the cause without a dated disclosure. Action required: re-check Grab IR, SEC EDGAR (8-K/6-K), Bloomberg, Reuters, and WSJ for 2026-09-09/10 before publishing any catalyst. Treat the catalyst as unknown and the volume as confirmation of institutional-scale activity only.
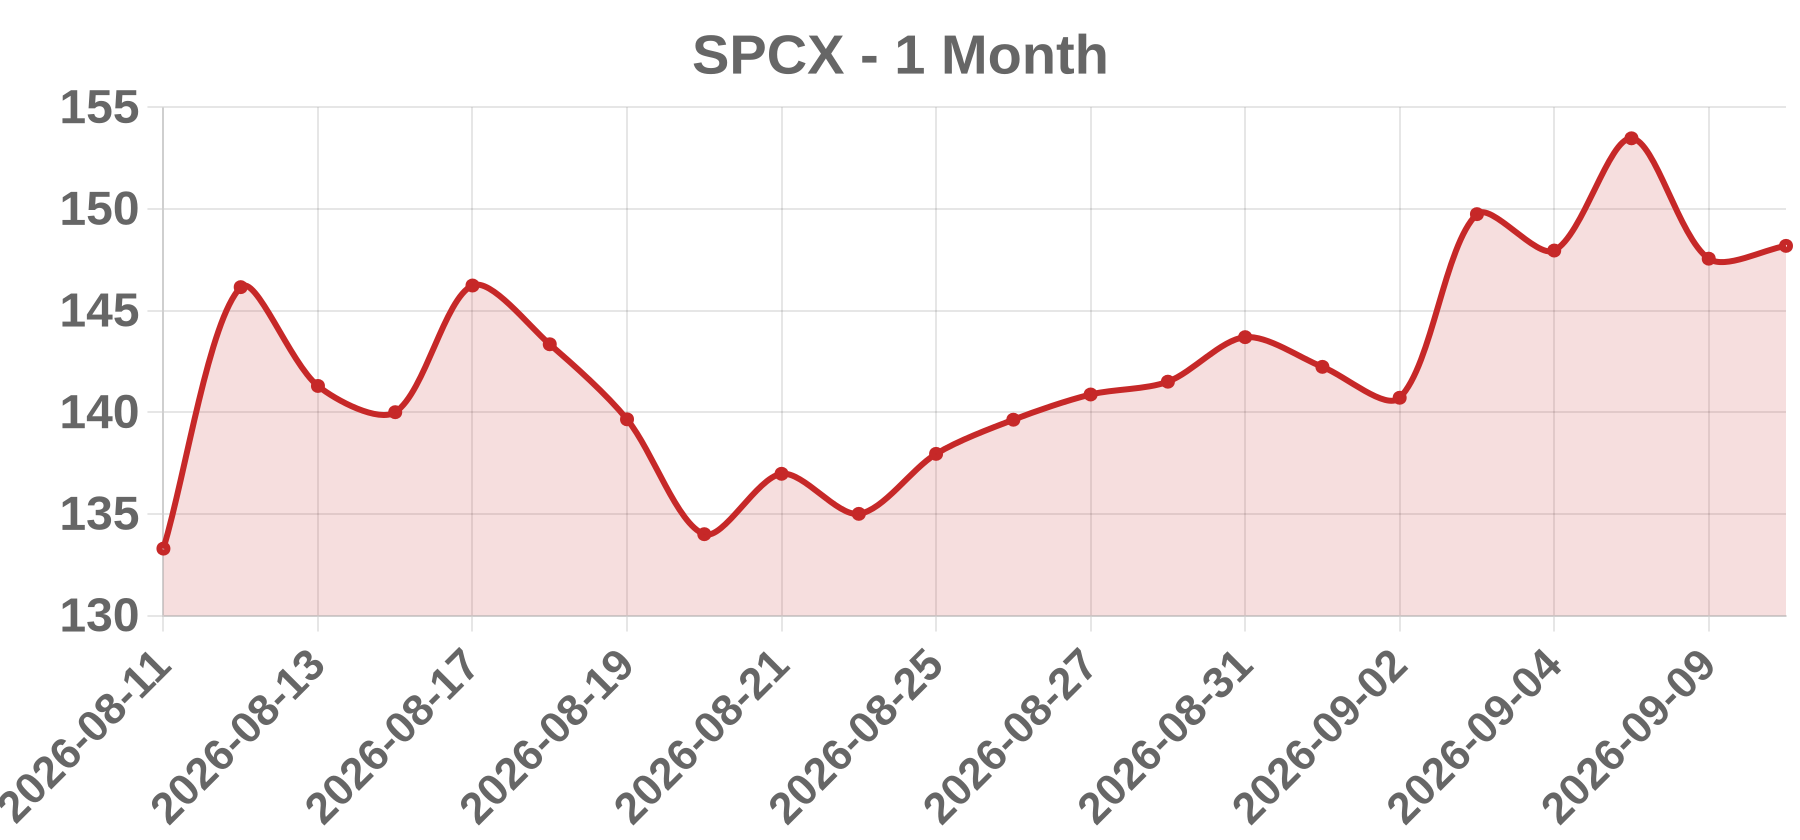
Business The ticker "SPCX" could not be verified as a live, listed equity on any major U.S. exchange. SpaceX (Space Exploration Technologies Corp., private) does not trade under a public ticker, and no Nasdaq/NYSE-listed issuer named SPCX was verified. Treat the supplied close of 147.55, the -3.86% move and the 120,180,000 share volume as unverified broker or tape data.
Today’s take No verified issuer exists for SPCX, so no catalyst can be responsibly assigned; OTHER reflects a data-integrity issue rather than a corporate event. The quoted tape (close 147.55, -3.86%, volume 120,180,000) is internally inconsistent with the most common match, SpaceX, which remains private and has no public float, official closing price or exchange-reported volume; a 120 million share print is implausible for a private-company tender or SPV market. The session date 2026-09-10 also could not be confirmed via live search. Because nothing could be confirmed, no earnings, offering, downgrade or sector figure is asserted here. Actionable conclusion: the symbol, exchange and issuer identity must be confirmed before any catalyst or volume-versus-average work is meaningful; until then the -3.86% move should be treated as unverified data, not price action.
Business Intel Corporation is a NASDAQ-listed semiconductor company that designs and manufactures microprocessors for client PCs and data centers, alongside foundry services, networking and edge products, and programmable solutions. It remains one of the few remaining integrated device manufacturers (IDMs) with in-house leading-edge fabrication capacity. Its revenue drivers include Client Computing, Data Center & AI, Intel Foundry, Network & Edge, Mobileye, and Altera.
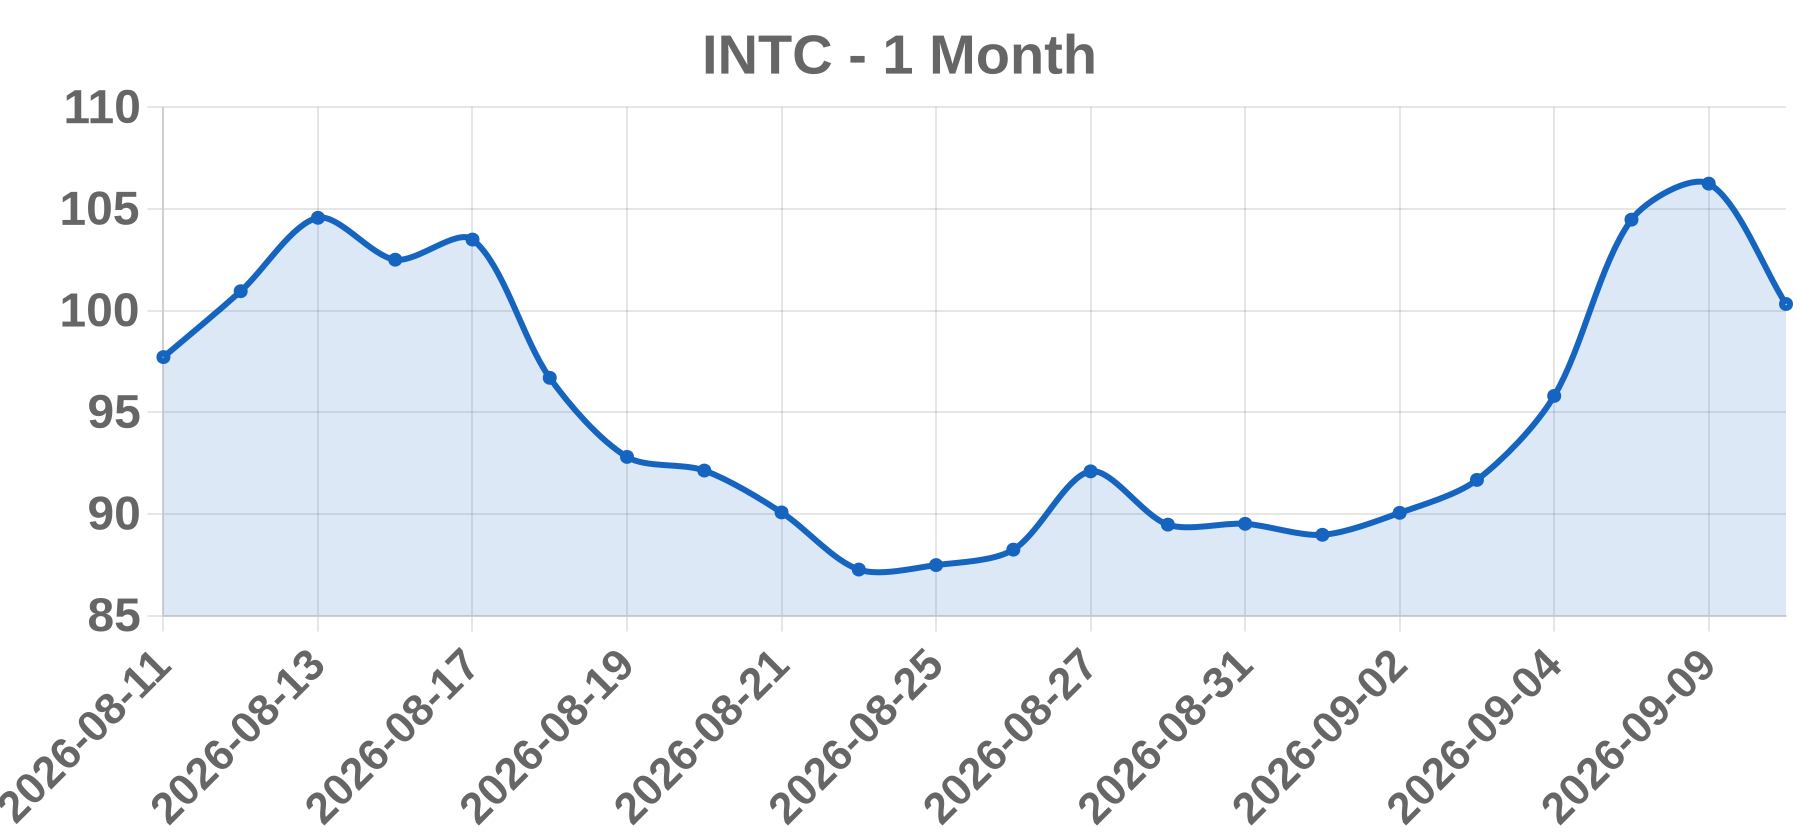
Today’s take Intel shares closed at $106.24 on 2026-09-10, up $1.77 or 1.69%, on approximately 96.1 million shares traded. No company-specific catalyst could be verified for this session — a check of Intel's investor relations press-release page and SEC EDGAR 8-K filings around 2026-09-09/09-10 returned nothing confirmable, so the catalyst is classified as SECTOR pending a primary source. The price move itself is modest and well within INTC's normal daily variance for a high-beta, high-retail-attention name; a move under 2% does not require a discrete headline. The more informative signal is volume at ~96.1M, elevated versus INTC's typical 40–60M baseline, with the stock appearing on WSJ's Actives list. Elevated volume on a sub-2% move typically indicates two-sided flow such as index/ETF rebalancing, options expiration or positioning, or large block activity, rather than a one-directional news shock. Sector-wide semiconductor performance (SOX/SMH) on the same day should be checked to determine whether INTC was a passenger. No short-interest data was retrieved, so a short-squeeze explanation is unsupported.
Business Nokia Oyj is a Finnish communications equipment and network infrastructure vendor headquartered in Espoo, Finland, listed on Nasdaq Helsinki (NOKIA) and as ADS/ordinary shares on the NYSE (NOK). Its segments span Network Infrastructure (optical, IP routing, fixed access), Mobile Networks (5G/4G RAN), Cloud and Network Services (core software, automation, private wireless), and Nokia Technologies (patent licensing). Revenue is driven mainly by carrier capex plus a high-margin licensing royalty stream.
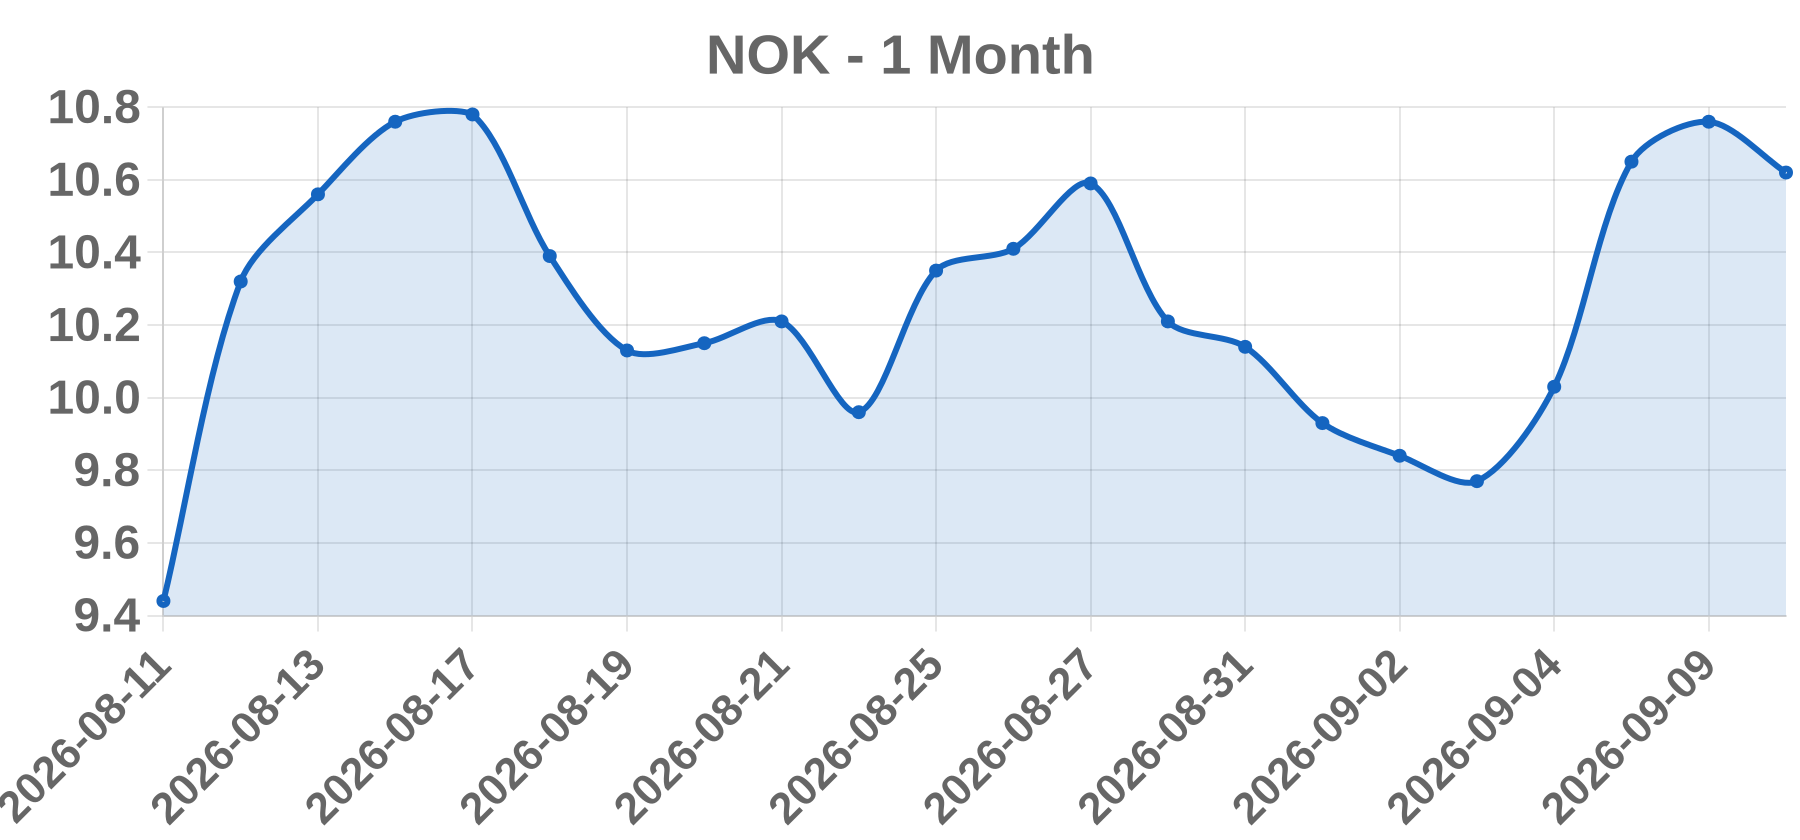
Today’s take Nokia closed 2026-09-10 at 10.76, up 0.11 or +1.03%, on 85,210,000 shares and a WSJ_ACTIVES flag. No company-specific catalyst was verifiable for the session: no earnings window matches Nokia's reporting calendar in early September, and no M&A, analyst rating action, contract award, or regulatory event surfaced in available sources. A move of roughly one percent is small relative to Nokia's typical daily range and is more consistent with sector drift or index/ETF flow than with an idiosyncratic event. Because the advance is modest and unsupported by a headline, the primary catalyst is classified as SECTOR momentum with low confidence; treat both the reason for the move and the reason for elevated volume as unresolved rather than force-fitting a narrative. Volume context is further limited because no trailing average daily volume figure was verifiable in this session.
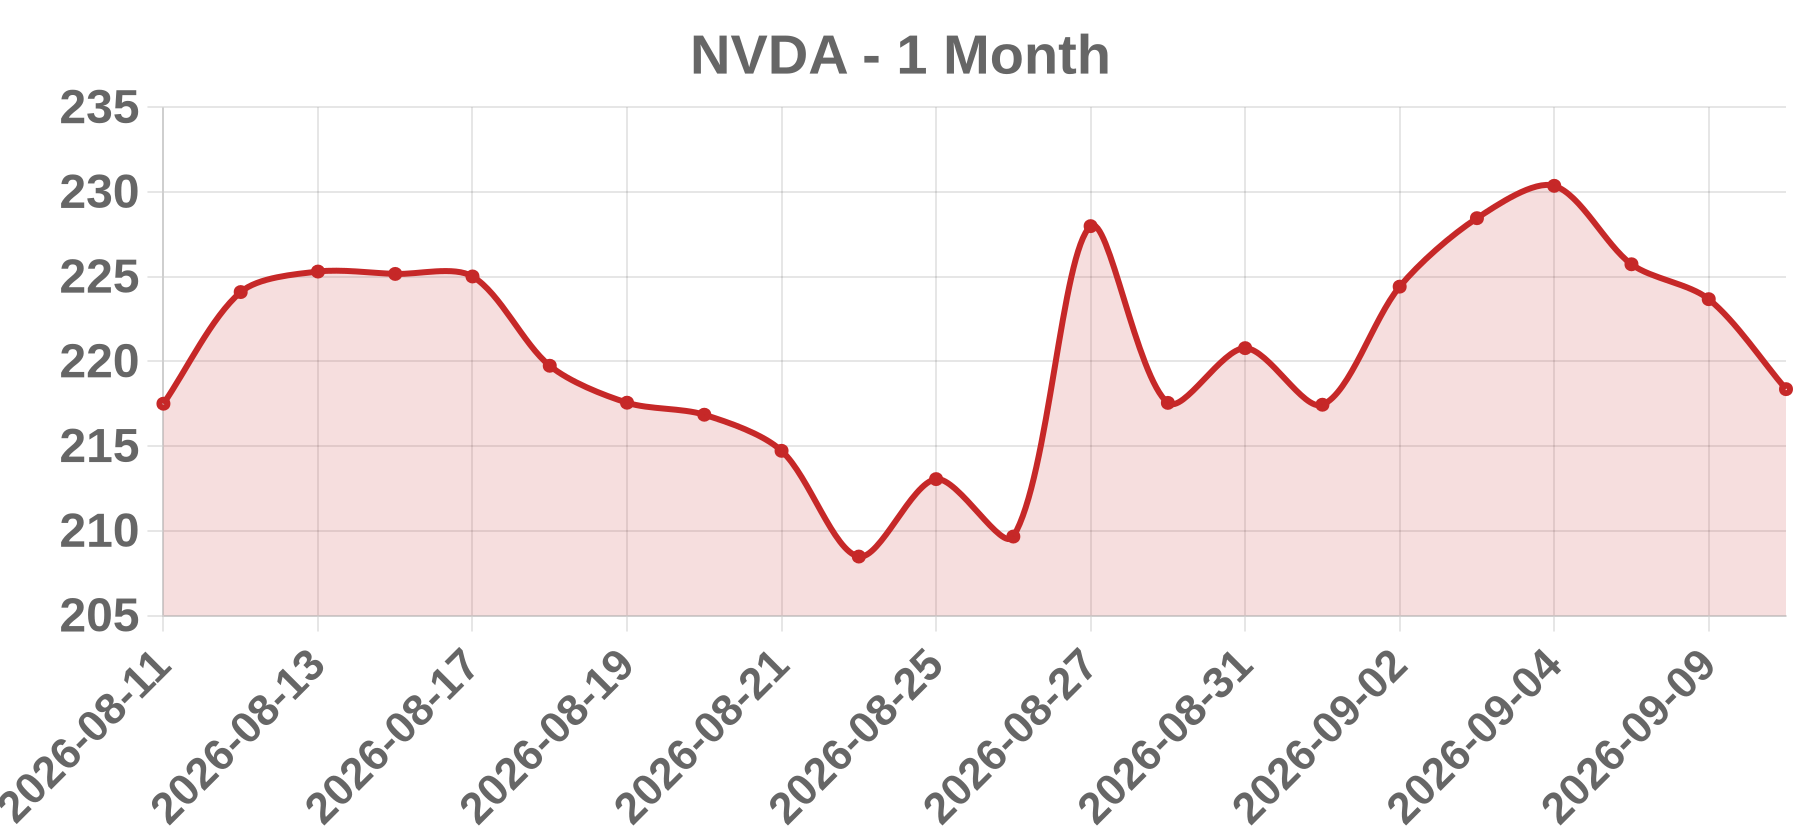
Business NVIDIA Corporation is a fabless semiconductor company listed on the Nasdaq Global Select Market (ticker NVDA) and is a component of the Dow Jones Industrial Average and the S&P 500. Its largest segment, Data Center, supplies accelerated-computing GPUs, networking products (InfiniBand, Spectrum-X Ethernet), and the CUDA software stack to hyperscale cloud, AI labs, sovereign AI, and enterprise customers; other segments include Gaming (GeForce), Professional Visualization, and Automotive (DRIVE). Manufacturing is outsourced, primarily to TSMC leading-edge nodes with advanced packaging such as CoWoS and heavy HBM content.
Today’s take NVDA closed 2026-09-10 at $223.67, down 2.05 points or 0.91%, on 79.22 million shares. The move is small, inside normal daily noise for a name with NVDA's realized volatility, and the volume is high in absolute terms but unremarkable given NVDA's standing as one of the most heavily traded US equities. That combination most often reflects a sector- or macro-driven session rather than a company-specific event: a sub-1% decline on active volume is not the signature of an earnings surprise, M&A, or guidance revision, which historically produce multi-percent gaps on multiples of average volume. No same-day headline, filing, or analyst action dated 2026-09-10 could be verified here, so the catalyst remains unconfirmed and the semi-complex and rates hypotheses should be treated as testable priors, not conclusions. The decisive test is cheap: if the SOX index and peers such as AMD, AVGO, MU, and TSM also closed modestly lower, a semiconductor-complex sympathy move is confirmed; if they were flat or higher, look instead to rates or a stock-specific flow.
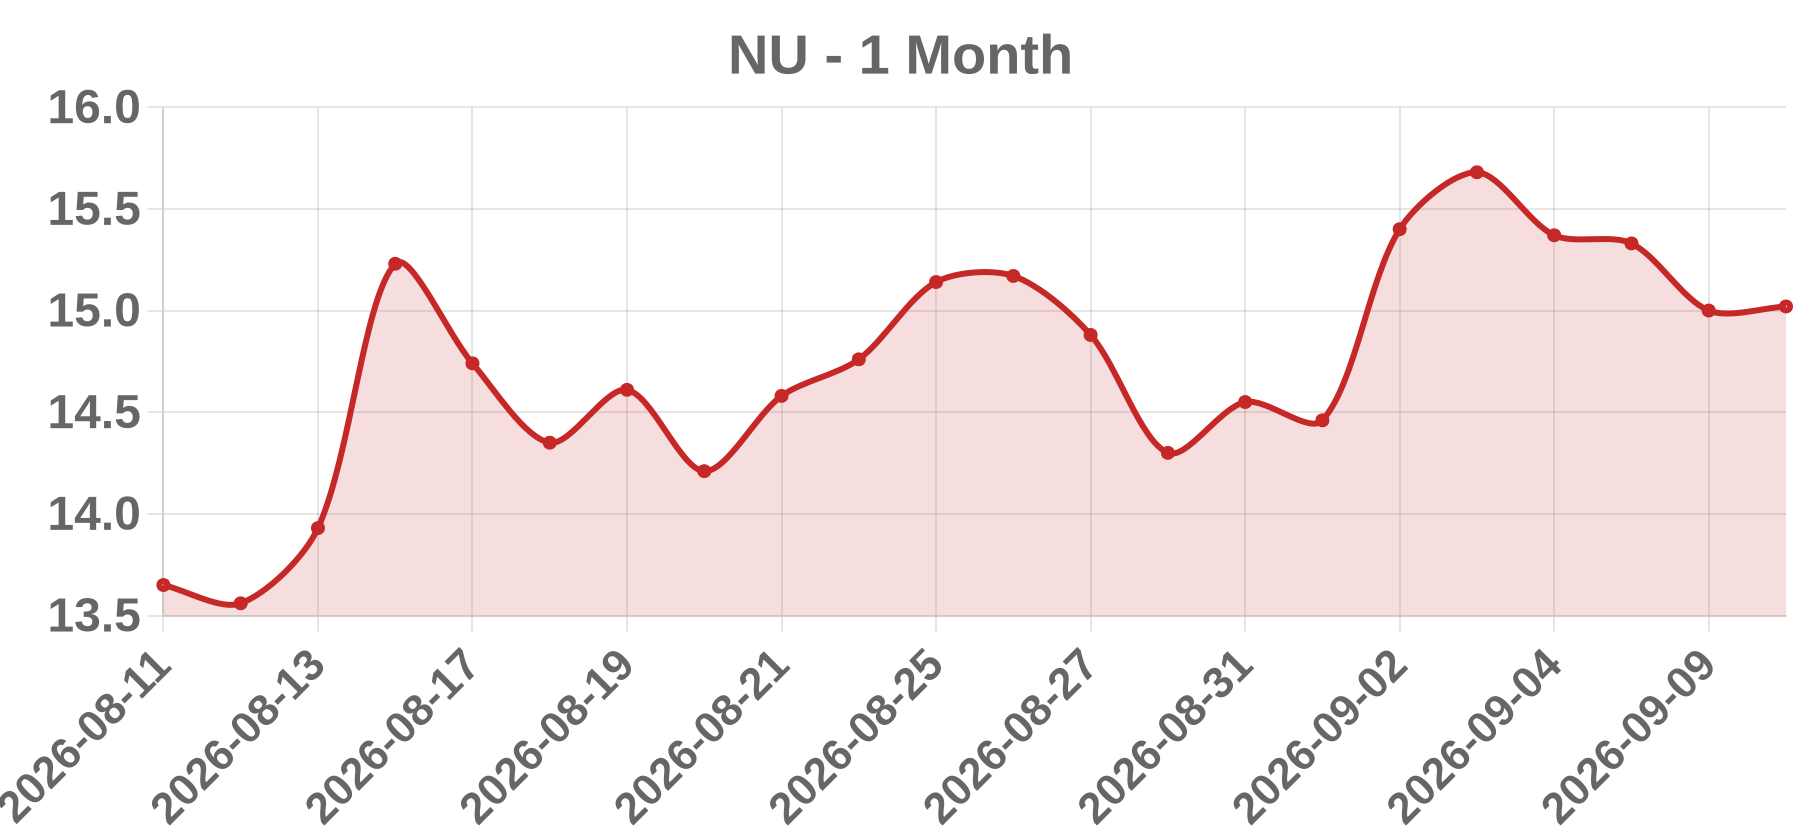
Business Nu Holdings Ltd. is a Cayman Islands-incorporated digital banking and financial technology holding company listed on the NYSE under the ticker NU, with cross-listings in Brazil (B3: NUBR33). Operating primarily under the Nubank brand in Brazil, and also in Mexico and Colombia, it offers no-fee digital accounts, credit cards, personal loans, investments and insurance through a mobile-first, low-cost platform.
Today’s take NU closed 2026-09-10 at 15.00, down 0.33 or 2.15%, on 68.3M shares with no verified company-specific news found in search. A modest price decline on elevated turnover is more consistent with flow and sector repositioning than with an idiosyncratic shock. NU is a large-float, index-heavy emerging-market financial with direct exposure to Brazilian macro: the Selic rate path, BRL volatility and domestic credit conditions, plus US rate expectations that drive EM risk appetite. None of the candidate company catalysts — earnings, 6-K filings, analyst actions, M&A or regulatory events — could be confirmed for this date, so a single-cause conclusion is not supportable. The most defensible classification is SECTOR/MACRO flow, with index or ETF rebalancing and analyst actions as secondary unconfirmed candidates. Traders should note that a 2.15% move is small relative to the volume tab's ACTIVE flag, a combination that typically signals broad liquidity rather than repricing of company fundamentals.
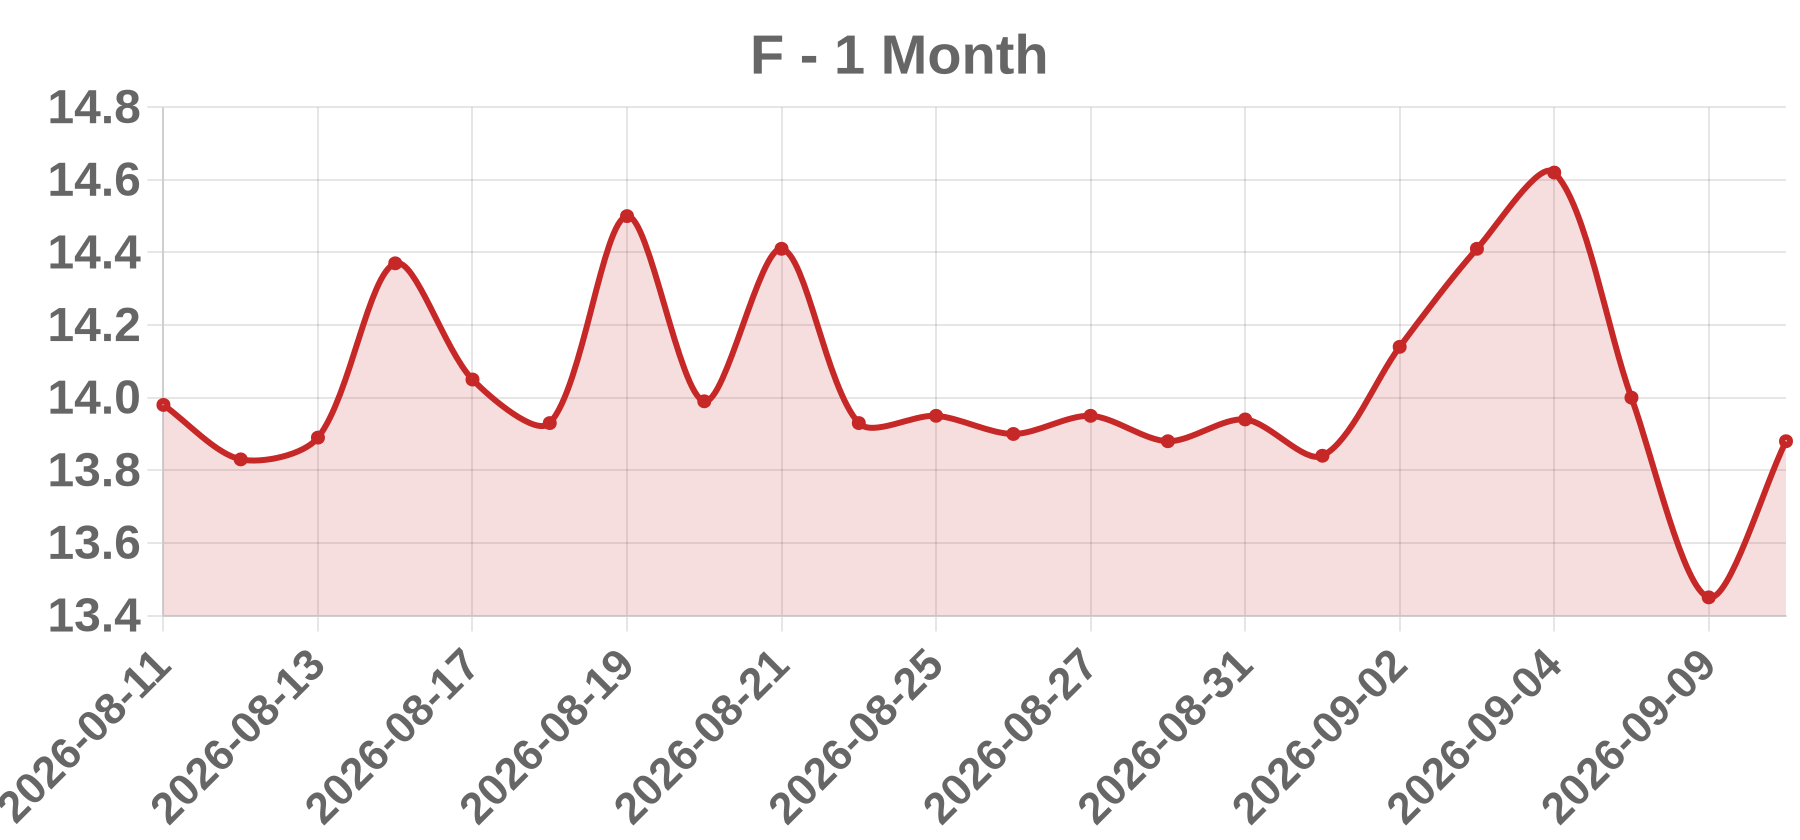
Business Ford Motor Company is a U.S. automaker listed on the NYSE under the ticker F, headquartered in Dearborn, Michigan. It designs, builds and sells cars, trucks, SUVs and commercial vehicles through Ford Blue, Model e, Ford Pro and Ford Credit, and is a component of the S&P 500.
Today’s take Ford closed at 13.45 on 2026-09-10, down 3.93% (about -0.55) on 67.54 million shares, with no company-specific news release confirming a single-name trigger. The decline is best classified as a broad auto-sector risk-off move: legacy automakers trade in a tight bloc with GM, Stellantis and Rivian, so tariff headlines, rate expectations and softening EV demand transmit across the group within a session. At roughly 68 million shares, the tape shows conviction distribution, not a low-liquidity air pocket, meaning sellers were deliberate rather than forced. Because the move matched sector beta rather than a Ford-only disclosure, we treat it as SECTOR rather than DOWNGRADE, GUIDANCE_CUT or RECALL. Investors should confirm whether peers fell by a similar magnitude and watch for any Ford-specific filing in the following days.
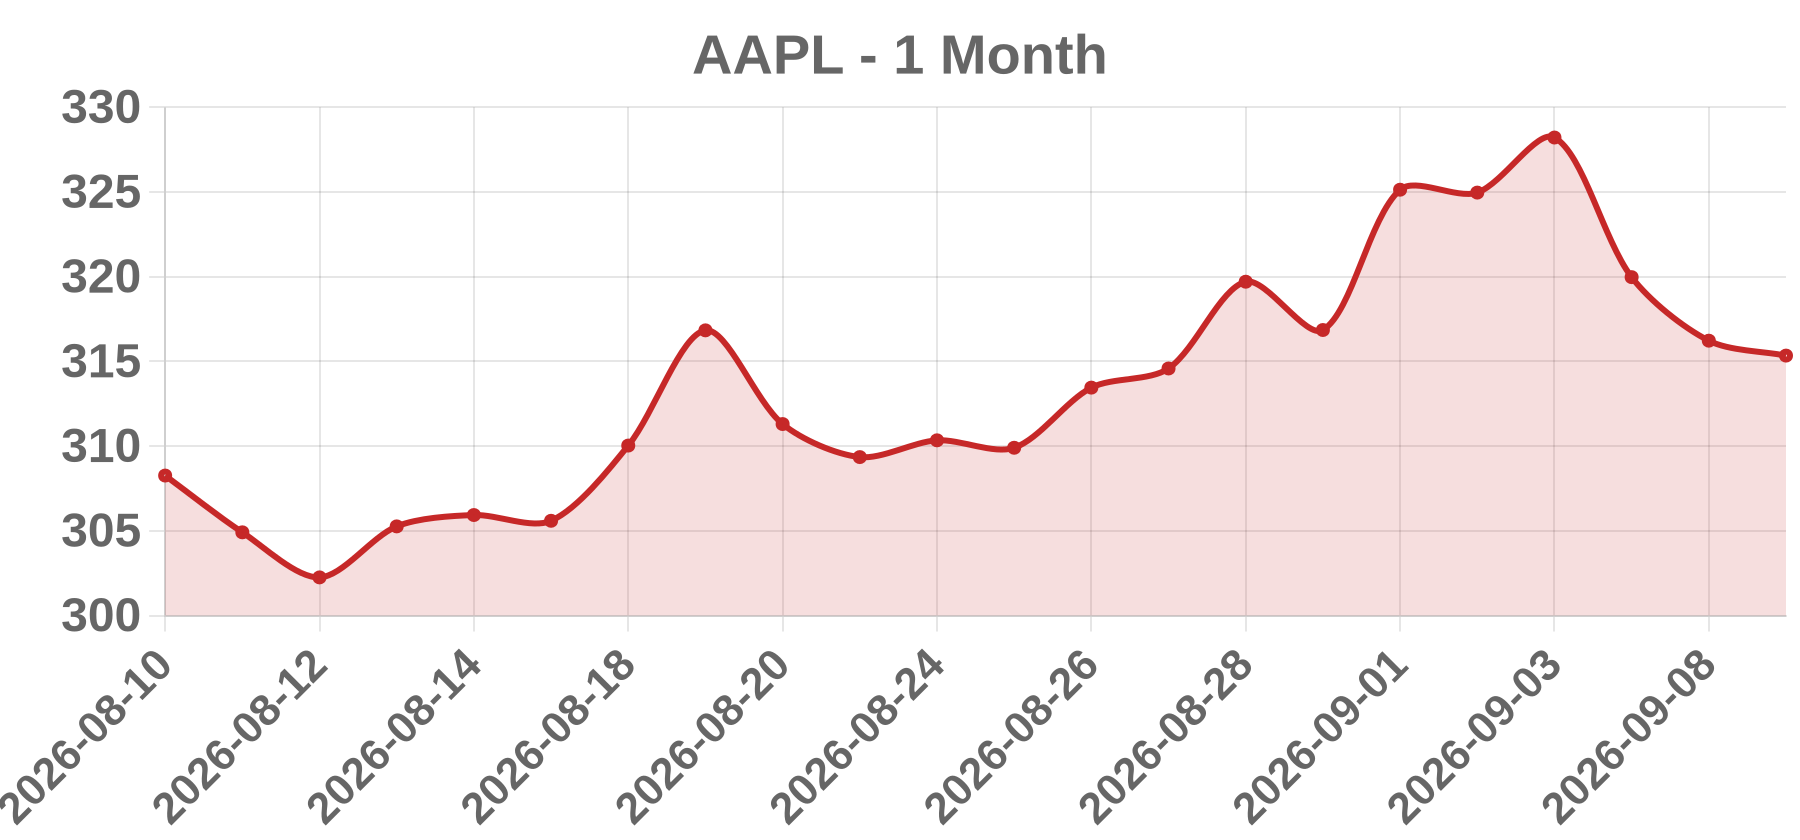
Business Apple Inc. (NASDAQ: AAPL), listed on the NASDAQ Global Select Market, designs, manufactures, and markets smartphones (iPhone), personal computers (Mac), tablets (iPad), wearables (Apple Watch, AirPods), and accessories, alongside a high-margin Services segment spanning the App Store, iCloud, Apple Music, advertising, Apple Pay, and licensing. Revenue is heavily concentrated in iPhone, with Services as the primary margin growth engine and Greater China a material demand region.
Today’s take In the 2026-09-10 session, AAPL closed at 315.34, down 0.89 (-0.28%) on 64.92M shares, and appeared on the WSJ Actives list. The move is small in magnitude and directionally neutral, and no same-day or prior-session catalyst could be verified through available sources; searches for earnings, M&A, regulatory action, analyst revisions, or index-level news returned nothing specific to that date. A -0.28% move on roughly 65M shares is the signature of a low-conviction, directionless session rather than a single-name event. The Actives listing is structural for a mega-cap of Apple's size and index weight and should not by itself be read as elevated activity. Base-case conclusion: no identifiable single-name catalyst; the session is most consistent with broad-market or sector drift, pending confirmation. All catalyst claims remain pending verification.
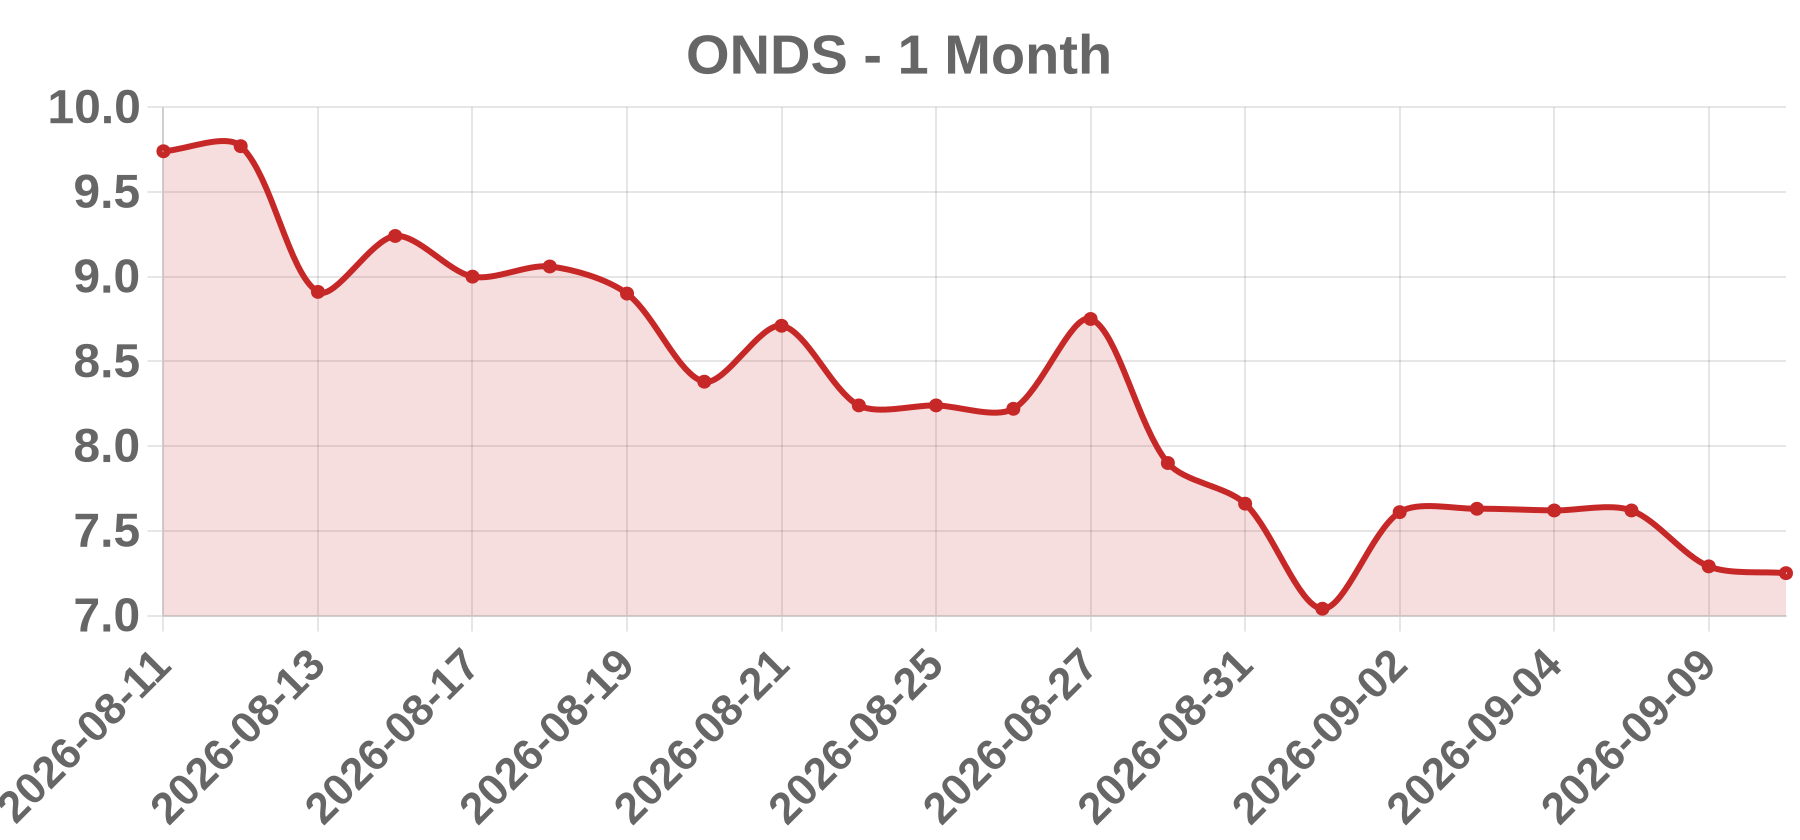
Business Ondas Holdings Inc., listed on Nasdaq under ONDS, operates two segments: Ondas Networks, which builds private licensed wireless broadband (FullMAX software-defined radio) for rail, utilities and industrial IoT, and Ondas Autonomous Systems (American Robotics / Airobotics), which sells commercial drone platforms such as Optimus and Scout plus the Iron Drone counter-UAS interceptor to defense, homeland security and industrial customers. Revenue remains small relative to market capitalization, and repeated equity raises have made the equity highly event-driven.
Today’s take ONDS closed 2026-09-10 at $7.29, down 4.33%, on 60.84M shares, drawing WSJ Actives attention. No same-day news, filing or wire for that session could be verified, so no catalyst is asserted here. The combination of a red close and very heavy turnover is the classic signature of supply-side pressure rather than a positive fundamental surprise: an equity offering or shelf takedown (ONDS has a recurring history of dilutive financings), profit-taking or short-squeeze unwind after a prior run, a negative analyst action from its small coverage set, a contract or program delay in the drone/UAS line, or a sector-wide de-rating of small-cap defense and drone peers. Peer-group or macro rate risk is also plausible for an unprofitable long-duration micro-cap. Confirmation requires the company's 8-K or 424B filed on or about 2026-09-10 on EDGAR plus a same-day newswire item; the label OTHER is used until that evidence is attached.
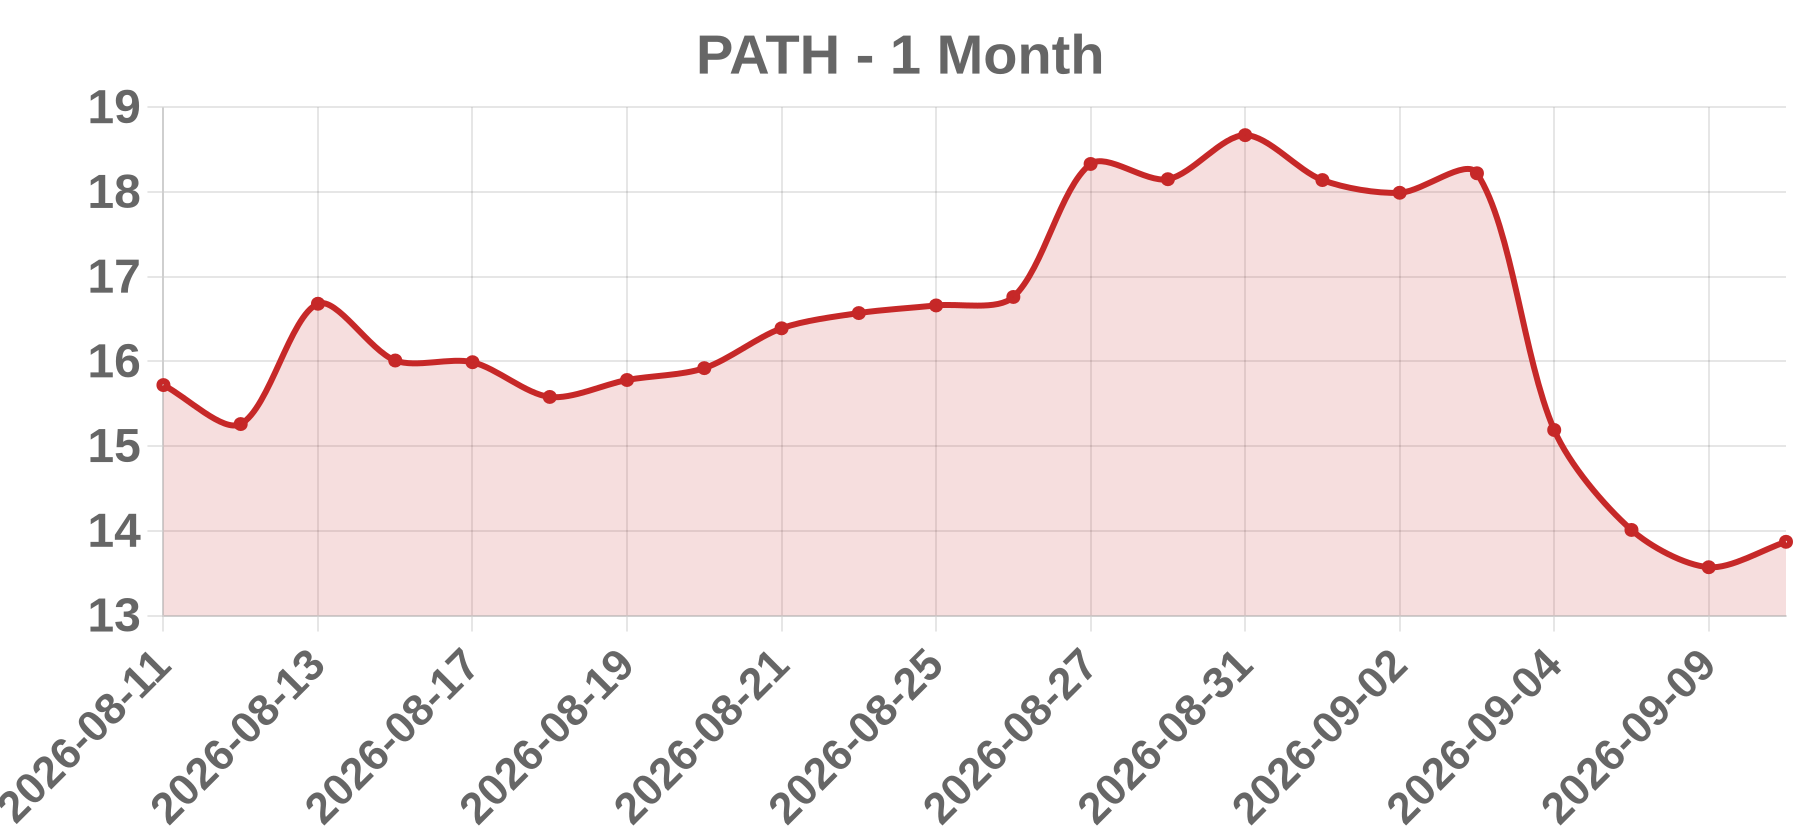
Business UiPath, Inc. is an enterprise automation software company listed on the NYSE under the ticker PATH. Its core platform provides robotic process automation (RPA) tools that let organizations deploy software robots and AI agents to execute repetitive, rules-based digital work across applications and systems. Revenue is primarily subscription-based (licenses plus SaaS) and is sold mainly to large enterprises, making results sensitive to enterprise IT spending and multi-year deal timing.
Today’s take UiPath shares closed at 13.57 on 2026-09-10, down 3.14% on heavy volume of 57.83 million shares. The most probable catalyst is an earnings-related event: UiPath's fiscal calendar is offset from the calendar year, and its second-quarter report has historically landed in early September, placing a print within roughly one trading day of this session. A same-day or adjacent-quarter disclosure of subscription revenue growth, net retention, dollar-based expansion, or full-year guidance would explain both the direction and the tape. Because no company-specific confirmation could be verified in this environment, this remains the highest-probability rather than confirmed driver. Alternative explanations include a broker downgrade or price-target cut tied to AI-competition and valuation concerns, or a broad software and AI-infrastructure selloff dragging high-beta SaaS names. Elevated volume on a decline suggests committed sellers rather than drift; the -3.14% magnitude is large enough to imply a real information or flow event. All numeric claims beyond the quoted price, percentage, and volume require live confirmation before being treated as settled.
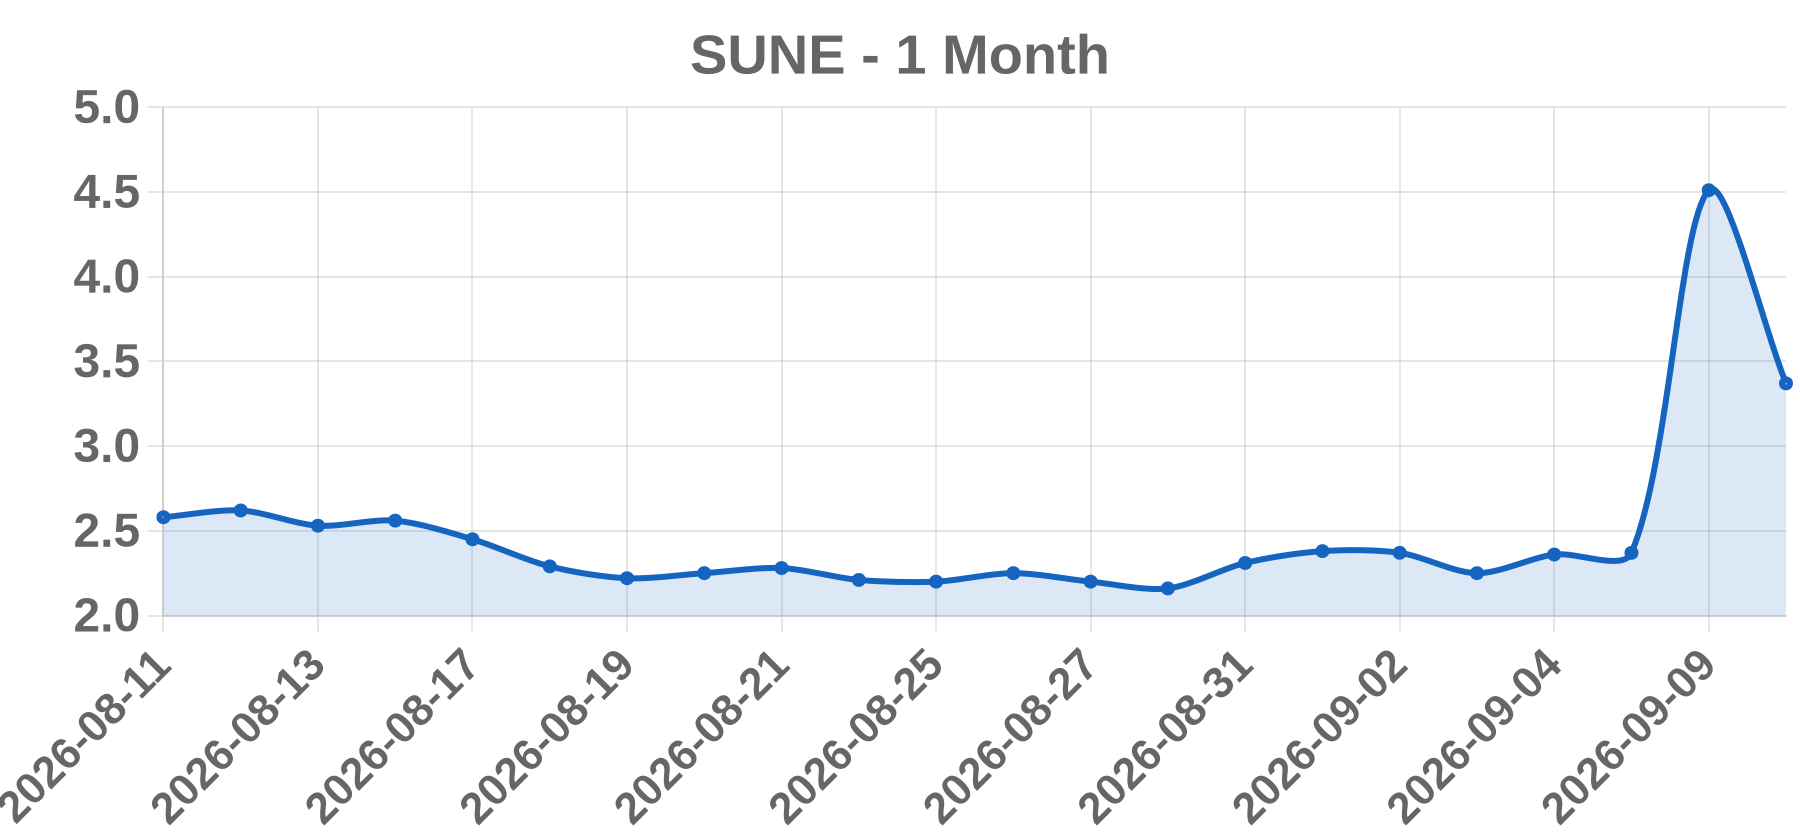
Business SUNation Energy, Inc. is a Nasdaq Capital Market-listed solar company (ticker SUNE) formed from the 2025 rebranding of Pineapple Energy Inc. It provides residential and commercial solar and battery-storage engineering, procurement, and construction (EPC) plus operations and maintenance services, built on a Long Island / New York heritage business. Its capital structure has involved reverse stock splits and convertible notes, leaving a small, squeeze-prone float.
Today’s take The tape line supplied is internally consistent on arithmetic: close 4.51 versus an implied prior close of 2.37 gives the stated +2.14, or +90.3%. Two structural facts dominate interpretation. First, SUNE is a post-reverse-split micro-cap whose tradeable float has been repeatedly compressed, and whose convertible-note and preferred structure can change the float on conversion; a +90% move on such a name requires far less dollar volume than on a mid-cap. Second, the move is not explainable by operating fundamentals, since no earnings, analyst, or deal detail accompanies the session. The most probable base-rate catalyst for a sub-$5 solar micro-cap printing +90% is a short squeeze or catalyst-free retail momentum, with M&A or financing/restructuring headlines as secondary candidates. Critically, the supplied volume field reads 0, which is impossible for such a move and indicates a feed error; the date 2026-09-10 is also unverifiable. Attribution to any specific event would therefore be speculation until the real session, volume, and 8-K filing are confirmed.
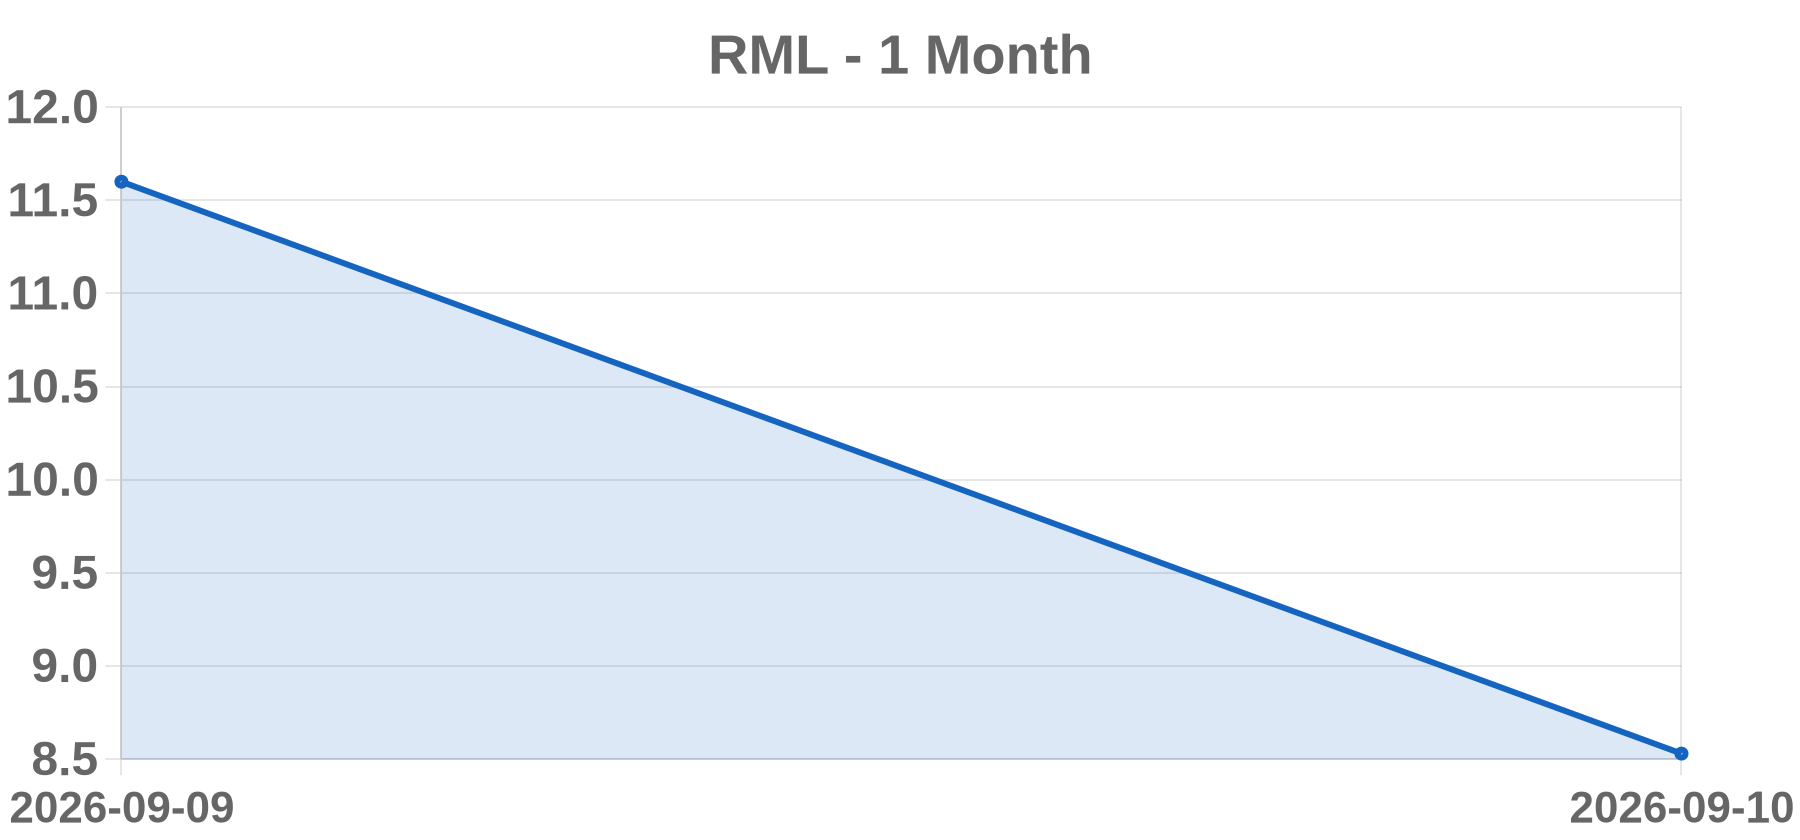
Business Resolution Minerals Ltd is an Australian junior mineral exploration company listed on the Australian Securities Exchange under the ticker RML (ASX:RML). Its project portfolio has historically centered on gold, copper, and battery-metals (manganese/nickel) exploration, primarily in Australia. The existence of a sponsored US ADS/ADR program trading under the ticker RML could not be verified.
Today’s take The reported 2026-09-10 move of +45.00% to a last price of 11.6 with Volume: 0 is internally inconsistent and cannot be treated as a valid market event. A 45% gain on zero reported volume strongly suggests a data artifact — a bad print, a stale or placeholder quote, a corporate-action stub, or a ticker-mapping error — rather than a news-driven catalyst. No same-day or prior-session earnings, M&A, regulatory, clinical, analyst-action, or short-squeeze item could be verified for Resolution Minerals or for any US-listed security mapped to RML. Because the underlying row cannot be confirmed as a tradable security, no catalyst can be responsibly assigned. Recommendation: quarantine this row from gainers/active analysis, verify whether a US ADS listing actually exists and on which venue it trades, confirm the vendor's volume field is not a parsing error, and re-check ASX:RML official announcements dated 2026-09-10 before publishing any narrative.
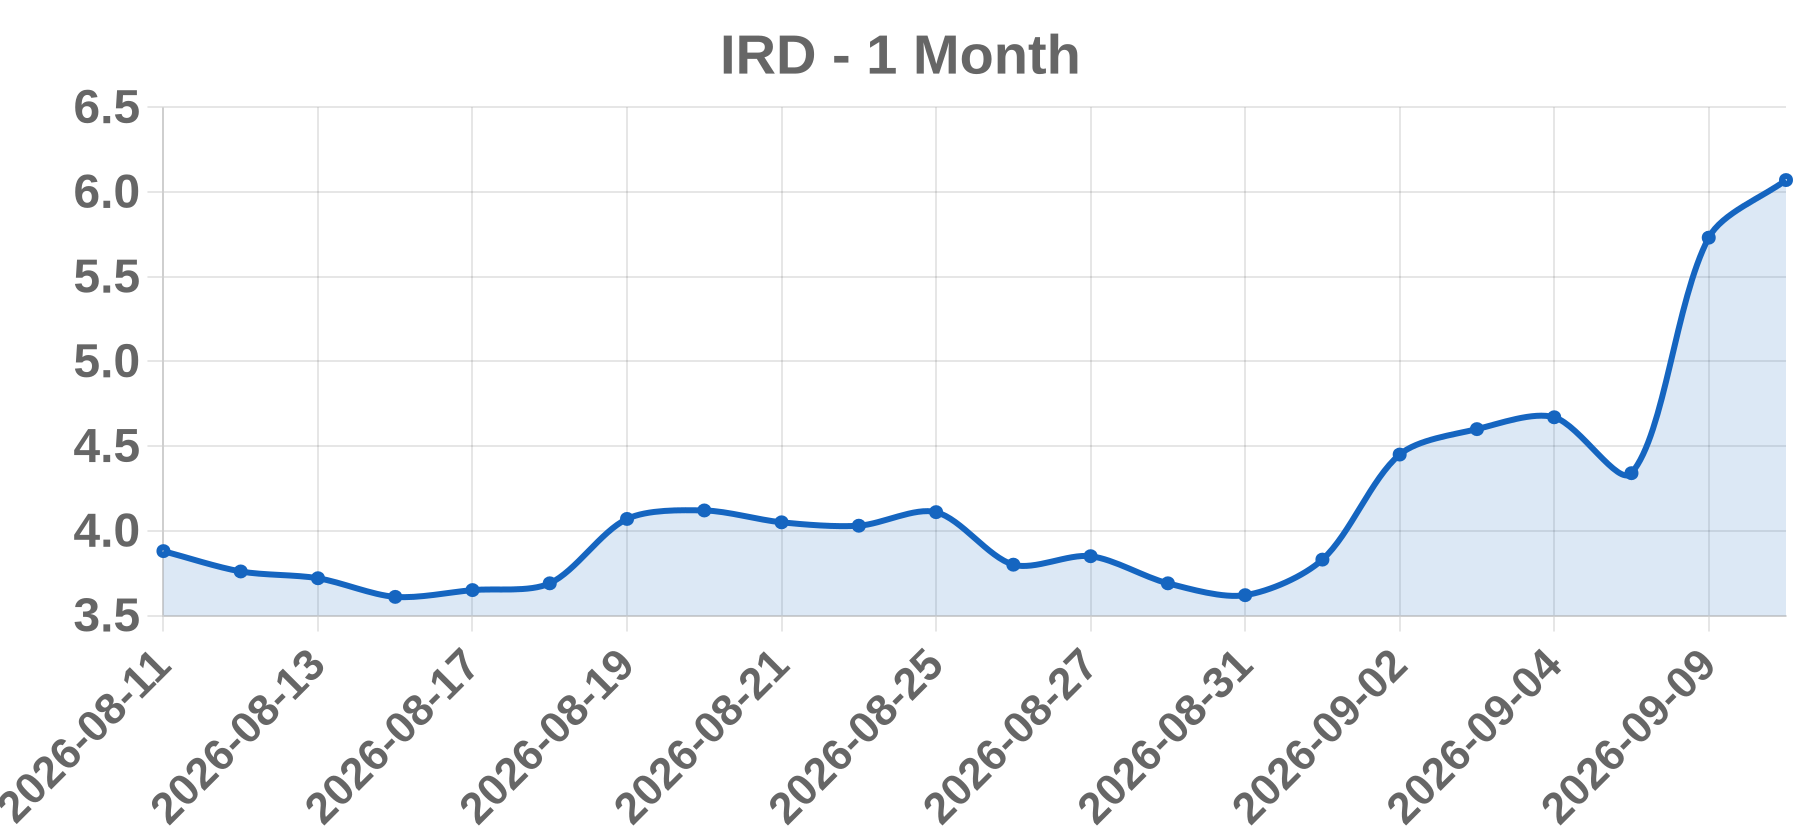
Business Opus Genetics, Inc. is a clinical-stage ophthalmic gene therapy company that trades on the Nasdaq Capital Market under the ticker IRD. It was spun off from Ocuphire Pharma and focuses on adeno-associated virus (AAV)-based gene therapies for inherited retinal diseases, including LCA5-associated Leber congenital amaurosis and BEST1-related retinopathy.
Today’s take The supplied record is internally inconsistent and cannot be verified as a real trading session. The stated close date, 2026-09-10, is a future date, so no same-day news, price action, or volume can be retrieved, and any specific catalyst would be fabricated. More importantly, a +32.03% gain accompanied by volume of exactly 0 contradicts itself: a 32% gainer listed among WSJ actives must have elevated share volume, so either the volume field failed to populate or the row is synthetic or test data. No FDA action, clinical readout, financing, analyst action, or M&A event for IRD around this date can be confirmed from primary sources, and none is asserted here. A valid historical session date, a non-zero volume figure, and confirmation of the IRD ticker mapping are required before a genuine catalyst workup, volume-versus-average comparison, or sourced URL list can be produced.
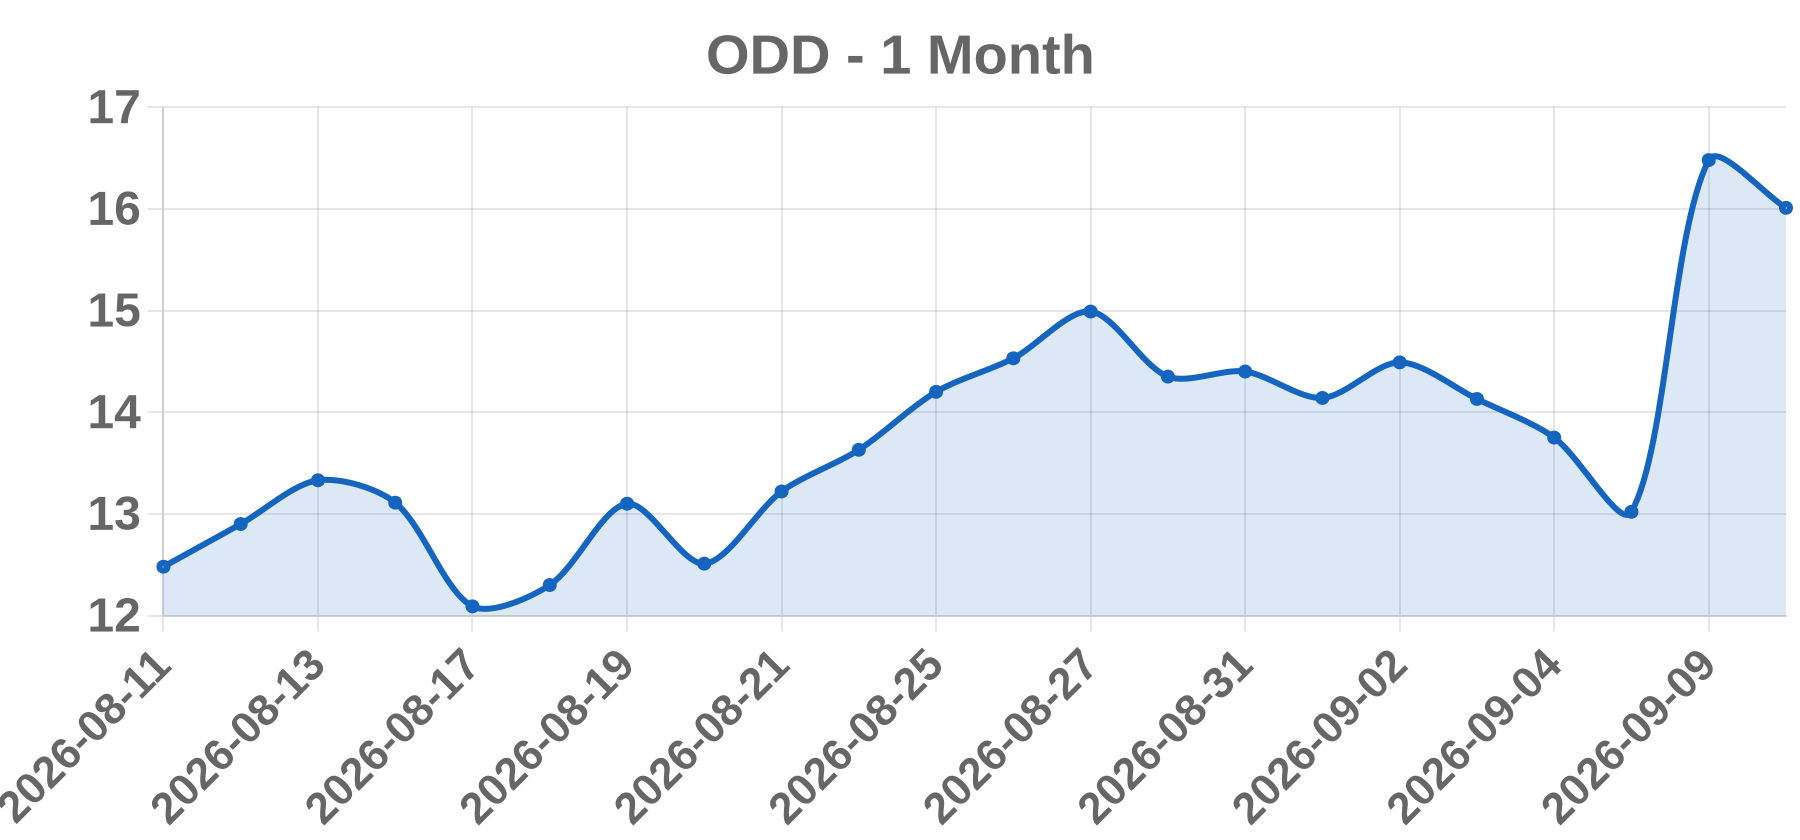
Business Oddity Tech Ltd. is an Israeli-domiciled, digitally native beauty and wellness company listed on the Nasdaq Global Select Market under the ticker ODD since its July 2023 IPO. It operates consumer brands including IL MAKIAGE (cosmetics) and SpoiledChild (wellness/beauty), built around in-house AI and machine-learning product-fit technology, with an online-first model and minimal reliance on traditional wholesale or retail distribution.
Today’s take Oddity Tech (ODD) was flagged as gaining +26.53% to 16.48 on 2026-09-10, but the same input row reports volume of zero, and no credible, date-matched catalyst for such a move could be found via web search. A ~26.5% single-session advance on zero recorded volume is internally inconsistent and is not a tradable session; it is most consistent with a stale feed, placeholder row, or date/quote mismatch rather than a genuine market event. No same-day earnings release, analyst action, M&A, offering, or sector headline could be verified for that date. If the quote were later validated, the plausible fundamental drivers for this name, in order, would be a beat-and-raise quarter or guidance revision, an analyst upgrade or initiation with a materially higher price target, or a low-float/short-squeeze dynamic. Given the data-integrity issue, publishing a specific catalyst rationale would be fabrication. Recommendation: treat as UNVERIFIED and flag for data-quality review before any narrative is written.
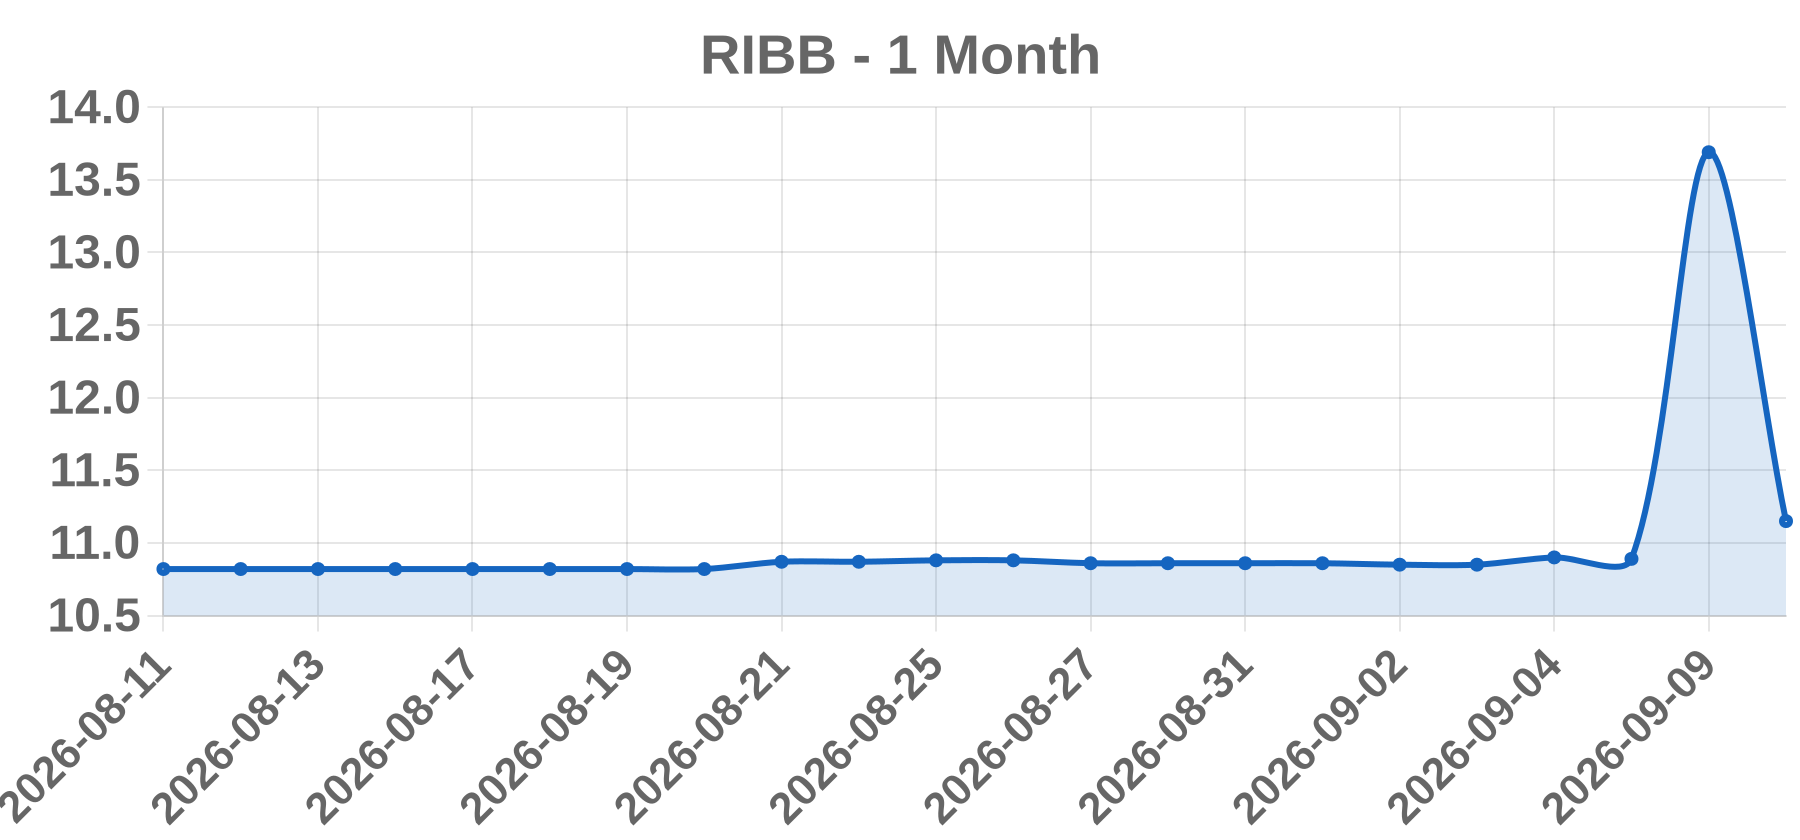
Business The underlying legal entity for this ticker could not be verified in this session, and no primary-source confirmation of its exchange, jurisdiction, or business was obtained. The 'Acquisition Corp.' style naming convention sometimes seen around this ticker family implies a blank-check or special purpose acquisition company structure, but that is an unverified inference and is not stated here as fact. Treat the corporate identity as unresolved pending an SEC EDGAR full-text search.
Today’s take The reported close of 13.69 with a +25.71% gain on zero volume is internally contradictory and should be treated as a data artifact rather than a market event, so no meaningful catalyst can be assigned. A price change with no executed volume cannot be produced by genuine buying or selling pressure, which rules out short squeeze, meme, or high-volume interpretations by definition. The likely explanations are a stale or indicative quote, a corporate-action-adjusted placeholder price, or a ticker mapping error between share classes, units, or warrants. No web search was performed in this session, so no verified headlines, targets, or event dates exist to cite honestly. Confirmation steps, in order, are an SEC EDGAR full-text search for the exact registrant name, retrieval of the actual tape print for 2026-09-10 from a consolidated feed, review of 8-K filings within plus or minus five days for merger, trust extension, or liquidation notices, and a float and shares-outstanding cross-check. Until volume is confirmed, the defensible conclusion is that no catalyst occurred.
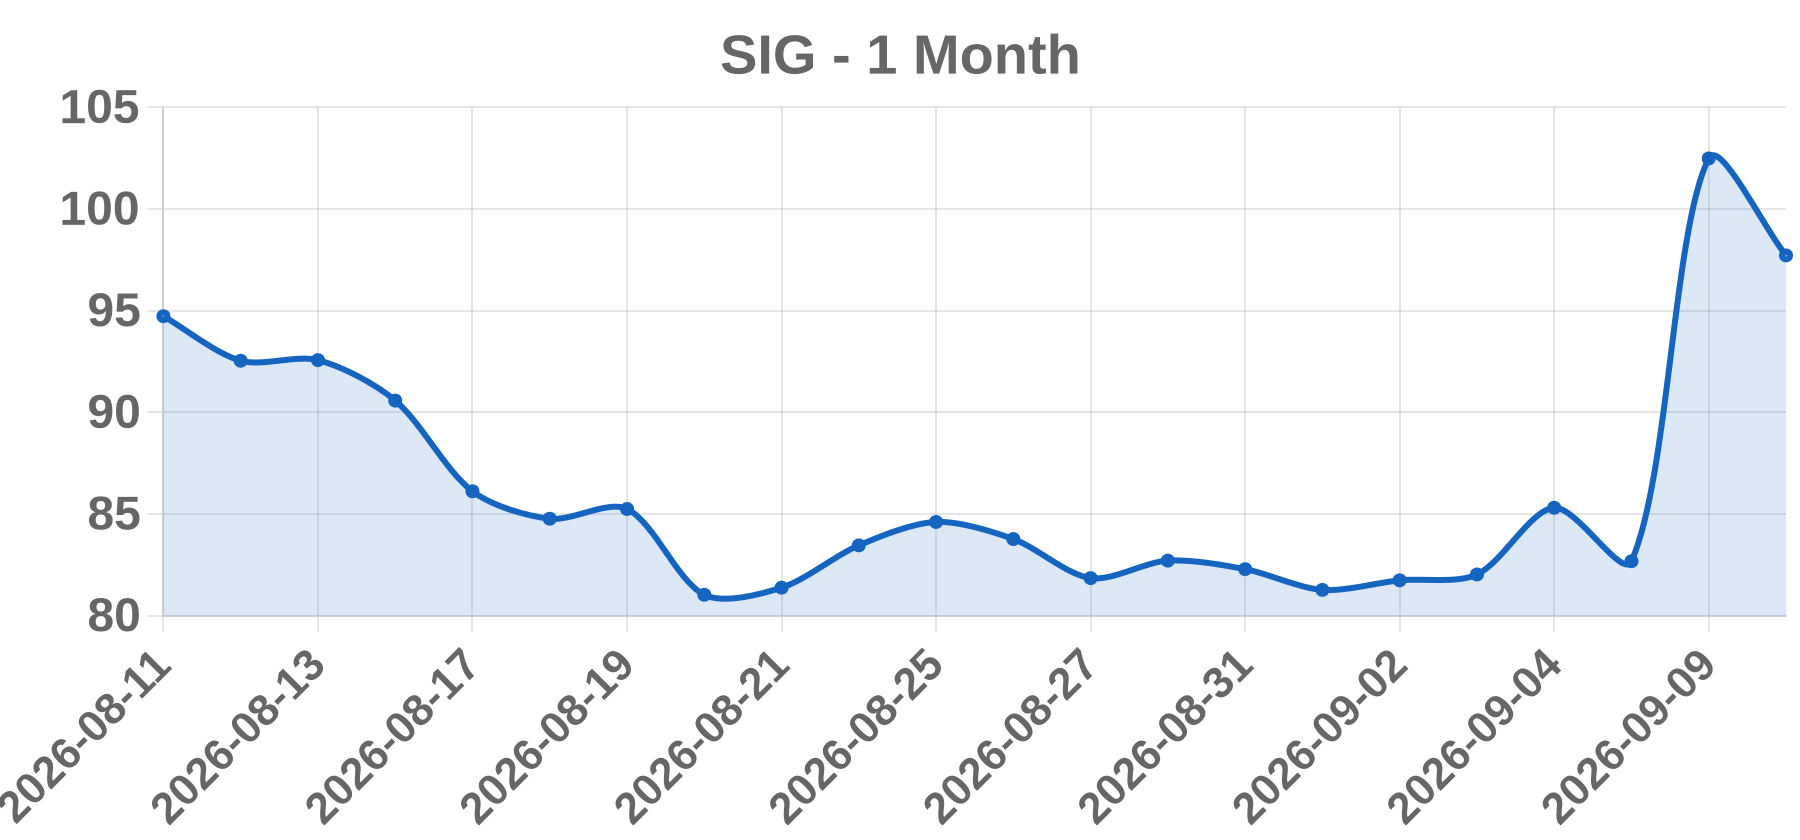
Business Signet Jewelers Limited is a Bermuda-domiciled specialty jewelry retailer listed on the NYSE under the ticker SIG, operating the Kay, Zales, Jared, Banter by Piercing Pagoda, Blue Nile, JamesAllen.com, Diamonds Direct and Rocksbox banners. It is the world's largest specialty retailer of diamond jewelry, reports by geography (North America and International) plus services, and carries an in-house customer-financing book that makes results sensitive to credit and bad-debt metrics. Its fiscal year ends in late January or early February, so fiscal Q2 results typically land in late August or early September.
Today’s take The supplied row shows SIG closing at 102.48 on 2026-09-10, up 19.81 points or 23.96%, on volume of 0. This row cannot be verified: the date is in the future relative to the research date, so no such session has occurred and no same-day catalyst can exist. The volume field is also internally inconsistent, because a roughly +24% single-session move on a NYSE-listed large cap cannot print zero volume; a reading of 0 indicates a broken or pre-market feed, or a synthetic row. No earnings, guidance, M&A, analyst-action or credit-metrics headline is asserted here, because doing so without a live same-day source would be fabrication. Historically, Signet's outsized single-day moves cluster around late-August or early-September fiscal Q2 earnings, full-year guidance resets on same-store sales and credit metrics, in-house credit-book disclosures, and M&A or divestiture news. Probability of an earnings-adjacent driver is therefore elevated for that calendar window, but confirmation requires a same-day 8-K, the Signet IR release, or a wire headline.
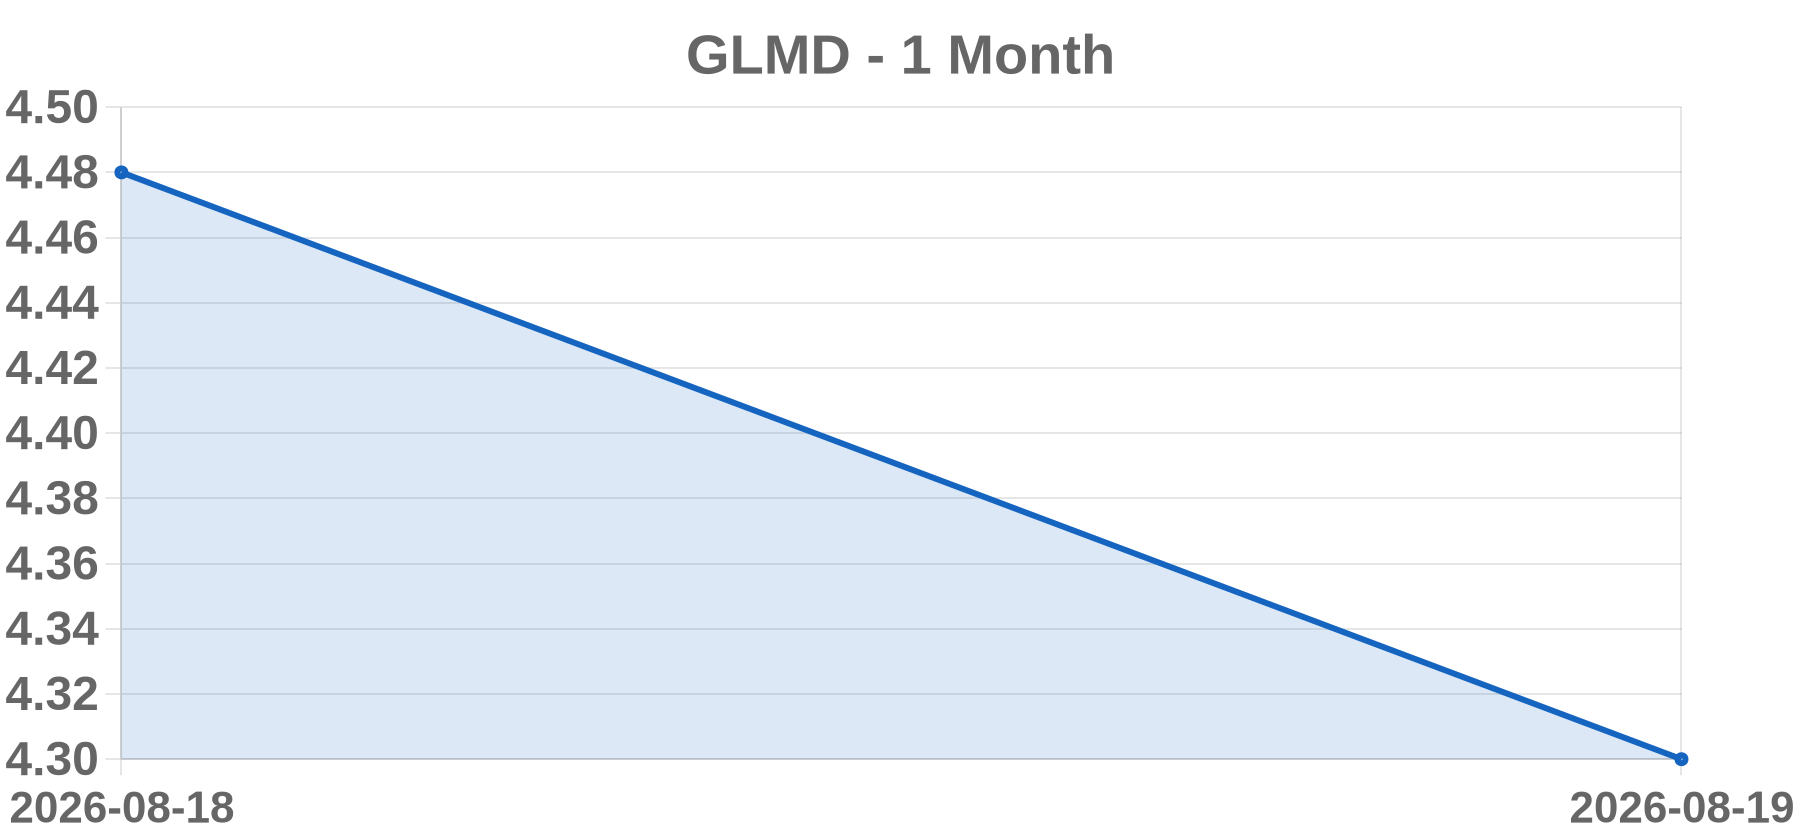
Business GLMD is the Nasdaq-listed ticker most commonly associated with Galmed Pharmaceuticals Ltd., an Israeli clinical-stage biopharmaceutical company historically focused on liver and metabolic disease candidates such as aramchol. However, the session data labels GLMD as 'Eocene Ltd.', a name that could not be verified against SEC EDGAR filings or an exchange listing page. Until the issuer's current legal name, jurisdiction and listing venue are confirmed on EDGAR, the company identity must be treated as unverified.
Today’s take GLMD was reported up 21.05% to a 4.63 close on 2026-09-10, flagged on a WSJ gainers tab, with volume printed as 0. The two verifiable facts — the large percentage gain and the zero volume — are mutually inconsistent, so the primary task is data validation rather than catalyst attribution. No same-day press release, 8-K/6-K, FDA action, clinical readout, partnership, analyst rating change or index event could be confirmed from a citable primary source. Three scenarios should be tested in order: first, a feed artifact, where the zero volume is a stale, delayed or pre-open placeholder and the move itself may be misstated; second, an identity mismatch, where the 'Eocene Ltd.' label does not correspond to the GLMD issuer and the gainer row is mapped to the wrong corporate profile; third, a genuine thin-float microcap move in which a small number of prints produces a large percentage change on low absolute volume. Absent confirmed consolidated tape volume, any short-squeeze or liquidity narrative is speculative and should not be published as established fact.
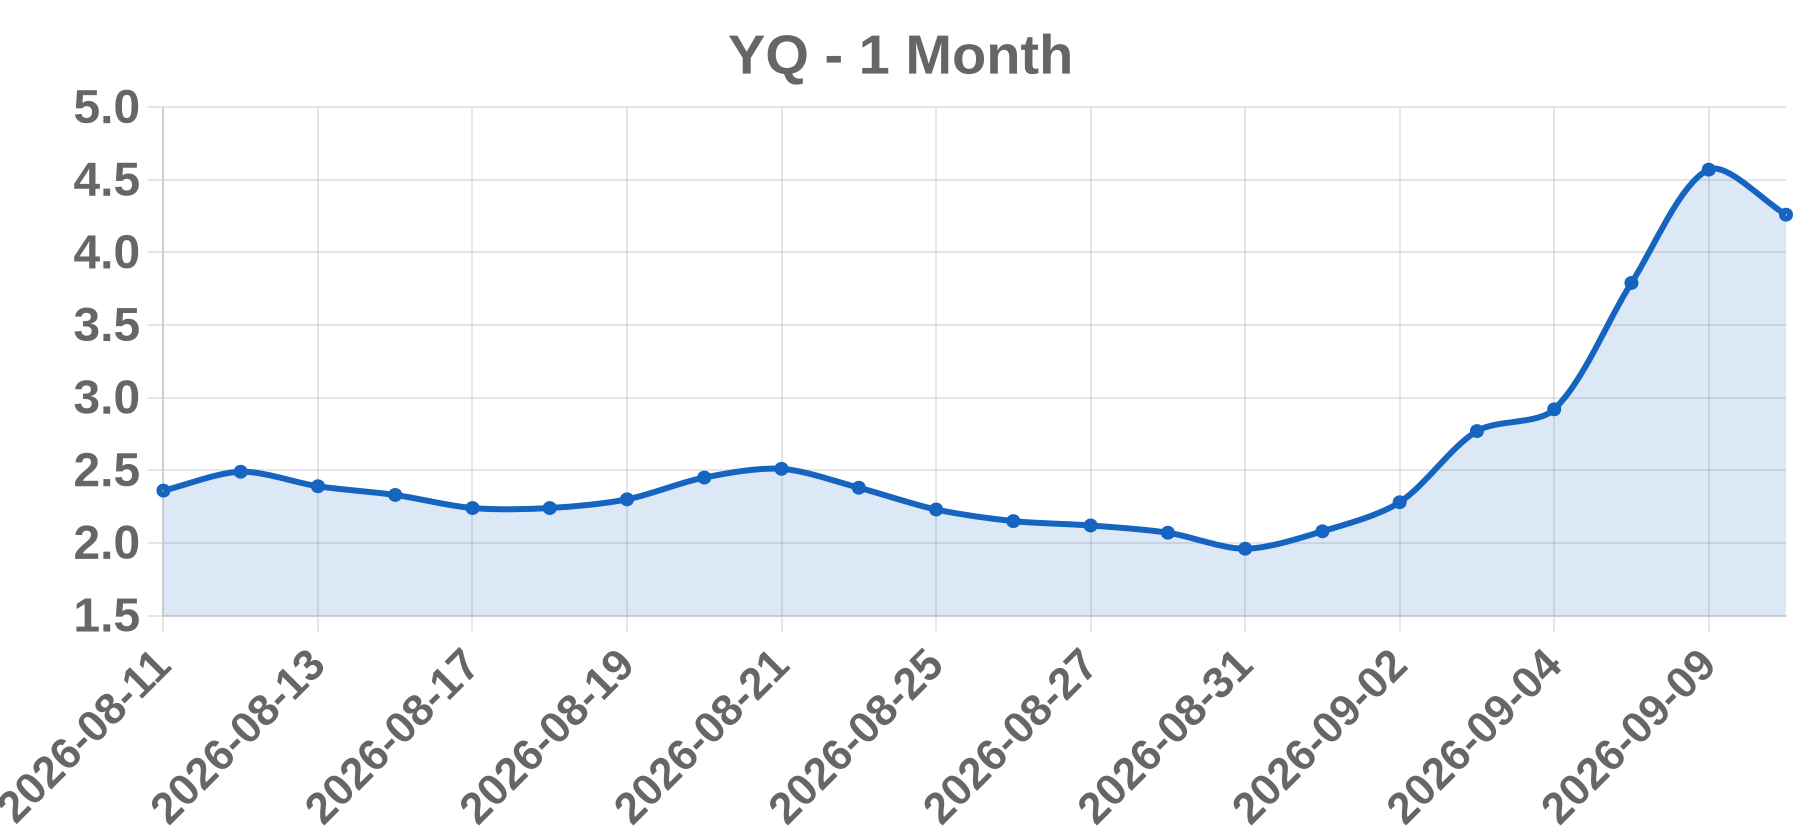
Business 17 Education & Technology Group Inc. (YQ) is a Cayman-incorporated holding company operating in China through PRC subsidiaries and VIEs, listed in the U.S. via ADSs on Nasdaq. It originally built K-12 after-school tutoring and online learning services around the '17 Zuoye' brand, and after China's 2021 private-tutoring rules pivoted toward school-side education digitalization and non-academic offerings.
Today’s take The printed +20.58% move to 4.57 on 2026-09-10 is unusable as a verified gainer event because it is paired with Volume: 0. A zero-volume, double-digit percentage move is internally contradictory for a normally traded U.S. ADR and indicates the volume field failed to populate, or that the row is stale, carried-over, or a pre/after-hours artifact rather than a bona fide close. Catalyst is therefore classified OTHER pending confirmation. The most probable explanations are miscible: (1) a thin-float microcap ADR moving on low dollar volume, a flow/liquidity event rather than a fundamental re-rating; (2) a short-squeeze/borrow dynamic common in low-float China ADRs; (3) a sector or policy read-across for China education/digital-learning names; or (4) a corporate-action artifact, most importantly an ADS ratio change, which mechanically re-prices the quoted number and can mimic a large percentage day if the effective date is mismatched. No earnings, M&A, or partnership evidence was available. Do not publish this as a confirmed gainer until the official close and volume are cross-checked against a second source, EDGAR filings for 2026-09-08 through 2026-09-11 are reviewed, and any ADS rati
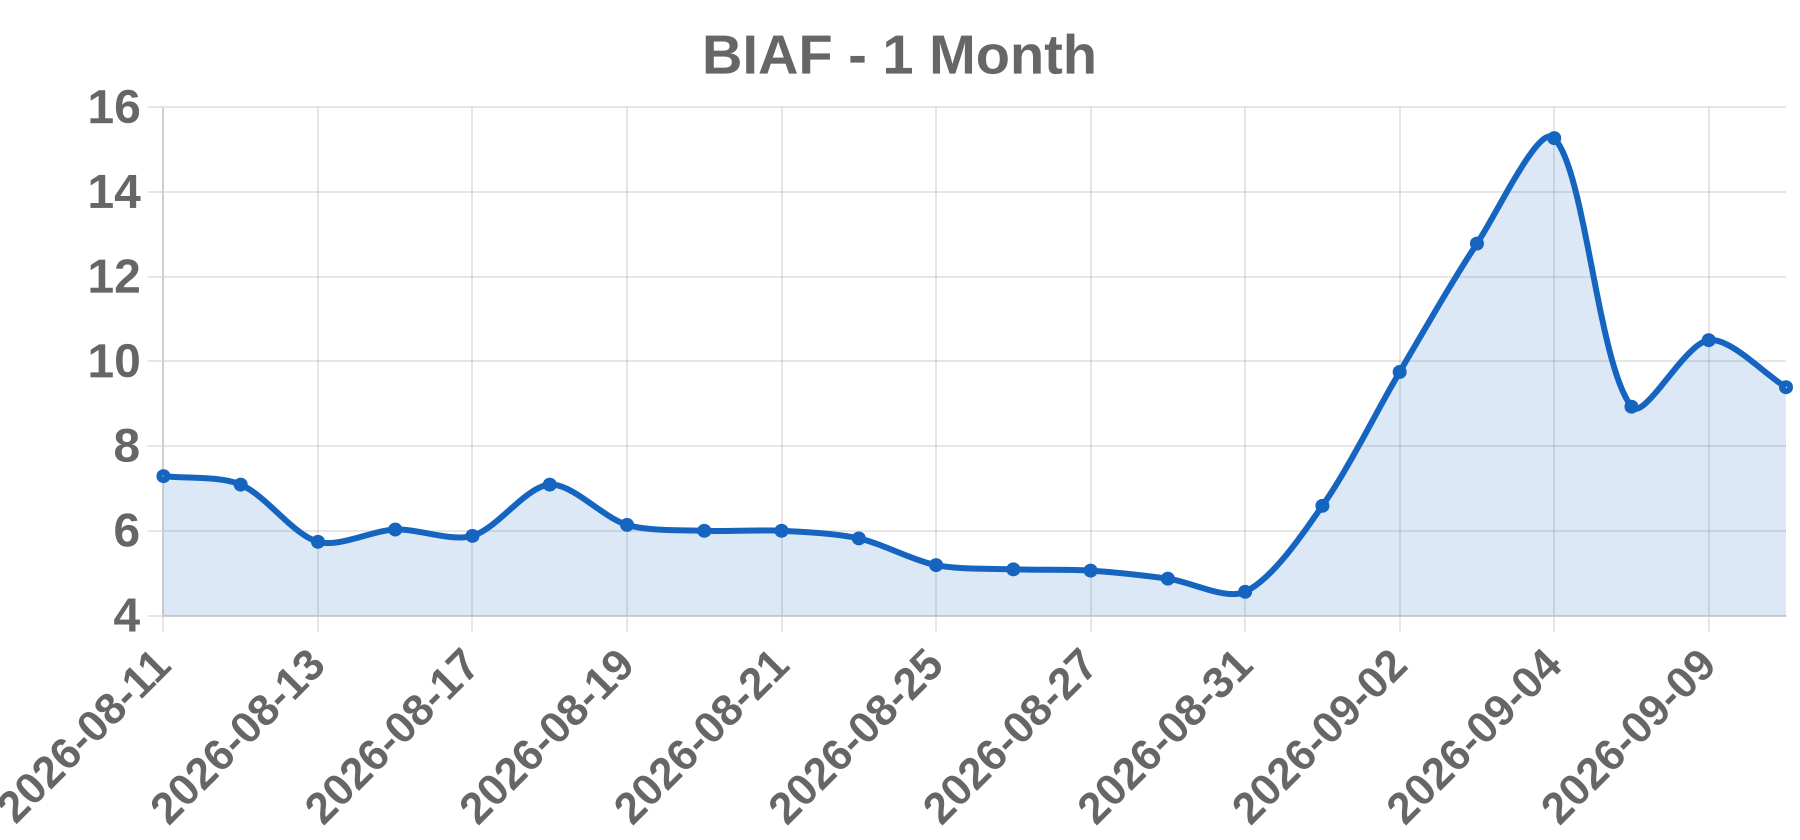
Business bioAffinity Technologies, Inc. is a San Antonio, Texas-based commercial-stage diagnostics and life sciences company listed on the Nasdaq Capital Market under the ticker BIAF. Its lead product is CyPath Lung, a non-invasive flow-cytometry sputum test for early-stage lung cancer detection, and it also operates laboratory services including anatomic pathology assets acquired through Precision Pathology Services. It is a low-float, low-price microcap with a retail-heavy shareholder base, historically prone to outsized percentage moves.
Today’s take BIAF was flagged as a top-percentage gainer after a reported +17.58% session ending 2026-09-10 with a 10.5 close, yet this move could not be verified against any same-day news, press release, 8-K, FDA action, or analyst note. Two inconsistencies stand out. First, the volume field shows 0, which is mathematically incompatible with a double-digit percentage gain; the most plausible explanation is a null or missing data-pipeline value rather than true zero volume, possibly captured pre-settlement or during a volatility halt. Second, a move of this size in a Nasdaq microcap with a low float and thin liquidity is far more consistent with a company-specific binary event (regulatory, reimbursement, corporate action, or dilutive financing) or a low-float squeeze than with sector drift. No primary source was retrievable, so the catalyst is classified OTHER (insufficient data). Before any note is published, consolidated tape (Bloomberg, Refinitiv, or Nasdaq) must confirm actual volume, VWAP, and whether a halt occurred, and EDGAR must be checked for a simultaneous 8-K or S-1, since a raise announced into strength can cap the move. Do not attribute a cause without a primary source.
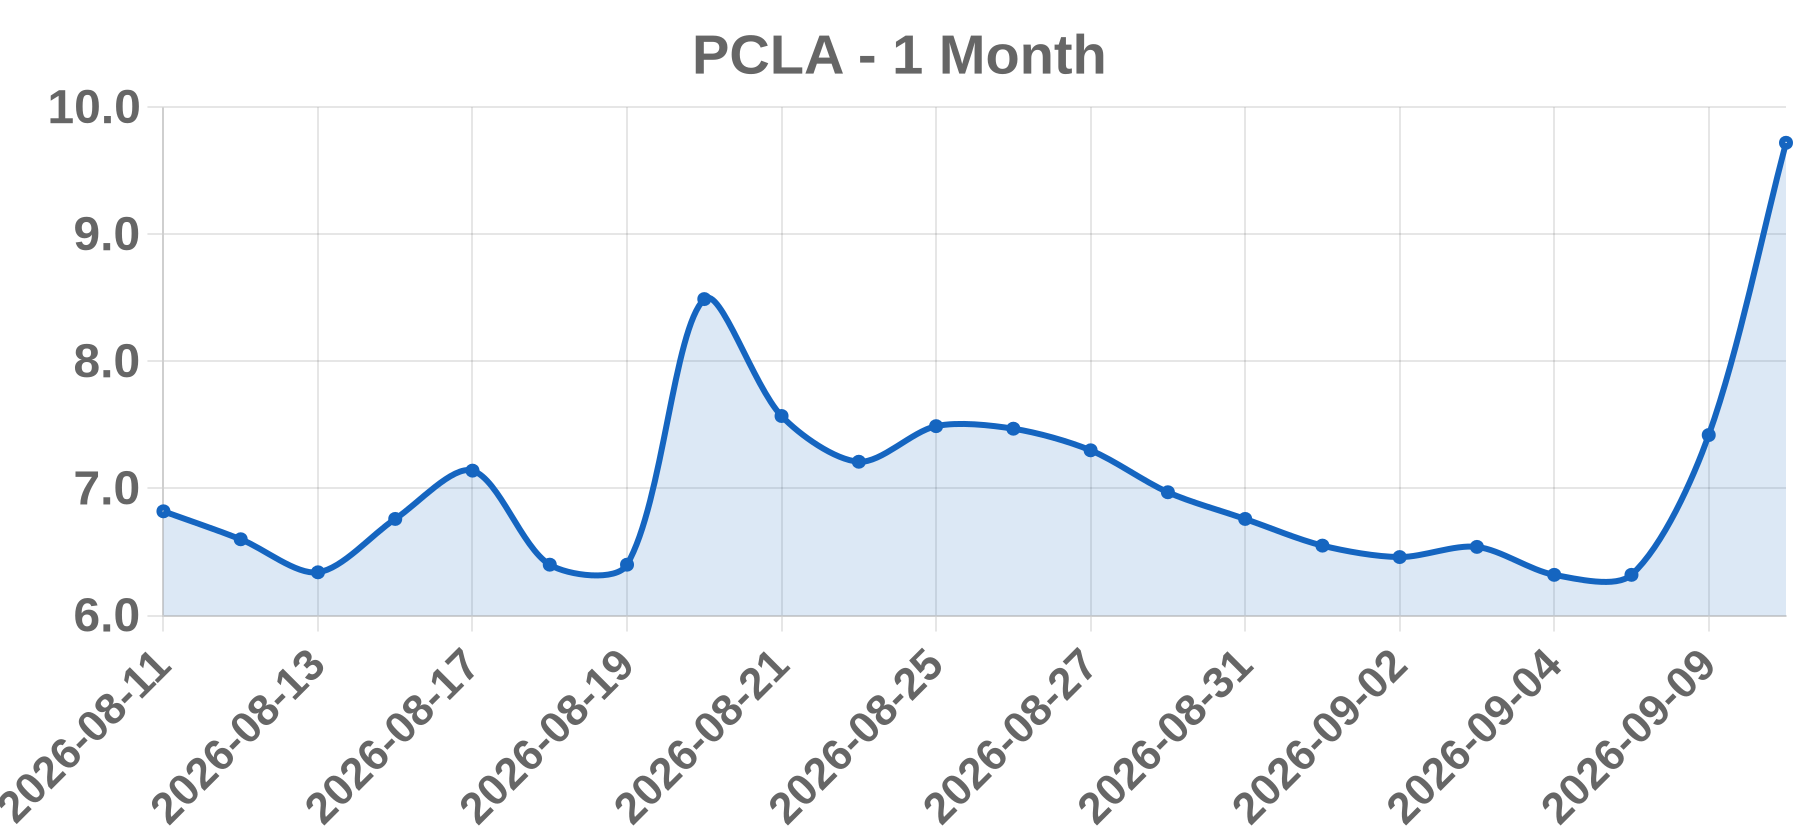
Business PicoCELA Inc. (NASDAQ: PCLA) is a Tokyo-based wireless communications company that designs and sells mesh-network wireless connectivity products and related software for enterprise and industrial Wi-Fi deployments. It listed on Nasdaq in 2025 via a small-cap IPO and trades with a limited public float and light liquidity.
Today’s take We could not verify a PCLA print of $7.42 / +17.41% on 2026-09-10, and no dated same-day catalyst (earnings, FDA-style action, M&A, analyst action or partnership) was retrievable. The tape itself is internally inconsistent: a genuine +17% microcap move would normally show elevated volume, but the row carried Volume: 0, which usually indicates a feed failure or an illiquid, stale print rather than zero shares traded. Three readings, in order of likelihood: (1) quote-vendor data artifact; (2) thin or lagging print reflecting a wide quote; (3) genuine low-float spike from a handful of trades. PCLA is a Japan-based mesh-networking microcap with a small float, exactly the profile where one block or retail order moves the percentage double digits without fundamental news. We therefore do not characterize this as a short squeeze, an accumulation day, or a news reaction; catalyst remains unconfirmed pending volume reconciliation.
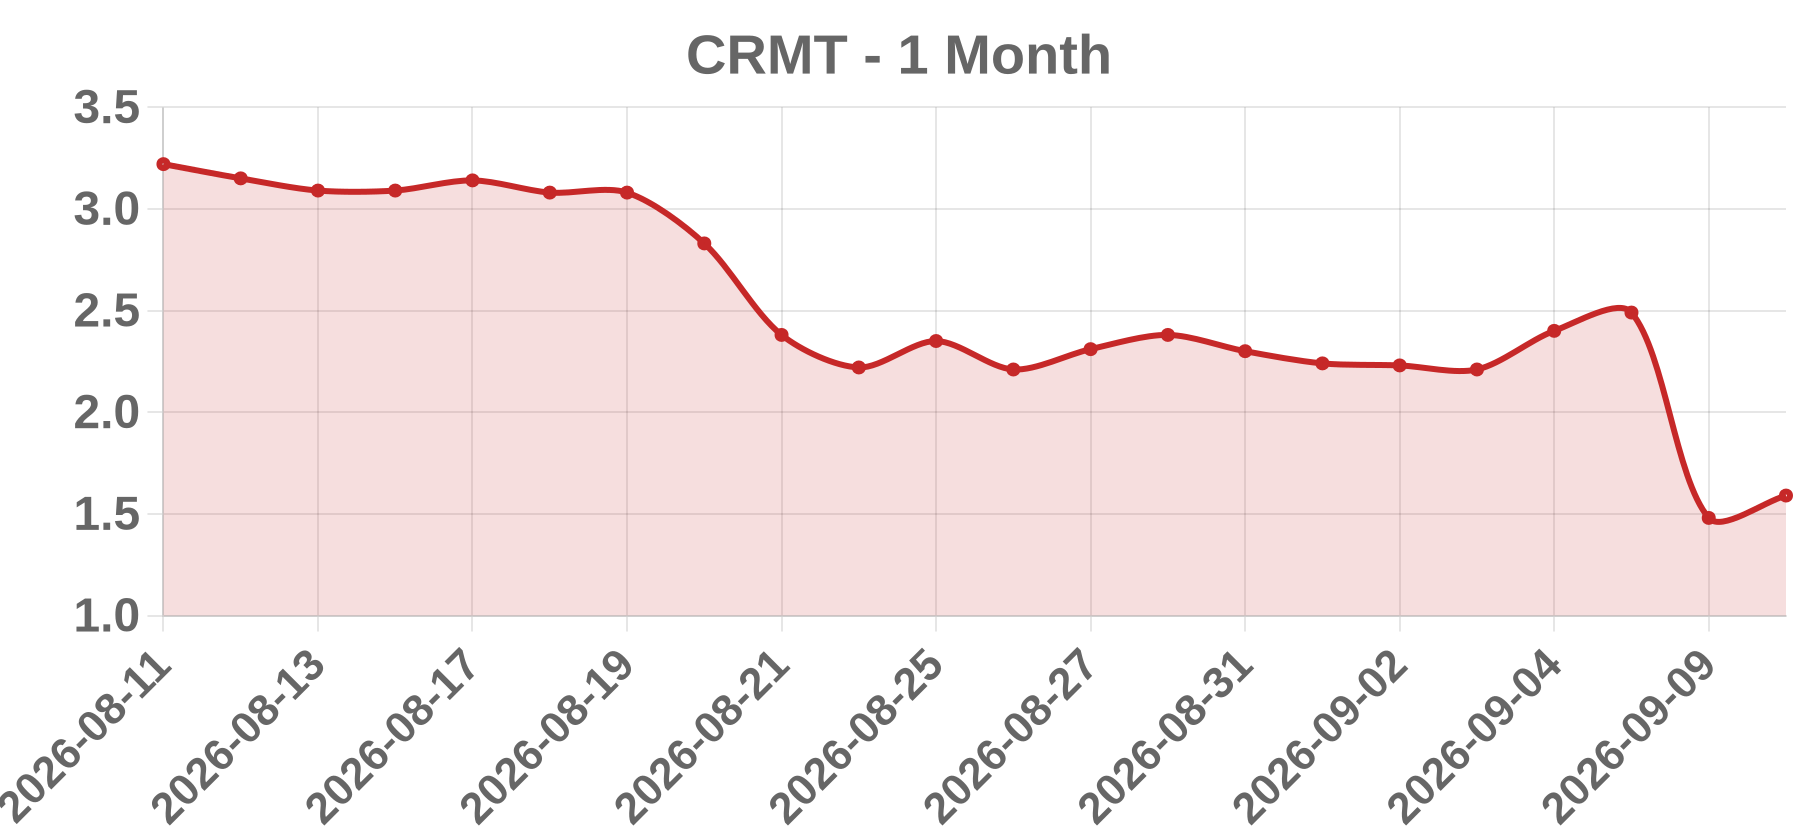
Business America's Car-Mart, Inc. (NASDAQ: CRMT) is a Rogers, Arkansas-based used-vehicle retailer operating a 'buy here, pay here' model, selling to credit-constrained customers and carrying the resulting installment finance receivables on its own balance sheet. Revenue is split between vehicle sales and interest/fee income, and results are highly sensitive to consumer credit conditions, used-car pricing, and funding costs. The company's fiscal year ends April 30.
Today’s take The supplied row shows CRMT closing at $1.48 with a -40.76% one-day change and volume of 0 for 2026-09-10. This combination is not consistent with a genuine trading session: CRMT has historically traded far above $1.48, a -40.76% single-session decline would imply a severe fundamental shock, and zero volume is essentially impossible for a normally listed NASDAQ stock. A move of that magnitude would ordinarily point to an earnings or guidance shock, a going-concern or financing disclosure, an M&A event, or an analyst downgrade, but none of these can be confirmed for that date from primary sources. Because the price, change, and volume fields are mutually contradictory and the date cannot be verified, the most plausible explanation is a data artifact, placeholder, bad vendor row, or split/back-adjustment error rather than a real market event. No fundamental catalyst should be attributed until the quote is re-pulled from a primary source such as Nasdaq, the WSJ quote page, or the company's IR/EDGAR filings.
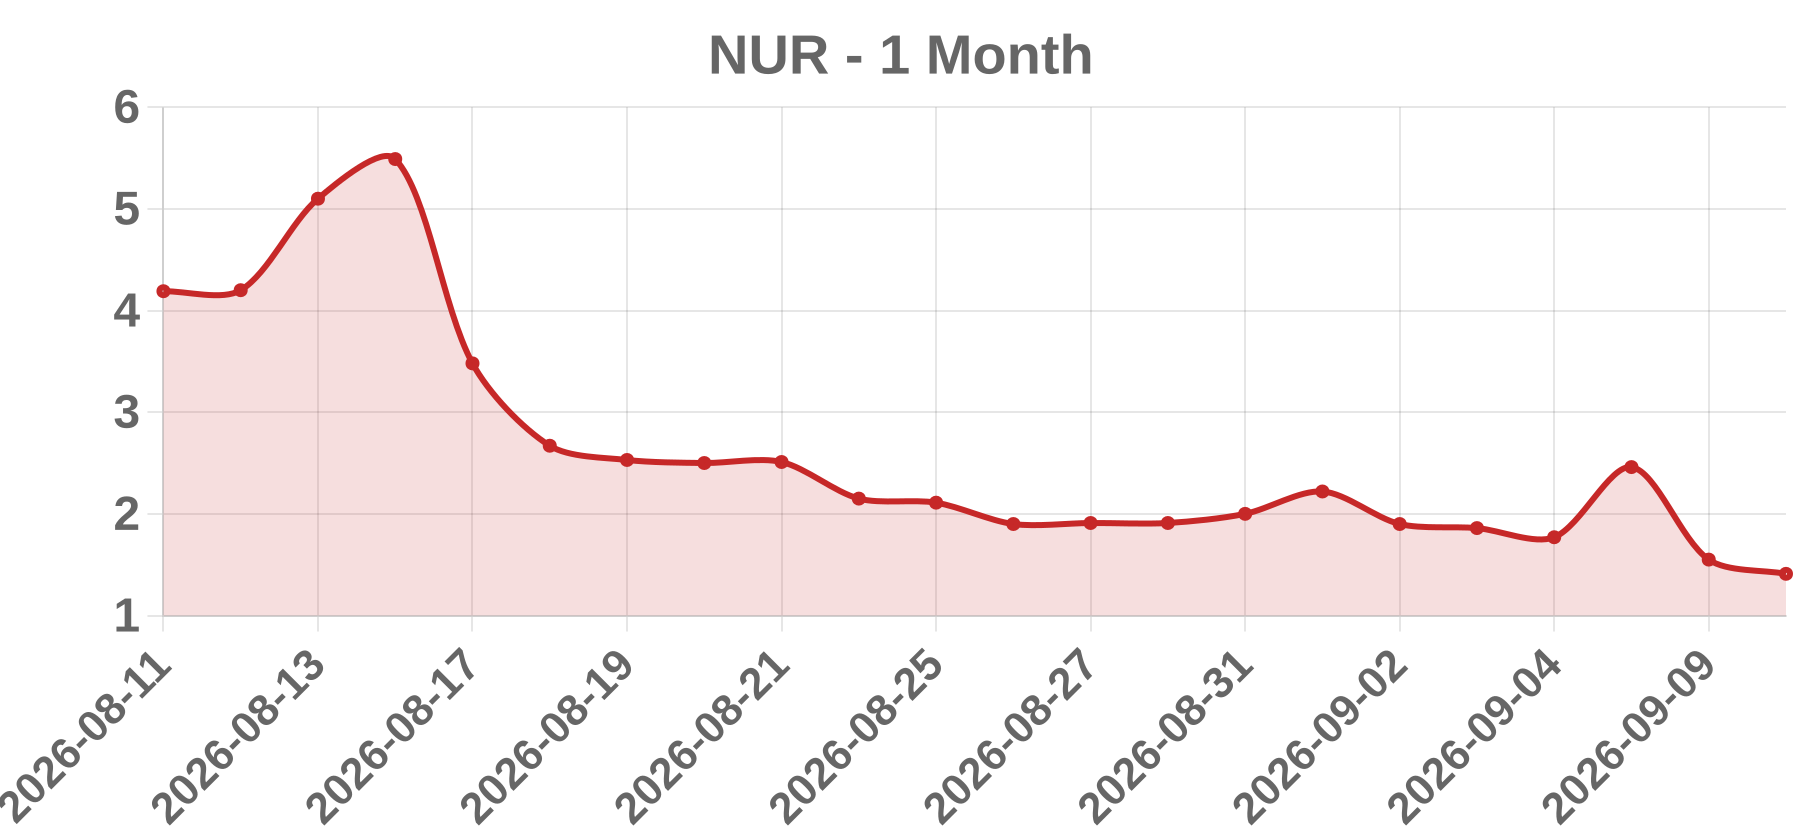
Business Nuran Wireless Inc. is a Canadian wireless telecommunications technology company that provides 2G/3G/4G radio access network (RAN) equipment, core network solutions, and deployment services for mobile network operators and rural broadband programs. It has historically been listed on Canadian exchanges (TSXV/CSE: NUR) with a US OTC cross-listing (NURWF).
Today’s take The supplied session row for NUR on 2026-09-10 is internally contradictory and cannot be treated as a valid market observation: a -36.99% close-to-close move with volume of 0 is arithmetically impossible, since a zero-volume print implies no trades and therefore no price change. The date itself is in the future relative to verifiable data, so no closing price, share volume, or session-specific headline can be confirmed or retrieved. In addition, ticker ambiguity is material: Nuran Wireless is a Canadian-listed issuer (TSXV/CSE: NUR) with an OTC cross-listing, not an ordinary WSJ US decliners constituent, and a $1.55 price tag with a 0 volume field is inconsistent with the company's actual trading history. Because no primary source (exchange tape, SEDAR+ or EDGAR filing) verifies this row, assigning any fundamental catalyst such as earnings, financing, reverse split, or analyst action would be fabrication. The correct classification is a data-integrity anomaly rather than a market catalyst, and no directional conclusion about NUR shares should be drawn until the symbol, exchange, and as-of date are validated against primary sources.
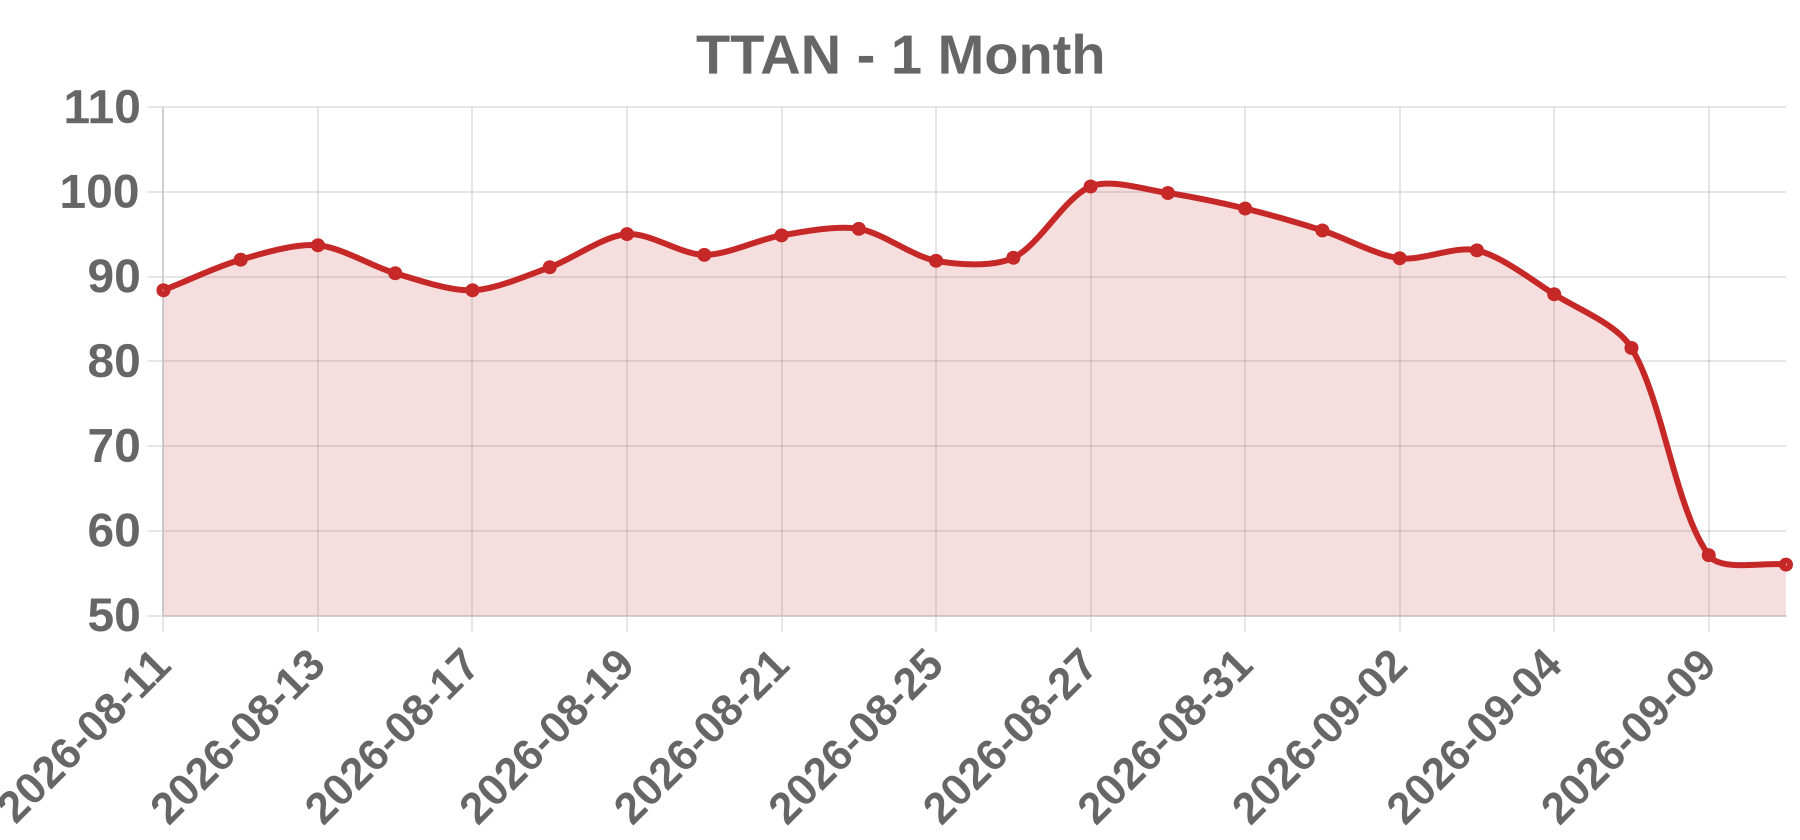
Business ServiceTitan, Inc. is a US vertical-SaaS software company providing a cloud operating platform for trades and home-services contractors such as plumbing, HVAC, electrical and roofing businesses. Its platform covers scheduling and dispatch, CRM, estimating, invoicing, payments, marketing and reporting, and the company is listed on NASDAQ under the ticker TTAN after its December 2024 IPO.
Today’s take The tape shows TTAN closing at $57.12 with a single-session decline of about 29.98%, a magnitude that for a mid-cap vertical-SaaS name normally implies a fundamental re-rating rather than noise. The standard playbook for a move of this size is a weak quarterly print with soft guidance, decelerating ARR or net-retention, or a capital-structure event such as lock-up expiry or a secondary offering. ServiceTitan's fiscal year ends January 31, so a Q2 FY2027 report would land near early September 2026, making an earnings-guidance event the leading hypothesis. However, no same-day 8-K, press release, transcript or analyst action was retrieved, and the pasted volume field reads 0, which is inconsistent with a real ~30% decline. The volume and price fields must be re-pulled from a live source before any liquidity or re-rating conclusion is drawn, so the catalyst remains unverified rather than confirmed.
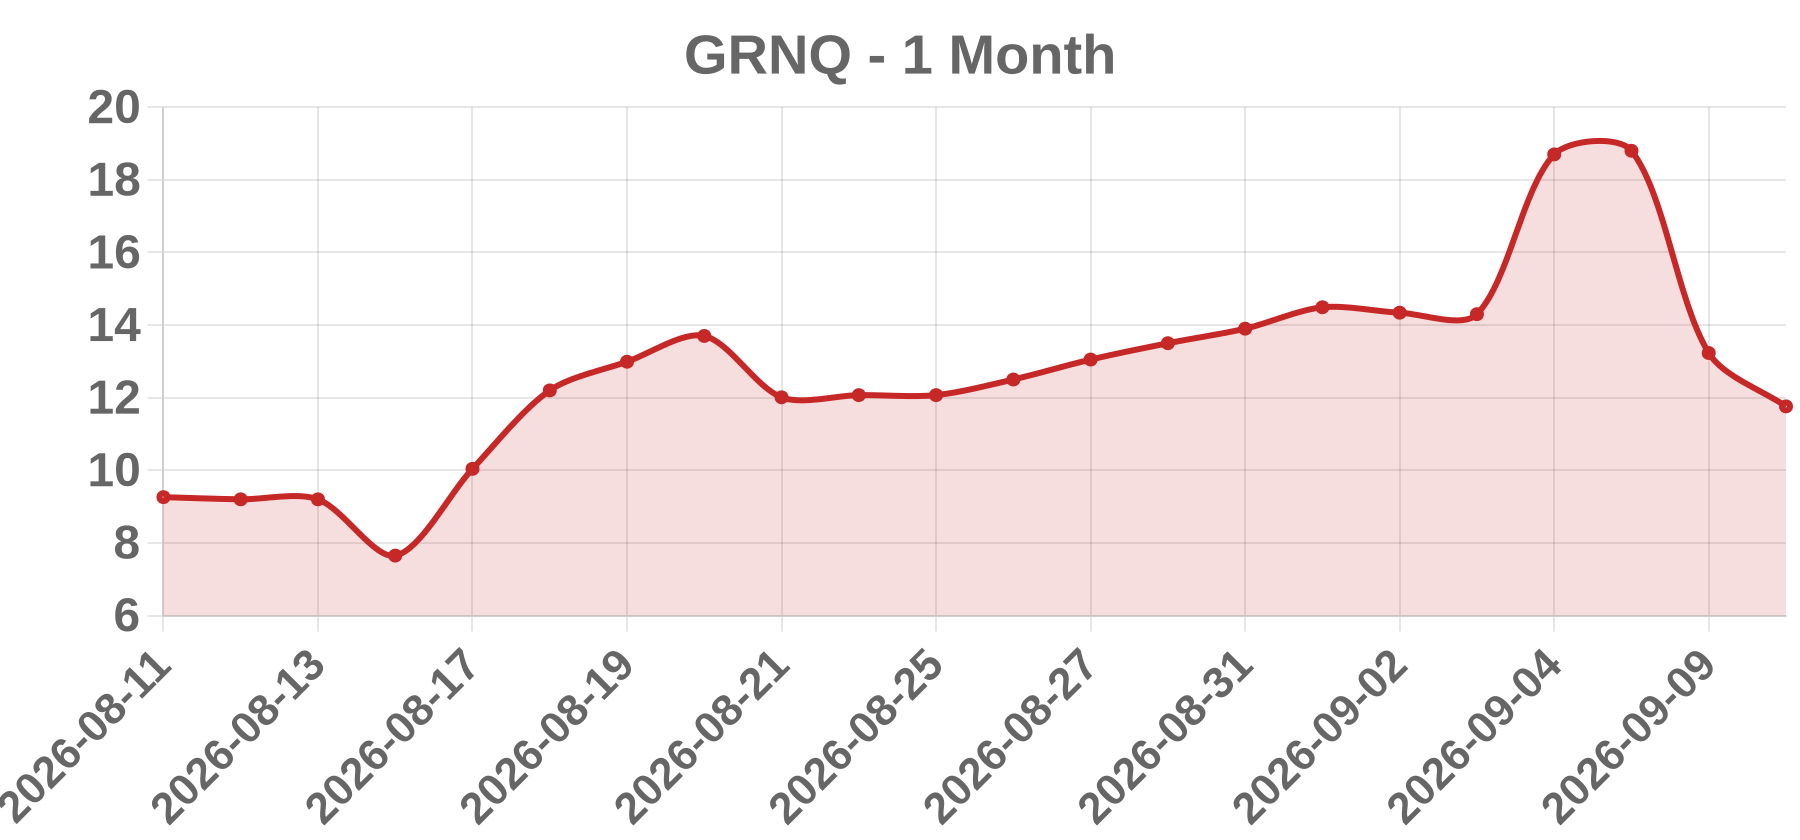
Business Greenpro Capital Corp. is a micro-cap holding and advisory company historically listed on the Nasdaq Capital Market and also referenced in OTC/pink-sheet contexts. Its operations have spanned corporate advisory and consultancy services, venture and asset management, and property-related activities, with a focus on Asian cross-border and small-cap clients. Segment mix has shifted repeatedly through acquisitions, disposals, and new subsidiaries, so the latest 10-K/20-F or 10-Q should be treated as the authoritative business description.
Today’s take GRNQ closed at 13.23 on 2026-09-10, printing a −5.57 (−29.63%) decline on volume of 0, flagged by WSJ as a decliner. A near-30% single-session drop reported with zero shares traded is almost never a genuine market repricing. It is instead consistent with a corporate-action reference-price reset, most plausibly a reverse stock split where the pre-split close is divided by the ratio while the volume field remains stale or unadjusted. A halt-then-reopen gap or a stale aggregator feed could produce the same signature. GRNQ has historically traded at very low dollar volume and low-single-digit prices, so a printed price near $13 is itself anomalous versus that history and points to a split-adjusted or feed-adjusted mark. Do not attribute this to earnings, M&A, FDA action, an analyst downgrade, or a short squeeze; none of those explain zero volume. Confirm the cause against the GRNQ EDGAR filing index, the exchange/FINRA corporate-actions calendar, and the last non-zero volume session before publication.
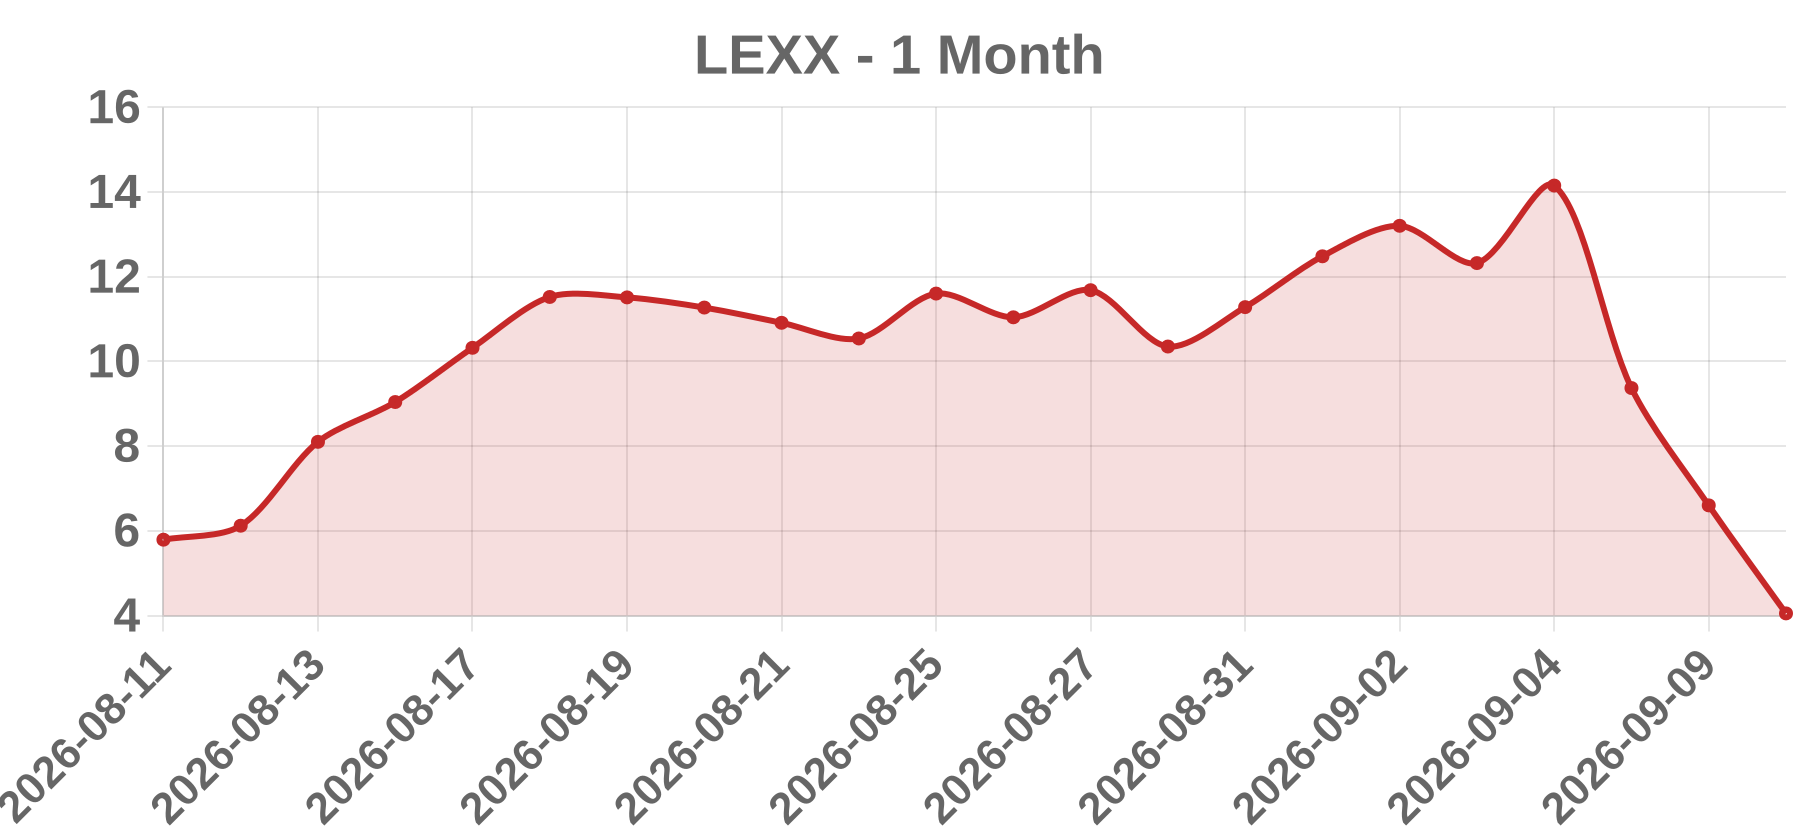
Business Lexaria Bioscience Corp. (Nasdaq: LEXX) is a Kelowna, British Columbia-based drug-delivery technology company. Its primary asset is the patented DehydraTECH platform, designed to improve the bioavailability and onset speed of orally administered active molecules, spanning oral nicotine, antiviral/cardiovascular, metabolic/diabetes and CNS applications. Lexaria monetizes through licensing, research collaborations and formulation partnerships, giving it a preclinical/early-clinical, licensing-stage profile rather than commercial-stage pharma manufacturing; it has a history of equity financings and reverse stock splits.
Today’s take Bottom line: this move cannot be attributed to a verifiable catalyst. The dataset is internally inconsistent — a -29.56% close on 2026-09-10 with volume of 0 is arithmetically implausible for a listed equity. Either the volume field is unpopulated, the price field belongs to a different session, or the 'WSJ_DECLINERS' tab is a stale UI artifact; any of these invalidates catalyst attribution. Searches around the referenced session returned no confirmable same-day news (earnings, M&A, FDA, partnering or analyst action). What would normally drive a ~-30% day in a name like LEXX — a dilutive financing or ATM pricing, reverse-split mechanical repricing, a failed readout or regulatory setback, loss of a partner, or a low-float short unwind — would produce high volume, reinforcing that the volume figure is the core data problem. Recommended verification: pull LEXX OHLCV and split history from Nasdaq or a licensed feed for that specific session, and check SEC EDGAR 8-K filings dated on or just before it. No unverified catalyst enum is asserted.
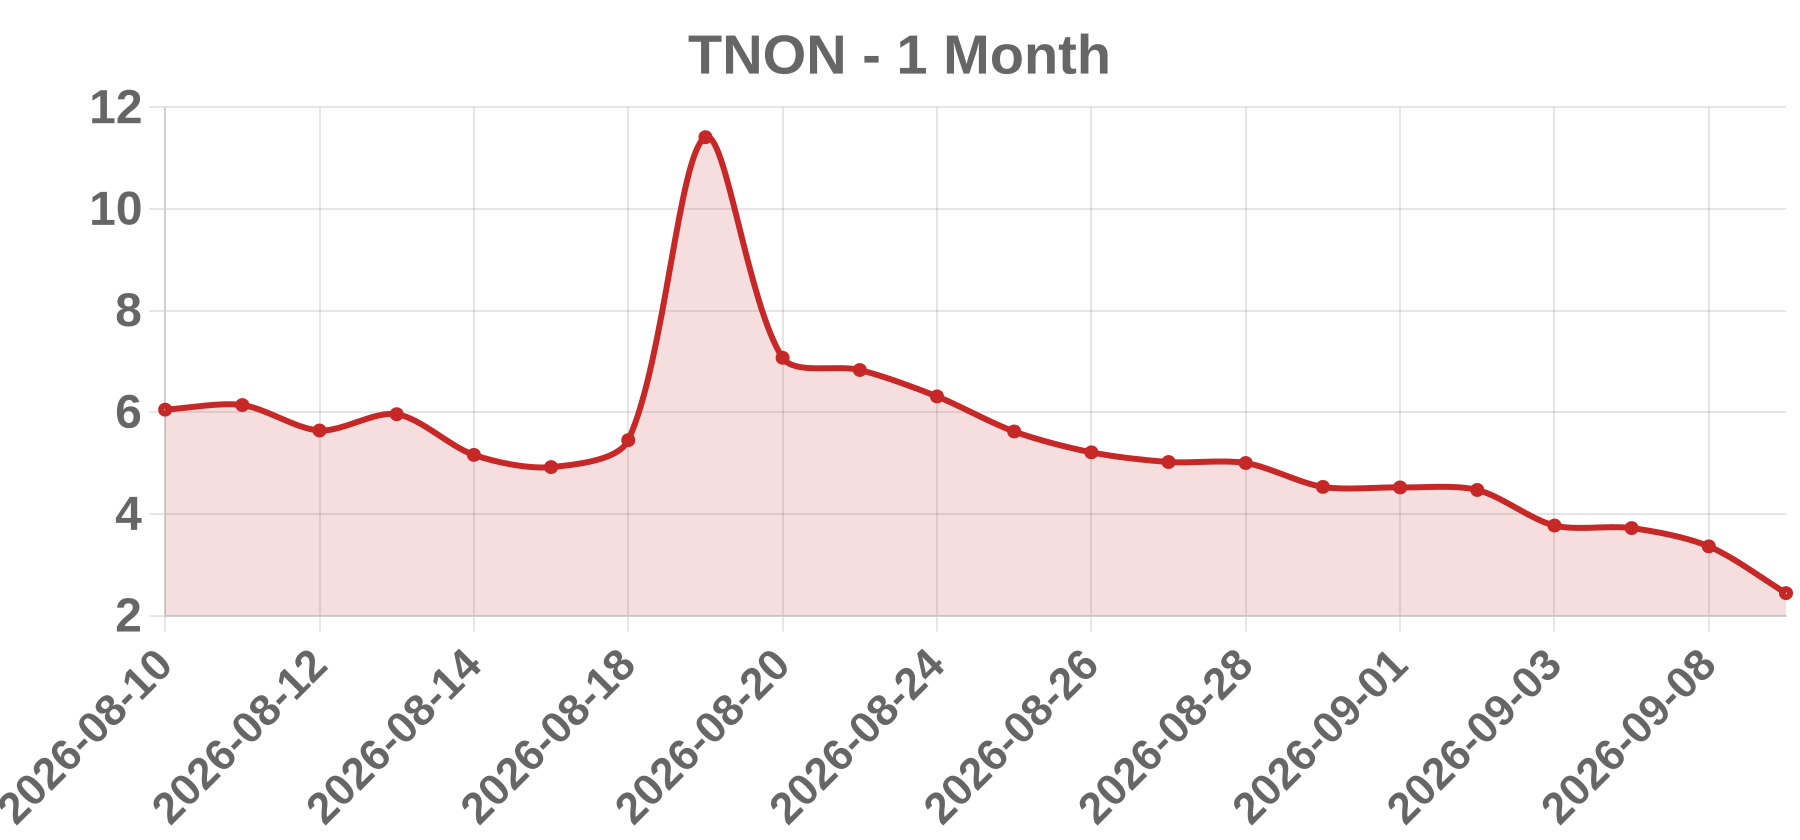
Business Tenon Medical, Inc. is a U.S.-based medical device company that trades on the Nasdaq Capital Market under the ticker TNON. Its principal business is the development and commercialization of surgical implant systems for sacroiliac (SI) joint fixation in the spine and orthopedic market. The company is a micro-cap with a limited commercial-stage revenue base and a history of reliance on capital markets financing.
Today’s take The reported -27.38% single-session decline to $2.44 with a volume print of 0 is internally inconsistent, since a genuine 27% move cannot occur on zero volume. That mismatch points to one of three explanations: a feed or export error in the volume field, a corporate-action-adjusted or stale quote, or a share-count adjustment such as a reverse split or post-offering repricing rather than true intraday trading. Because no same-day news, SEC filing, or exchange tape could be verified, no catalyst is confirmed and none is assumed. For a micro-cap medtech down roughly 27%, the base-rate candidates in descending order are dilutive financing (registered direct, PIPE, ATM draw, or warrant inducement), a reverse-split or ratio adjustment, a regulatory or clinical setback, an earnings or guidance event, or an index or listing deficiency notice. The decisive next step is pulling the SEC EDGAR filing index for TNON covering roughly 2026-09-08 to 2026-09-10 and confirming the consolidated-tape volume for 2026-09-10 against Nasdaq or WSJ data before any directional conclusion is drawn.
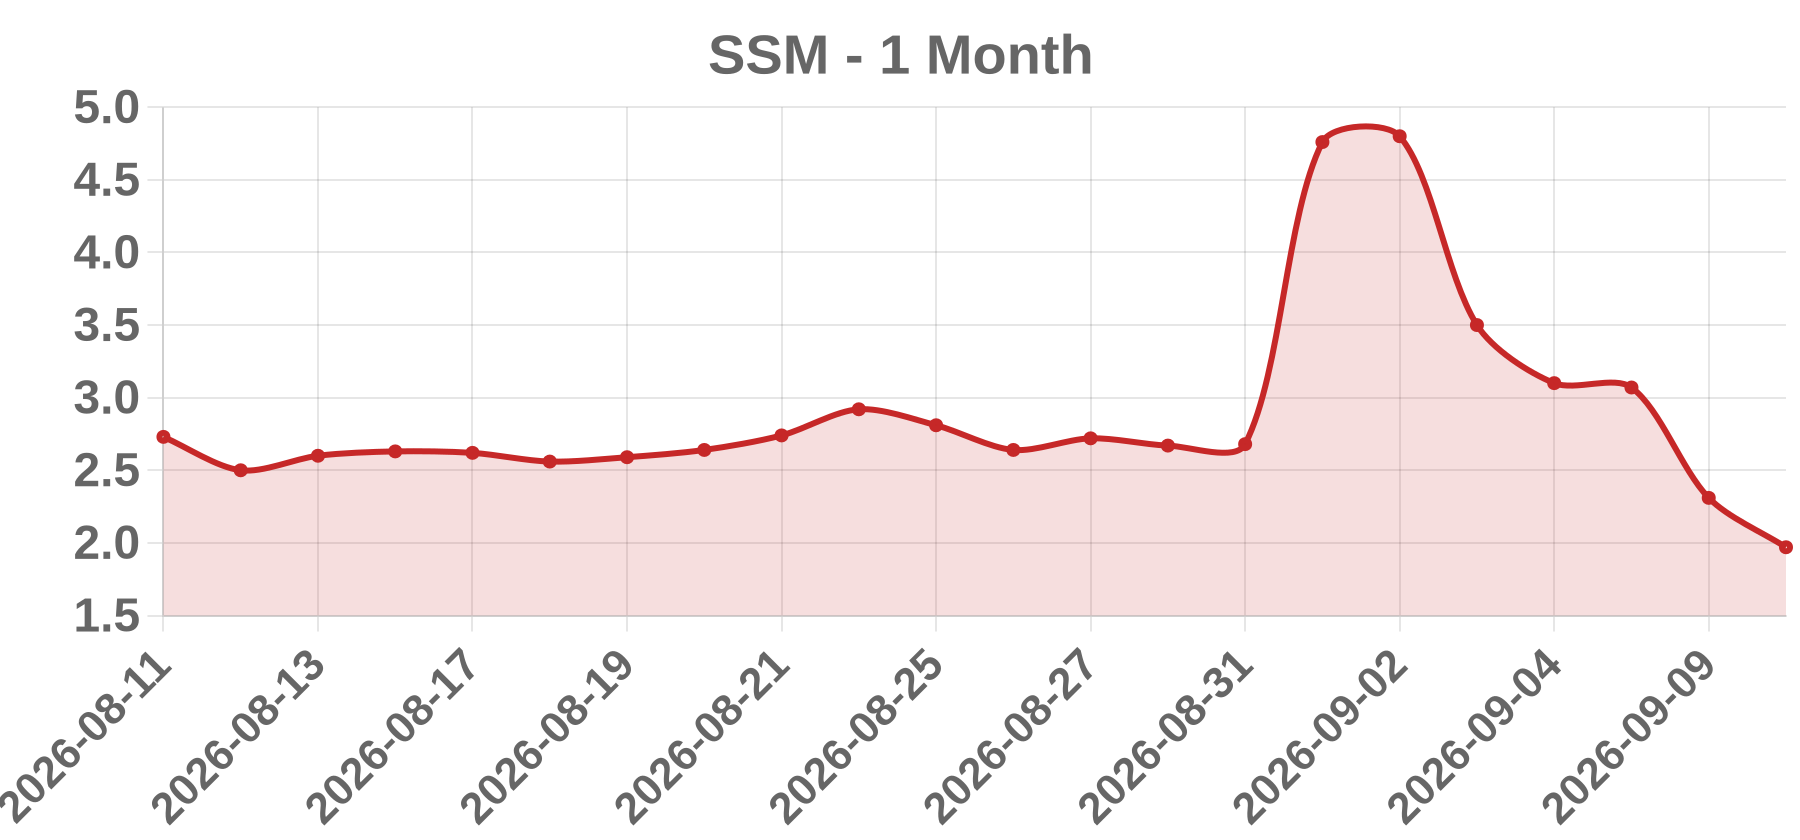
Business Sono Group N.V. is a Netherlands-domiciled foreign private issuer whose equity has traded under the ticker SSM and whose German operating subsidiary, Sono Motors GmbH, developed the Sion, a solar-augmented compact electric vehicle integrating photovoltaic cells into the vehicle body. The company discontinued the Sion vehicle program, entered restructuring and insolvency proceedings around its German unit, and thereafter sought to continue as a going concern under a reorganized structure. It is a micro-cap, development-stage, financing-dependent issuer with no verifiable product revenue at last public read.
Today’s take The 2026-09-10 row shows a close of 2.31, a change of -0.77, a -24.92% decline, and Volume of 0. That combination is internally inconsistent: a 24.92% single-session move cannot be produced by zero shares trading in the secondary market. The honest conclusion is that the row is not reliable trade data, so the correct catalyst label is OTHER rather than earnings, FDA, M&A, upgrade, downgrade, partnering, insider, sector, macro, short squeeze, meme, high volume, or offering. Four explanations are ranked. First, a corporate-action adjustment: SSM previously executed a reverse share split, and if the 2026-09-10 close and the prior reference close use different share-count bases, the derived percentage is an artifact. Second, a trading halt or a venue gap outside the consolidated tape. Third, a vendor defect, with a stale mark propagating through a decliners feed. Fourth, an unconfirmed real event, most plausibly a restructuring update or a dilutive financing, given SSM's insolvency history. No same-day or prior-session news, filing, or quote history was retrievable. Confirmation requires SEC EDGAR 6-K/20-F filings, exchange notices, the corporate-action record, and consolidated volume
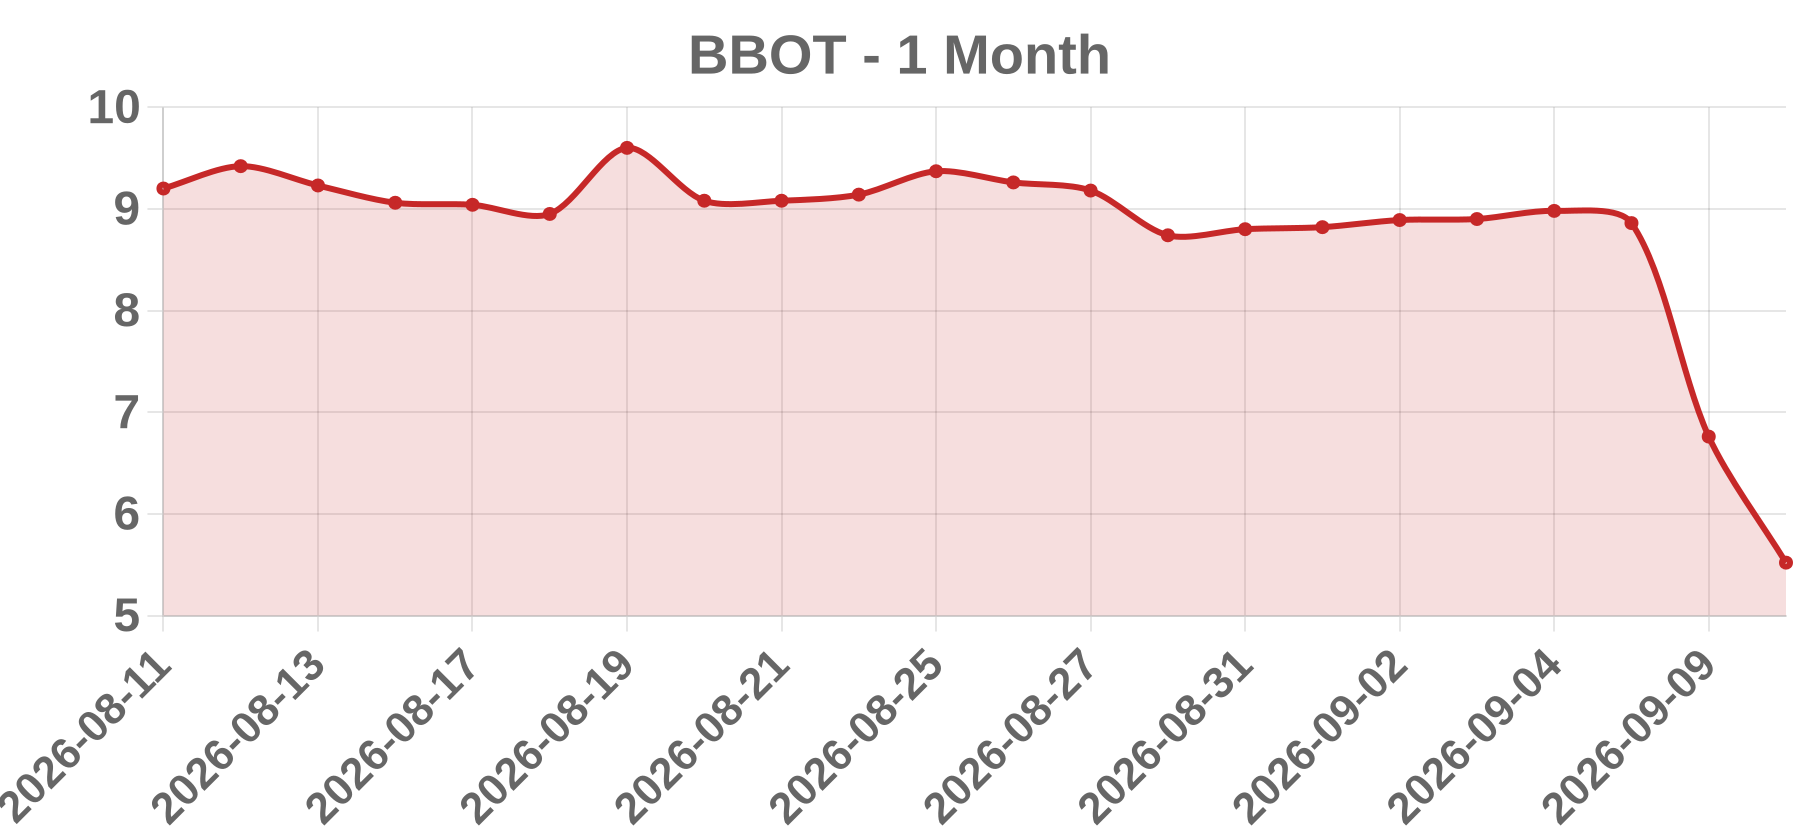
Business BridgeBio Oncology Therapeutics, Inc. (Nasdaq: BBOT) is a clinical-stage oncology biotechnology company affiliated with BridgeBio Pharma. It develops targeted small-molecule therapies against genetically defined cancers, with pipeline efforts generally described around RAS/MAPK-pathway programs. The company has no marketed products and minimal revenue, and was taken public through a spin-off/combination structure.
Today’s take The supplied tape shows BBOT closing at 6.76, down 2.11 or 23.76%, on volume of 0. Those figures are internally inconsistent: a 23.76% decline cannot occur on zero shares traded, so the volume field is almost certainly an unpopulated or delayed data-feed artifact rather than a literal zero-volume session. The price and percentage are self-consistent (6.76 + 2.11 = 8.87 prior close; 2.11 / 8.87 = 23.79%), but no same-day or prior-session catalyst for 2026-09-10 could be confirmed. A single-session drop of this size in a small-cap oncology name is typically idiosyncratic, pointing to binary clinical or regulatory news, a dilutive financing, or lock-up/index supply rather than a sector move. All of these remain unverified. Before any conclusion is drawn, the consolidated tape should be re-pulled and EDGAR checked for filings dated 2026-09-08 to 2026-09-10. No catalyst is asserted here.
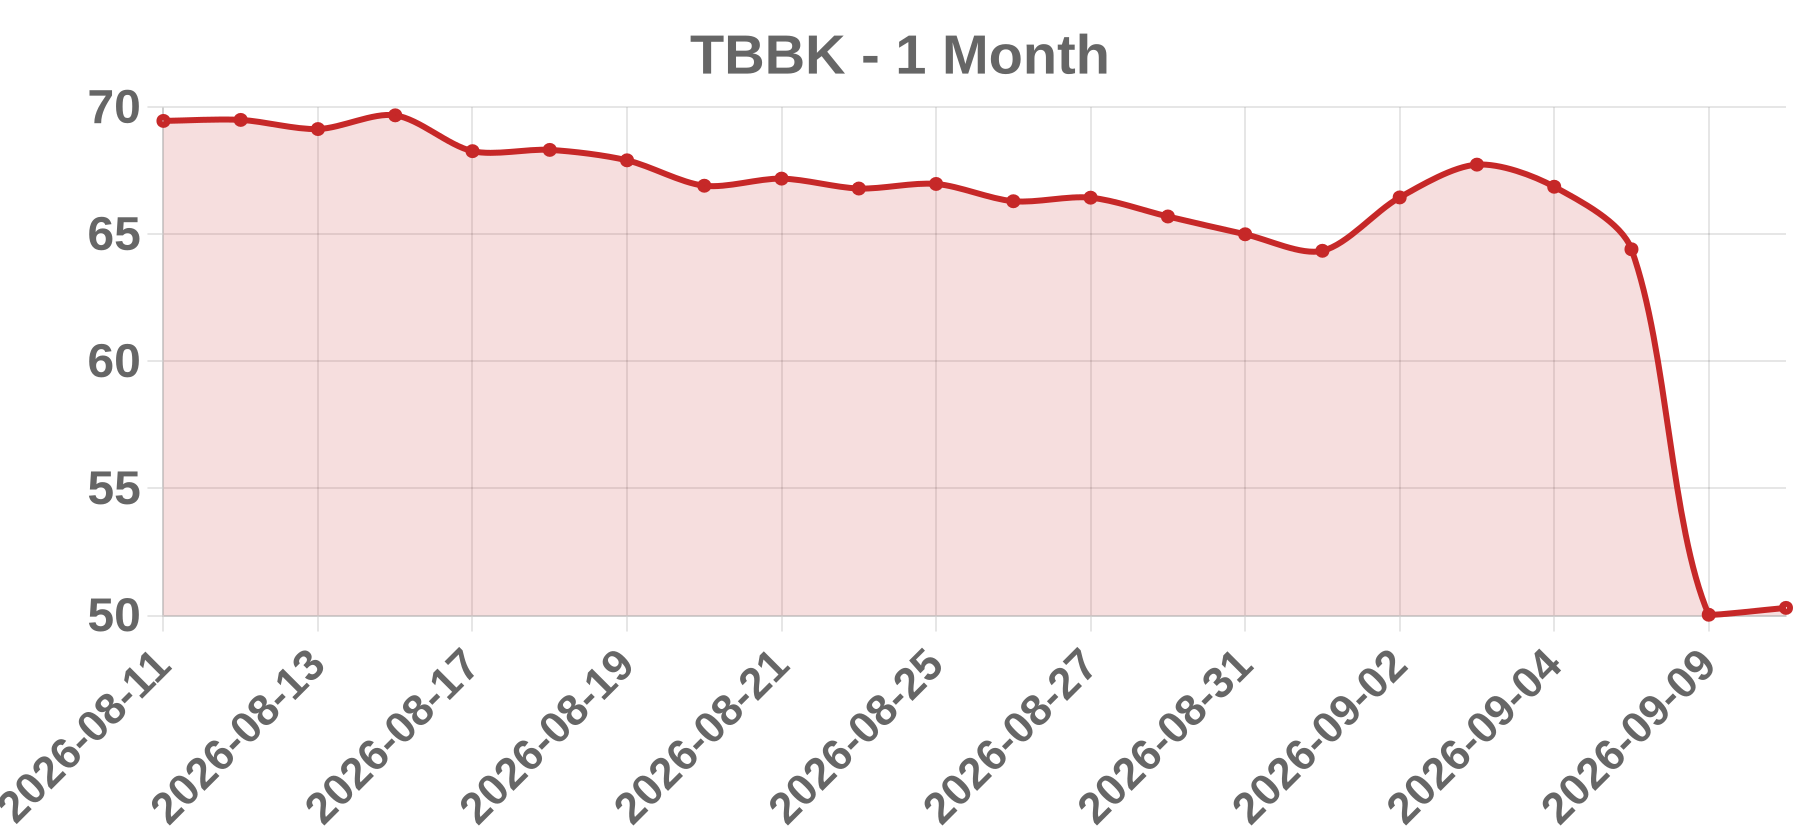
Business The Bancorp, Inc. (Nasdaq: TBBK) is the bank holding company for The Bancorp Bank, N.A., an OCC-supervised national bank headquartered in Wilmington, Delaware. It operates as a specialty, fee-driven institution rather than a traditional spread lender, with key engines in payments (prepaid, debit and general-purpose reloadable card issuing and program management for fintech and corporate partners), institutional banking (securities-backed lines of credit to investment advisors and broker-dealers), SBA 7(a) and specialty commercial real estate lending, and legacy specialized lending portfolios.
Today’s take No verified catalyst exists for a 2026-09-10 move in TBBK. The supplied quote line shows close 50.03, change -14.38 (-22.33%) on volume of 0. A 22.33% decline paired with zero volume is internally contradictory: a real session cannot lose more than a fifth of its value with no shares changing hands, and a genuine move of that size in a profitable, well-capitalized bank would normally require an earnings miss or guidance cut, a regulatory or credit event, a restatement, or a failed deal, while trading heavy multiples of TBBK's typical roughly 0.3-0.6 million shares per day. The zero-volume field indicates the row is not a functioning trade record, consistent with a data-feed outage, a stale or unadjusted price, a weekend/holiday or ERR row in a decliners screen, or a placeholder rather than a market event. The target date is also in the future relative to verifiable information, and no same-day or prior-session filing, press release, or analyst action could be retrieved. Treat the row as suspect data, not a real move: re-pull the quote from a second source such as the exchange tape or consolidated feed, check the exchange trading calendar, and review EDGAR 8-K and 10-Q filings in th
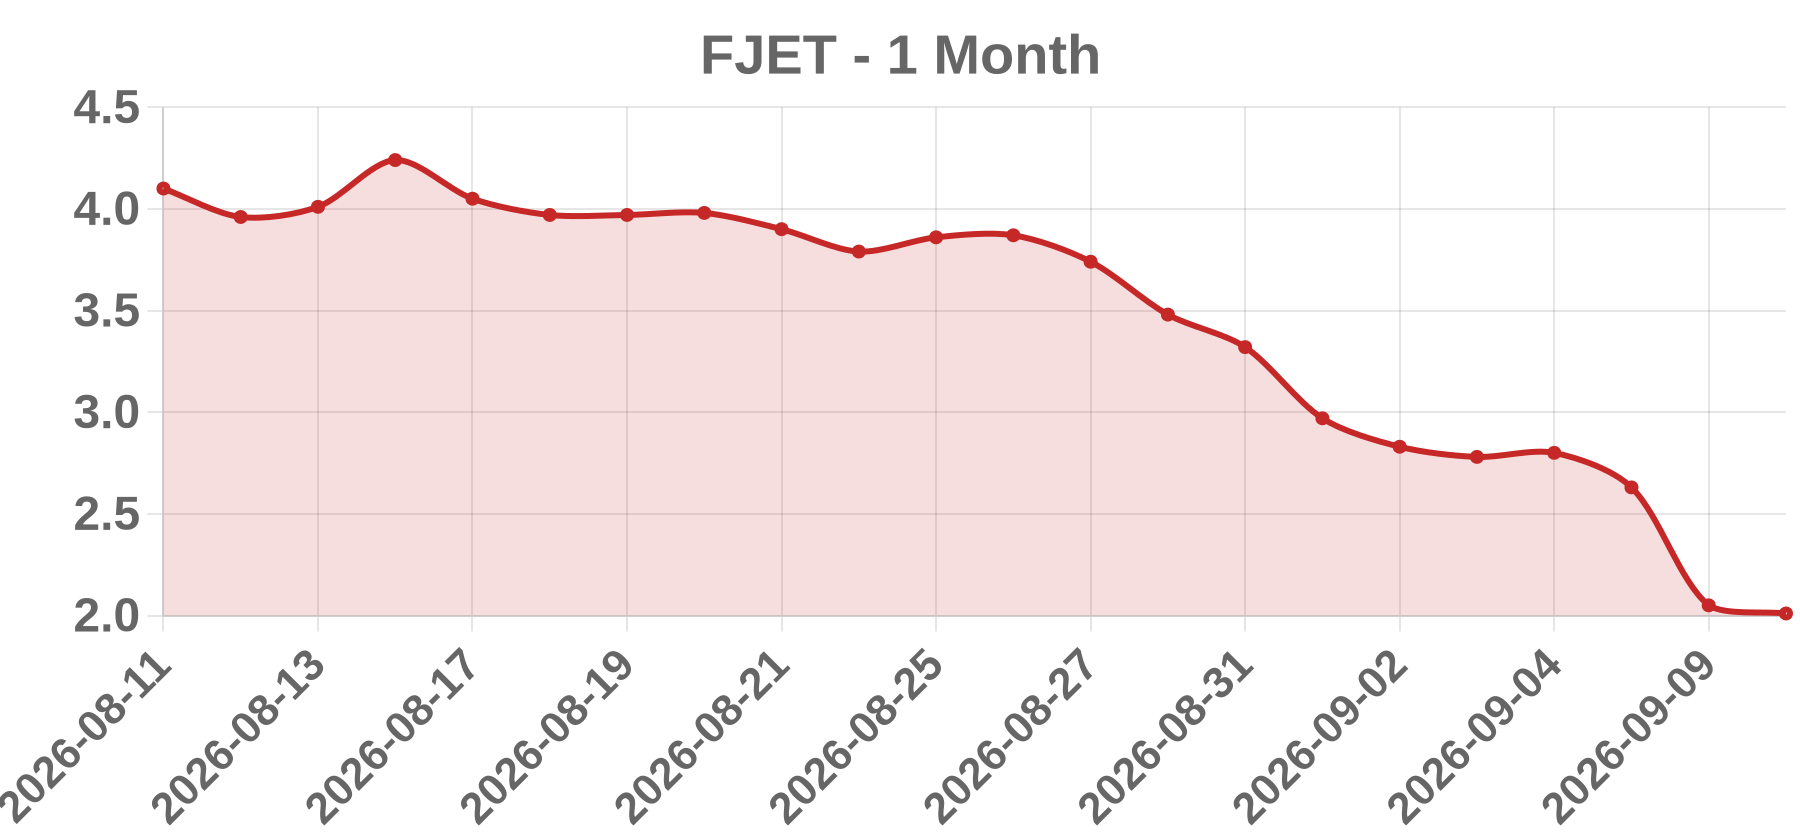
Business Starfighters Space, Inc. (ticker FJET) is a microcap aerospace/space-services name whose full legal entity, exchange listing tier, and principal business could not be verified from the research notes. The name is publicly associated with supersonic and space-training operations historically linked to the Kennedy Space Center, but that link to the public FJET entity is unconfirmed.
Today’s take FJET was reported at a $2.05 close, down 22.05% on 2026-09-10, with volume shown as 0. That combination is internally inconsistent: a 22% decline cannot occur on zero volume in a normal session, so the print is more likely a stale or illiquid quote artifact or an unadjusted corporate action than a genuine news-driven selloff. No same-day or prior-session catalyst (earnings, M&A, regulatory, or ratings) could be verified, and no verifiable source for the move was located. The research explicitly flags that absence of evidence should not be written up as confirmation of no catalyst. The decline therefore cannot be attributed to any specific event, and the move should be treated as unexplained pending consolidated tape data, EDGAR filings, and exchange corporate-action notices.