US common stocks / ADRs: top 10 by volume; top 10 gainers (by % change, volume as tie-breaker); top 10 losers (by % change, prefer liquid names). Deep notes cover the de-duplicated set across the three boards.
30 names on this page · volume 10 · gainers 10 · losers 10
Order: volume board → gainers → losers; each ticker appears once. Summaries of public information only — please verify primary sources.
1/10NVDA NVDA
+0.84%
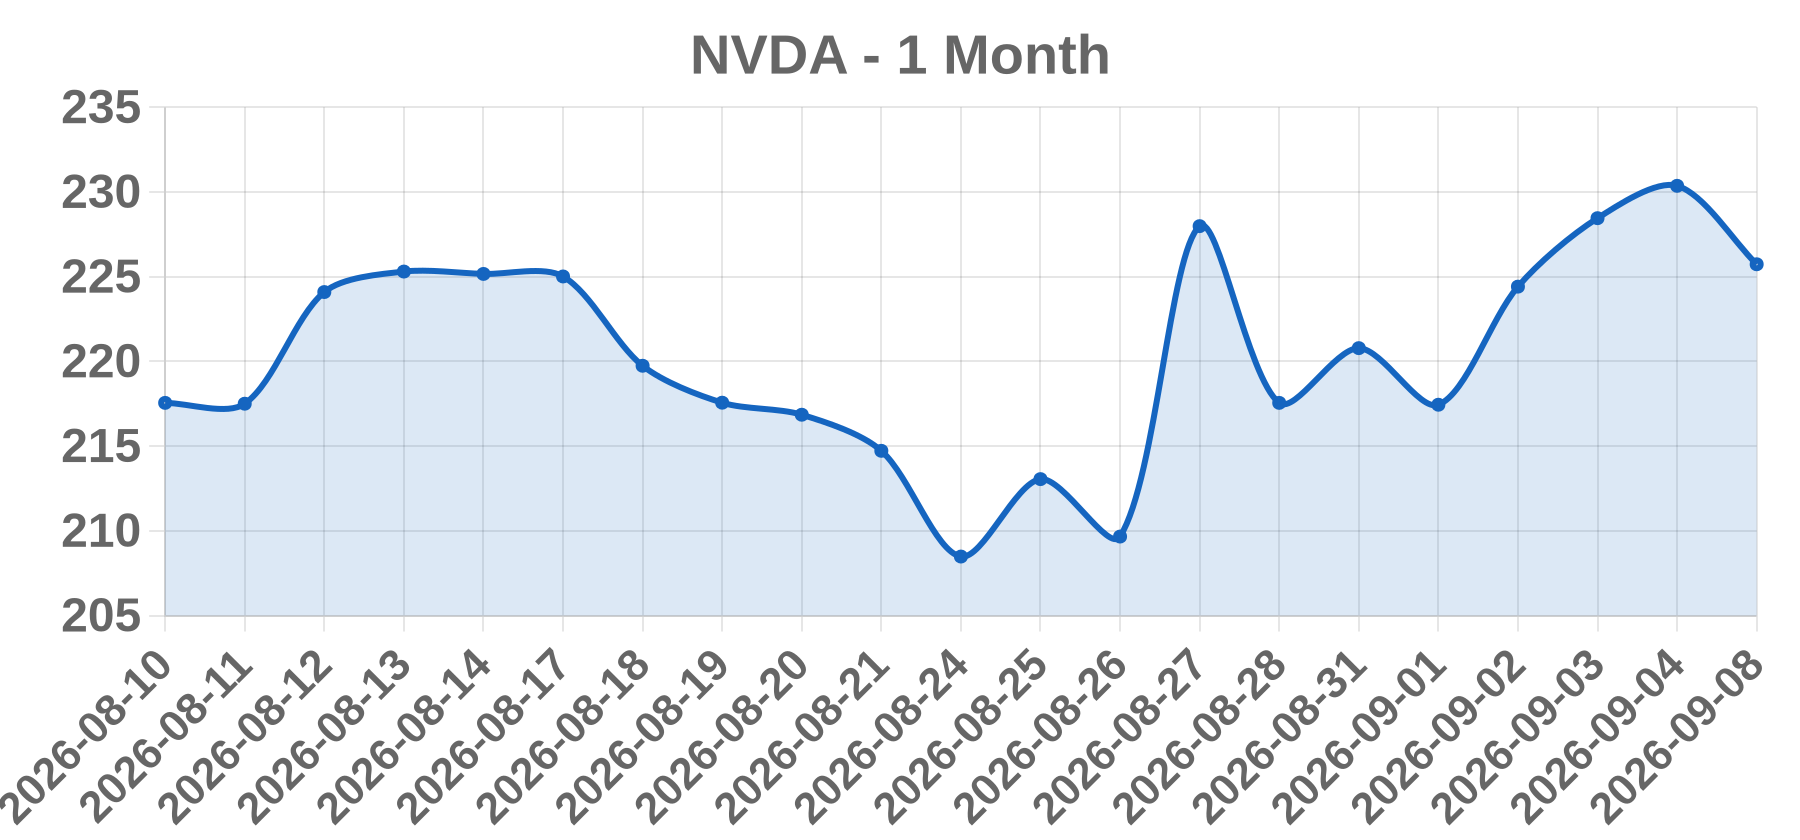
Close 230.36 · Vol 135.35M · Type: Other
Approx. 1-month price (illustrative)
Business NVIDIA Corporation (NASDAQ: NVDA), headquartered in Santa Clara, California, designs graphics processing units (GPUs), data-center AI accelerators, data-center networking, and system-on-chip platforms for gaming, AI compute, professional visualization, automotive, and robotics markets. It is among the world's most valuable companies with a market capitalization near $5.5-5.6 trillion.
Today’s take The session closing at $230.36 (+0.84%, prior close $228.45) capped a ~10.5% advance over ten sessions (Aug 24 to Sep 4), with NVDA near record highs and market cap ~$5.56T. Primary catalyst: NVIDIA confirmed (Sep 3) its definitive ~$12.93B acquisition of open-AI platform Hugging Face (~$11.9B cash plus up to ~$1B staff equity retention), reinforcing its expansion beyond chip hardware and fueling AI-optimism buying. Supporting drivers: record fiscal Q2 FY2027 revenue of $96.2B (+106% YoY) and data-center revenue of $89.0B (+117%), a 2,400% dividend hike to $0.25/quarter and ~$26B capital returned in Q2 with ~$99.3B buyback authorization remaining. On Sep 4, CLSA raised its target to $425 (from $360). Note: the recorded 230.36/135.35M figures match the early-September Friday session; the subsequent Sep 8 session actually reversed lower to ~$225.7 as the $236 breakout failed.
Business Intel Corporation designs, develops, manufactures, markets and sells computing and related end products worldwide, and trades on the NASDAQ under ticker INTC. It operates mainly through three segments — Client Computing Group (CCG), Data Center and AI (DCAI), and Intel Foundry — and is mid-way through a strategic turnaround under CEO Lip-Bu Tan, repositioning toward AI products and external foundry capacity (including the reported up-to-$120B Terafab project backed by Tesla/SpaceX/xAI).
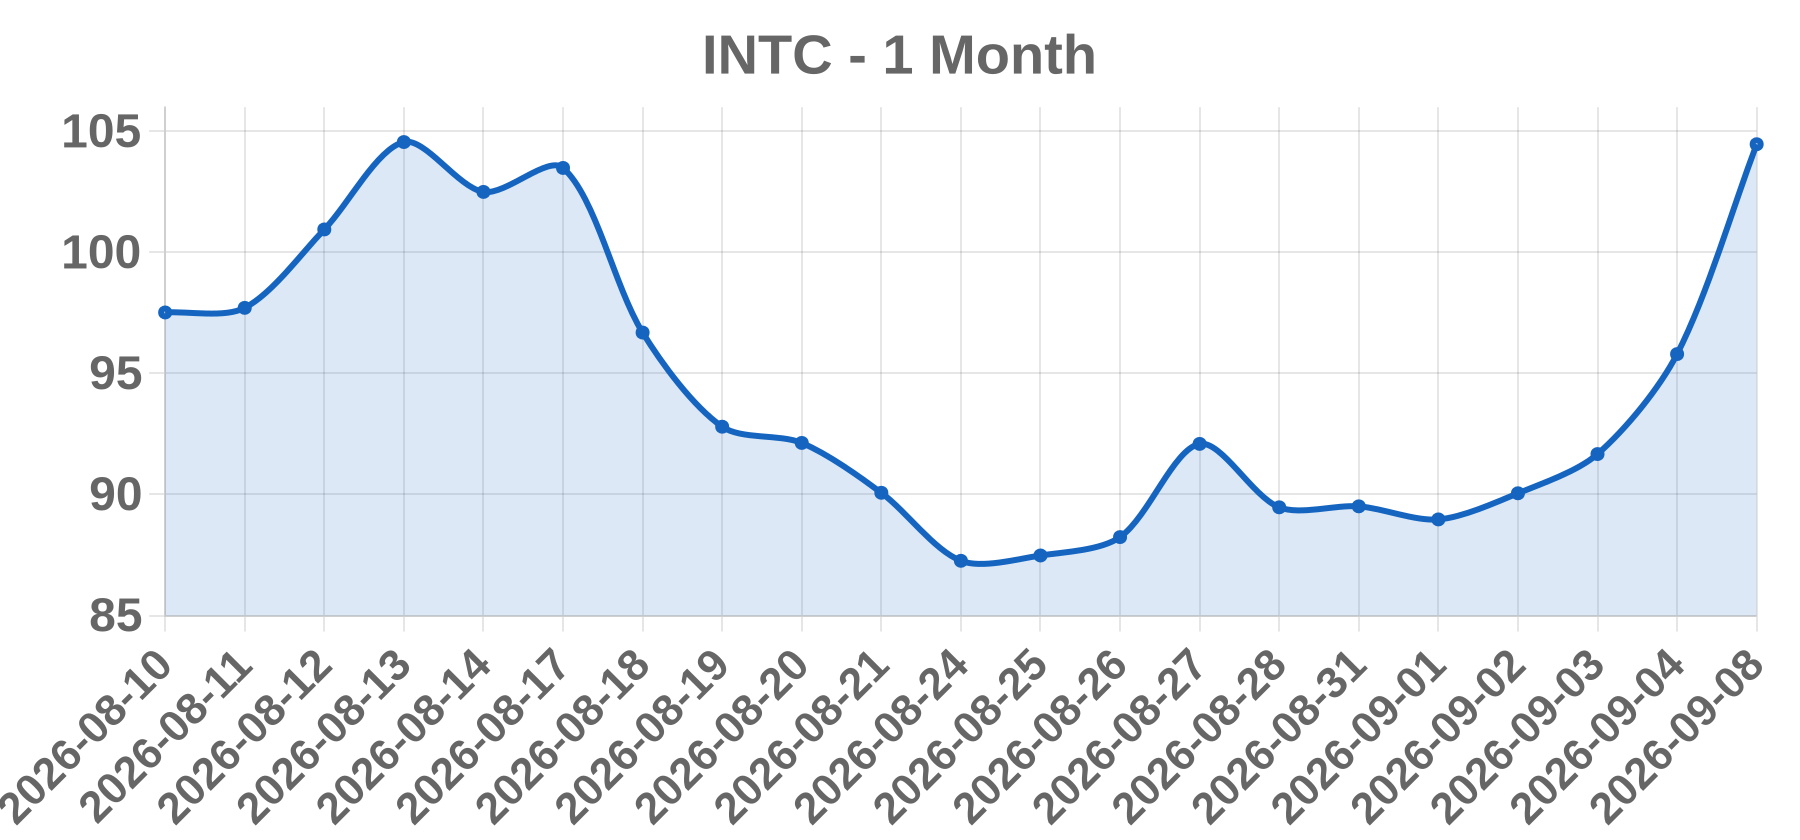
Today’s take INTC rose +4.51% to $95.80 on 2026-09-08 on a multi-catalyst day. Primary driver: Northland Securities analyst Gus Richard upgraded INTC to Outperform from Market Perform with a $120 price target (~25% upside), citing Intel's turnarouund, AI/server pricing power, a server-CPU shortage amid ~18 months of China-Taiwan geopolitical risk, and foundry upside from the Terafab venture. Compounding catalysts: (1) Intel Foundry and ASML announced more than 1 million wafers processed with High-NA EUV lithography, in high-volume manufacturing on the Intel 18A process for select Intel Core Ultra Series 3 (Panther Lake) layers; (2) Taiwan trade-press reports (DigiTimes chain) said Intel plans ~10% PC CPU price hikes on Oct 5, 2026 — its third increase since late-2025, with lower-margin 'Small Core' lines under EOL review, supporting margin-discipline; (3) a broad semiconductor-sector advance (AMD, Micron, Nvidia up). The move built on a strong fundamental narrative: Q2 2026 revenue +25% YoY to $16.1B (fastest in 15 years), DCAI revenue +59% YoY, and adjusted EPS $0.42 above guidance.
Business American Airlines Group Inc. (NASDAQ: AAL) is one of the world's largest airlines, operating a global network from hubs such as Dallas/Fort Worth, Charlotte, Chicago, Miami and New York. It carries passengers, cargo and mail across the Americas, Europe, Asia and beyond, and is one of the most fuel-cost-sensitive carriers in the sector, with a comparatively weaker balance sheet than its network peers.
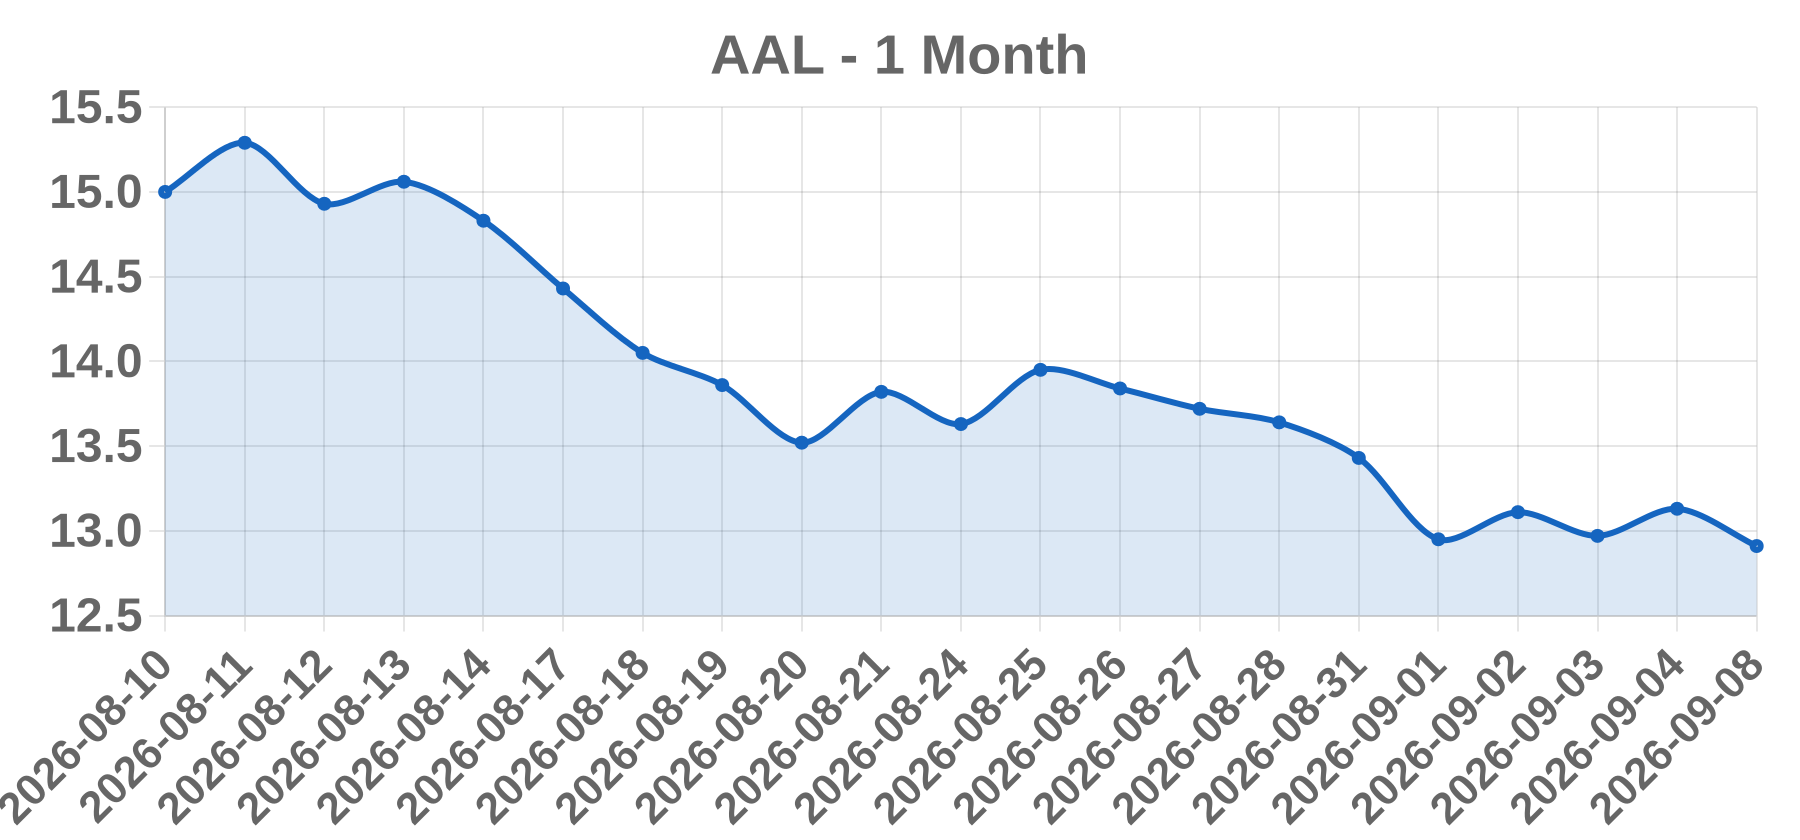
Today’s take The quoted session reflects the Friday, Sep 4, 2026 US close of $13.13 (+1.23%) on ~73.9M shares; the Sep 8 label is a data-snapshot date because Sep 7 (Labor Day) closed US markets. The gain is best read as a low-conviction bounce/consolidation atop deeply beaten-down levels. AAL had been hammered through late July-August after jet-fuel spikes (crude topping ~$100/bbl during the Iran crisis) forced management to slash FY2026 adjusted EPS guidance to a wide -$0.65 to +$0.65 range, sending the stock from ~$17 to the low-$13s, with Goldman at Sell and Targets slashed to ~$13-$15. In the Sep 4 session, crude eased off peaks (WTI slipped below $90 intraday) as Middle East de-escalation hopes and US-Iran negotiation signals emerged, giving airlines modest fuel-cost relief and lifting the group. Sentiment was also supported by AAL's own strategic push upmarket — the launch of the retrofitted 777-300ER with 70 Flagship Suite lie-flat pods and 144 premium seats (entering service Sep 2, JFK-Buenos Aires) targeting higher-margin travel — and CNBC-reported expansion of seven higher-margin international routes on the A321XLR. A strong Aug employment report on Sep 4 added a firmer macro tone. Y
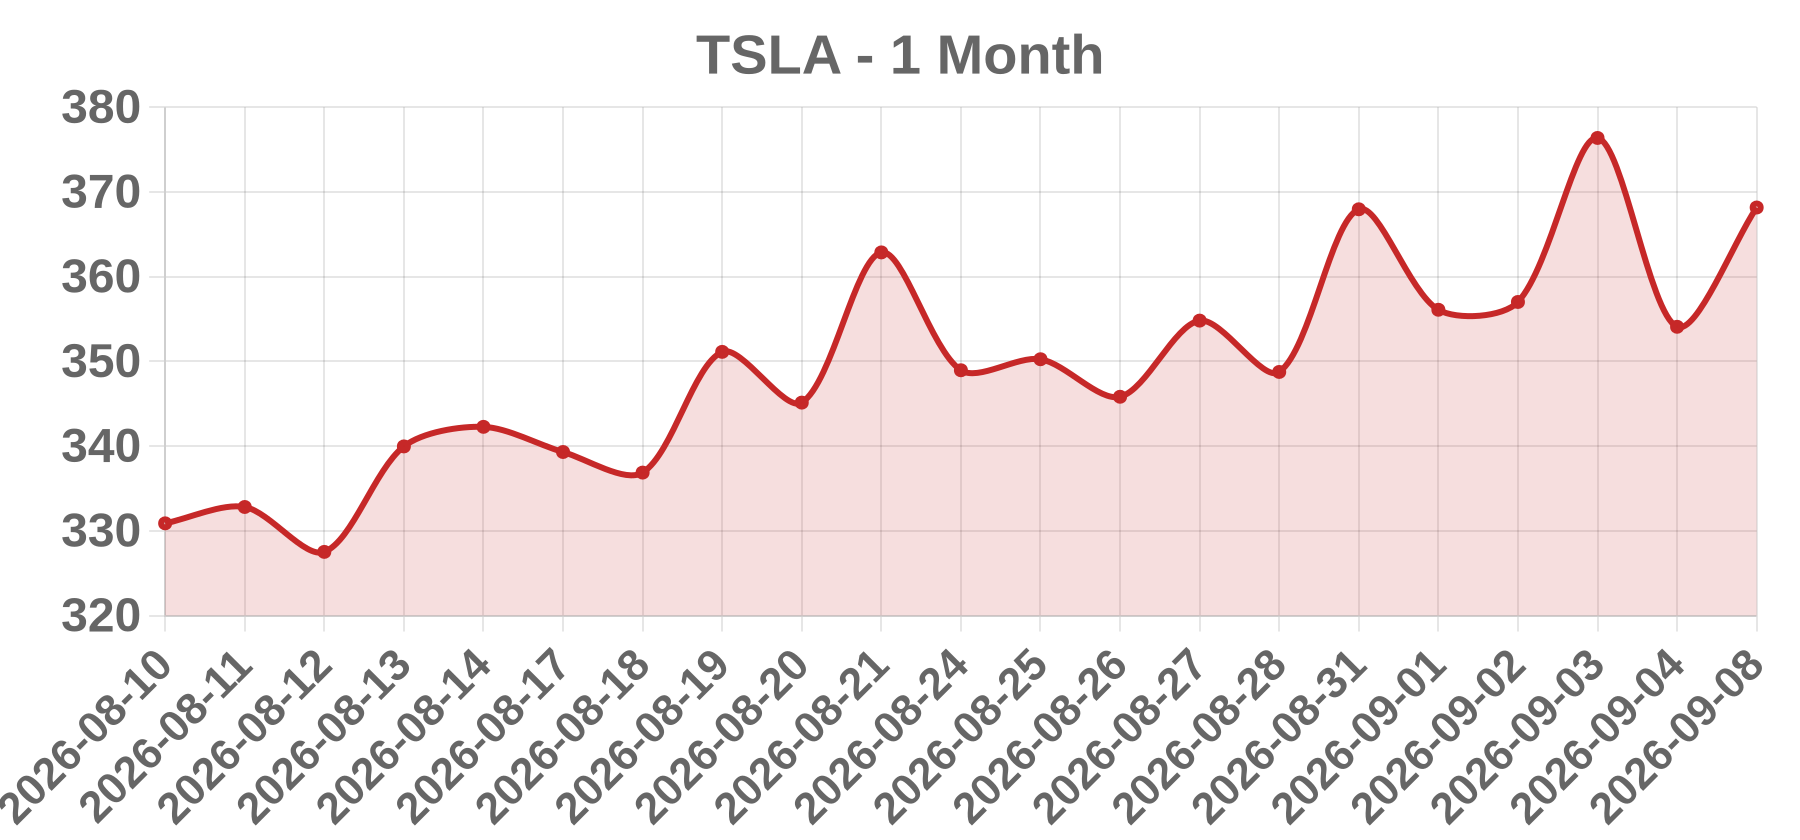
Business Tesla (TSLA) shares plunged 5.92% to close at $354.08 in the session tied to this report, undoing the prior day's surge. The selloff was driven by two linked events around the commercial launch of the driverless, steering-wheel-free two-seat 'Cybercab' robotaxi in Austin, Texas. First, the launch event itself (invite-only, not livestreamed, with CEO Elon Musk absent) disappointed investors by offering little new disclosure on pricing, production timeline/capacity, revenue contribution, or fleet details. Second, US regulator NHTSA opened an investigation (Audit Query AQ26002) into ~1,000 Cybercabs over how Tesla self-certified the vehicle against federal safety standards (FMVSS) given its lack of steering wheel, pedals, and mirrors. The reversal erased roughly $88 billion in market value, w
Today’s take The setup is a textbook 'buy the rumor, sell the news' reversal layered on a fresh regulatory overhang. TSLA had rallied +5.42% to $376.37 on Sept 3 on Cybercab launch optimism, but the event under-delivered on hard data and touched the 3rd of September as the narrative peaked into a ~$1.5T valuation. The next session, shares gapped/reversed lower, fell ~5.92% to $354.08 on ~65 million shares (about 53-55% above the ~42.1M three-month average). The move combined (1) disappointment that the launch added limited incremental information—no pricing, production cadence, or regulatory approval timeline, per RBC; (2) a same-day NHTSA self-certification probe that raised the risk of rollout delays and reopened Autopilot/FSD data scrutiny; and (3) classic profit-taking after a sharp run-up. Losses were roughly consistent across the day, closing near session lows around $354 in a high-leverage, high-short-interest name (TSLA is among the most shorted mega-caps). Fundamentally, the robotaxi/soft-recurring-revenue thesis was not negated but its near-term monetization was pushed into question; the stock's failure to hold the $368-$376 zone turned former support into resistance, with traders fla
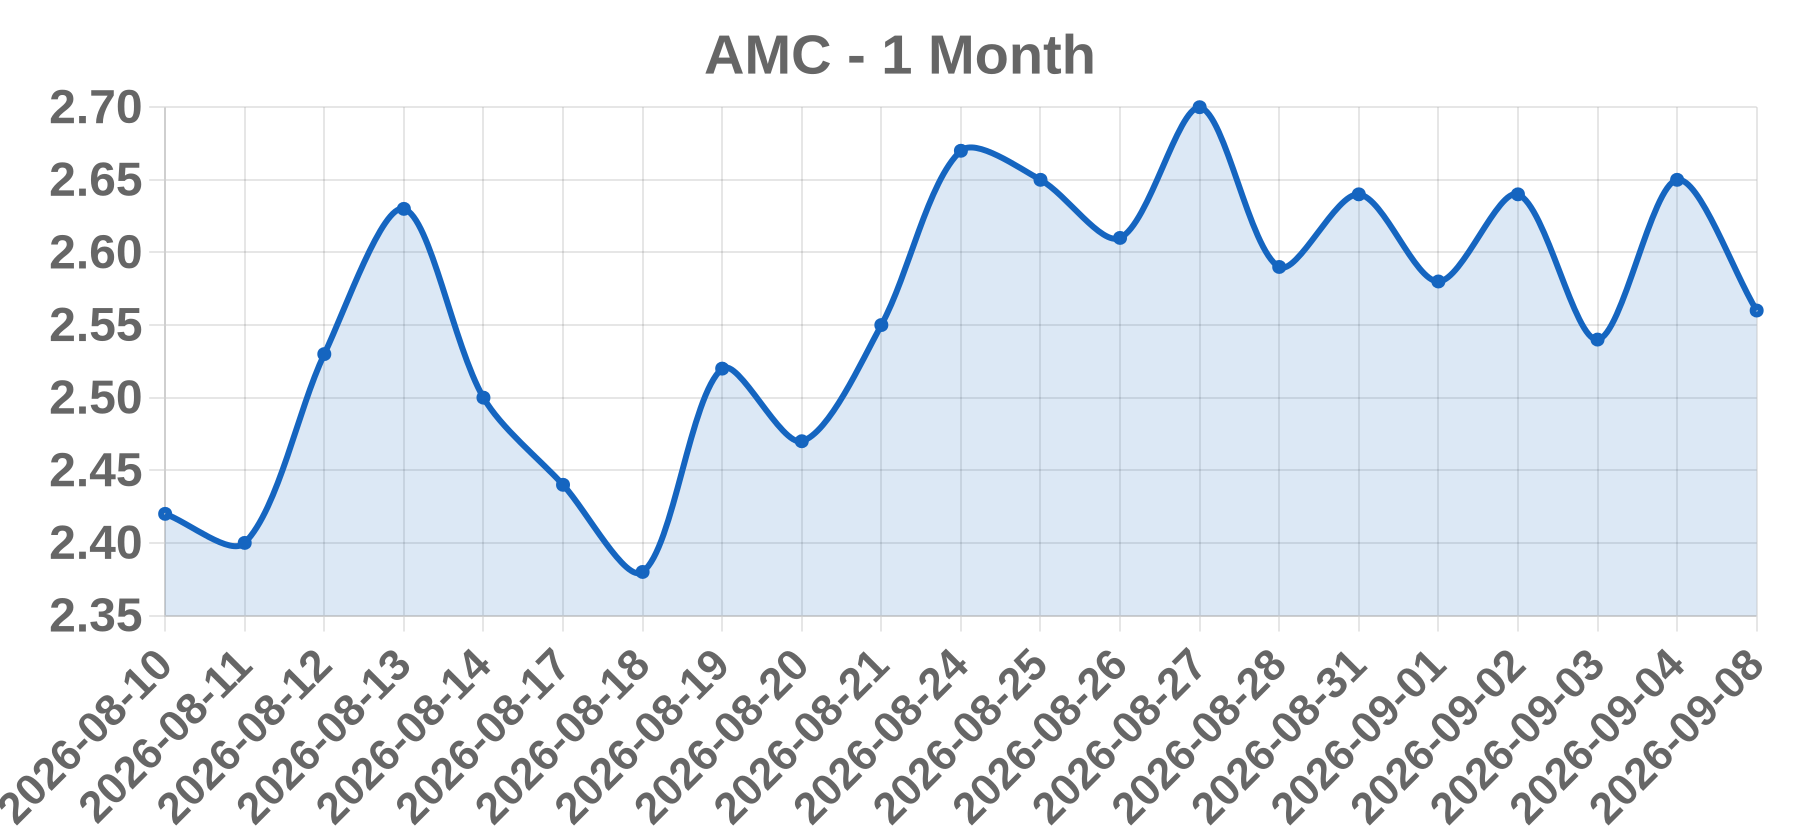
Business AMC Entertainment Holdings, Inc. (NYSE: AMC) is the largest theatrical exhibition company in the US, Europe, and worldwide, operating roughly 850-860 theatres and about 9,600 screens under the AMC Theatres brand. Revenue comes primarily from box-office admissions, food and beverage sales, plus advertising and loyalty/subscription programs.
Today’s take The rally bar (close $2.65, +4.33%, volume 57.21M) corresponds to the Sept 4, 2026 session driven by the CEO feud: on Sept 3-4, AMC CEO Adam Aron publicly attacked Robinhood (Vlad Tenev) over unapproved tokenized AMC 'stock tokens' (one of 190+ names tied to a Robinhood subsidiary's stock-token product), calling them 'inexcusable, vile,' threatening to bring in securities lawyers, and demanding the broker halt trading. Robinhood rebuffed the demand, and a same-name meme coin (MEME/'A Meme Coin') on Robinhood chain exploded, sending retail attention back into AMC. AMC gapped from ~2.54-2.63 to a 2.80 intraday high on 57.0M shares (~1.9x typical, ~40% above the 3-month average), adding ~$98M in market value to a ~$2.37B cap. Note: Sept 7 was the Labor Day holiday, so several feeds record this August/Sept rally bar under the next available session label (2026-09-08); actual Tuesday Sept 8 trading cooled, drifting to ~$2.50-2.56 as the tokenization-bounce faded. Sep 8 also carried a modest PR (Rocket League championship live broadcast at 50 AMC theatres). AMC balancesheet stays strained (~$3.85B debt, negative equity), making token-catalyzed swings headline-driven for this meme-loved s
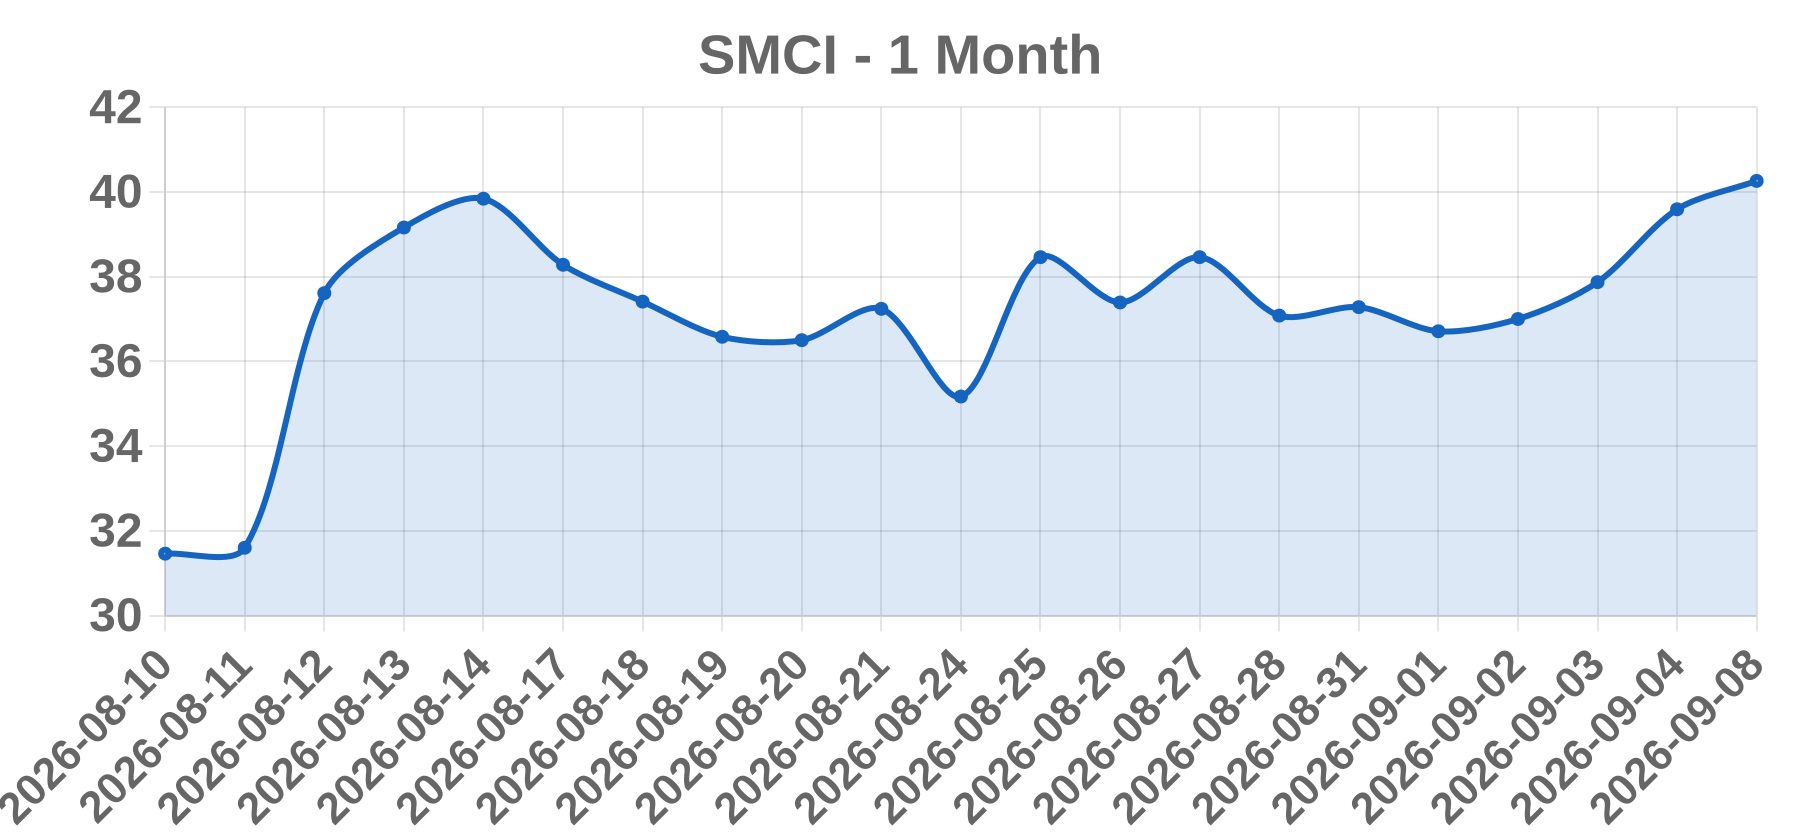
Business Super Micro Computer, Inc. (NASDAQ: SMCI), headquartered in San Jose, California, designs and manufactures high-performance, application-optimized servers, AI acceleration systems, storage, and networking solutions. It is a leading supplier of complete AI-server and liquid-cooled data-center racks (Data Center Building Block Solution) to hyperscalers, enterprises, and cloud providers.
Today’s take SMCI closed the session up 4.54% at $39.59 on about 53.5 million shares, advancing within a broad AI-server/data-center infrastructure rally. The group move was ignited by Dell's blowout quarter, which lifted its FY2027 revenue guidance by ~$25 billion to $192 billion on a record ~$60.9 billion in quarterly AI orders and a $95 billion backlog — validating surging AI-infrastructure demand and pushing peers HP Enterprise near +5%. SMCI was also still riding response to its own Q4 FY2026 results (revenue up 78% to $39.06B; non-GAAP EPS $1.70 vs ~$0.96 consensus) and a 17.6% non-GAAP gross margin that crushed the 8.2%-8.4% guide, though CFO David Weigand called ~75% of the gain non-recurring (deferred contracts, tariffs/inventory). CEO Charles Liang cited $60B+ in new orders and record backlog entering FY2027. Co-founder Sara Liu's Form 144 sales (~0.03% of shares outstanding) were absorbed by buyers. Bears note FY2026 operating cash flow was negative $6.81B on a $12.9B inventory build.
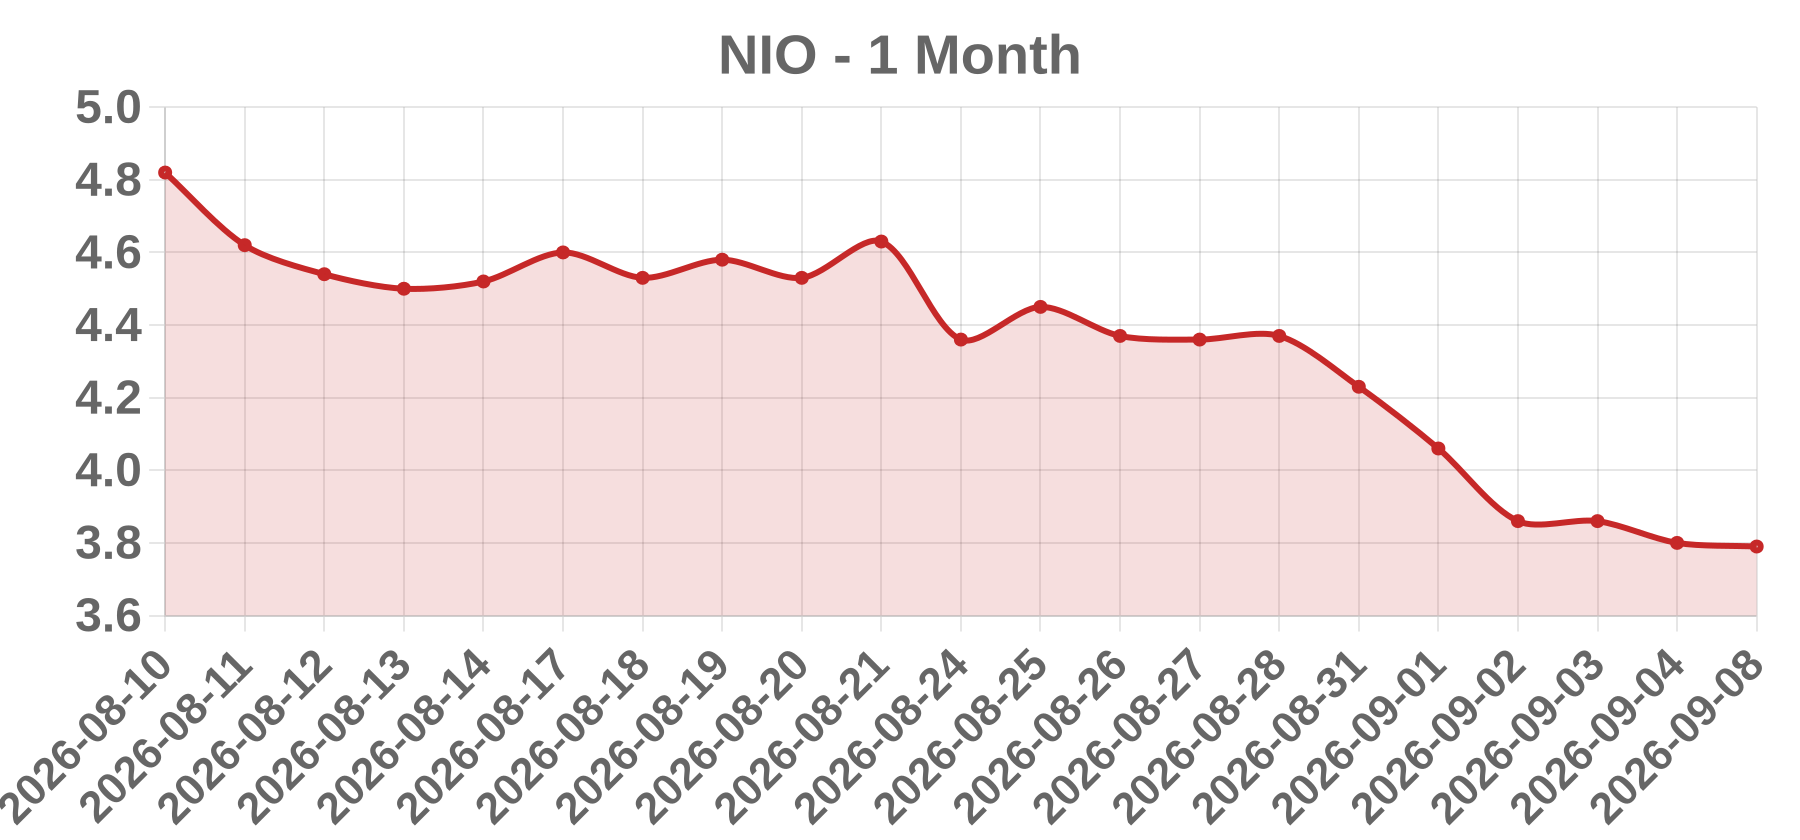
Business NIO Inc. is a Cayman Islands-incorporated, NYSE-listed (ADR) designer, developer and manufacturer of premium smart electric vehicles in China and internationally, offering electric SUVs and sedans, plus battery-swapping/power services and its ONVO and Firefly sub-brands.
Today’s take NIO closed at $3.80 on Sep 8, 2026, down $0.06 (-1.55%), the latest leg of a post-earnings de-rating collapse that has pinned the stock near its 52-week low of ~$3.71 (52-week range $3.71-$8.02). The slide began after Sep 1 Q2 2026 results: revenue rose 69% YoY to RMB32.14B but missed consensus; the net loss narrowed to ~RMB721.6M (~$107M) yet beat analyst estimates, while 3Q delivery guidance of 108k-111k units was viewed as soft. This triggered a wave of downgrades - JPMorgan (Nick Lai) cut to Neutral from Overweight and slashed its price target to $4.50 from $7.00; Freedom Broker moved to Hold with a $4 target; Citi (Jeff Chung) trimmed to $7.10. On Sep 8 itself, China Renaissance () maintained Hold but cut its target to $4.30 (0.5x 2027E P/S), and CPCA published August retail data showing NIO at 35,655 units - a second straight monthly decline. Ongoing demand-supply worries, rising unit costs and persistent 52-week lows kept selling pressure intact.
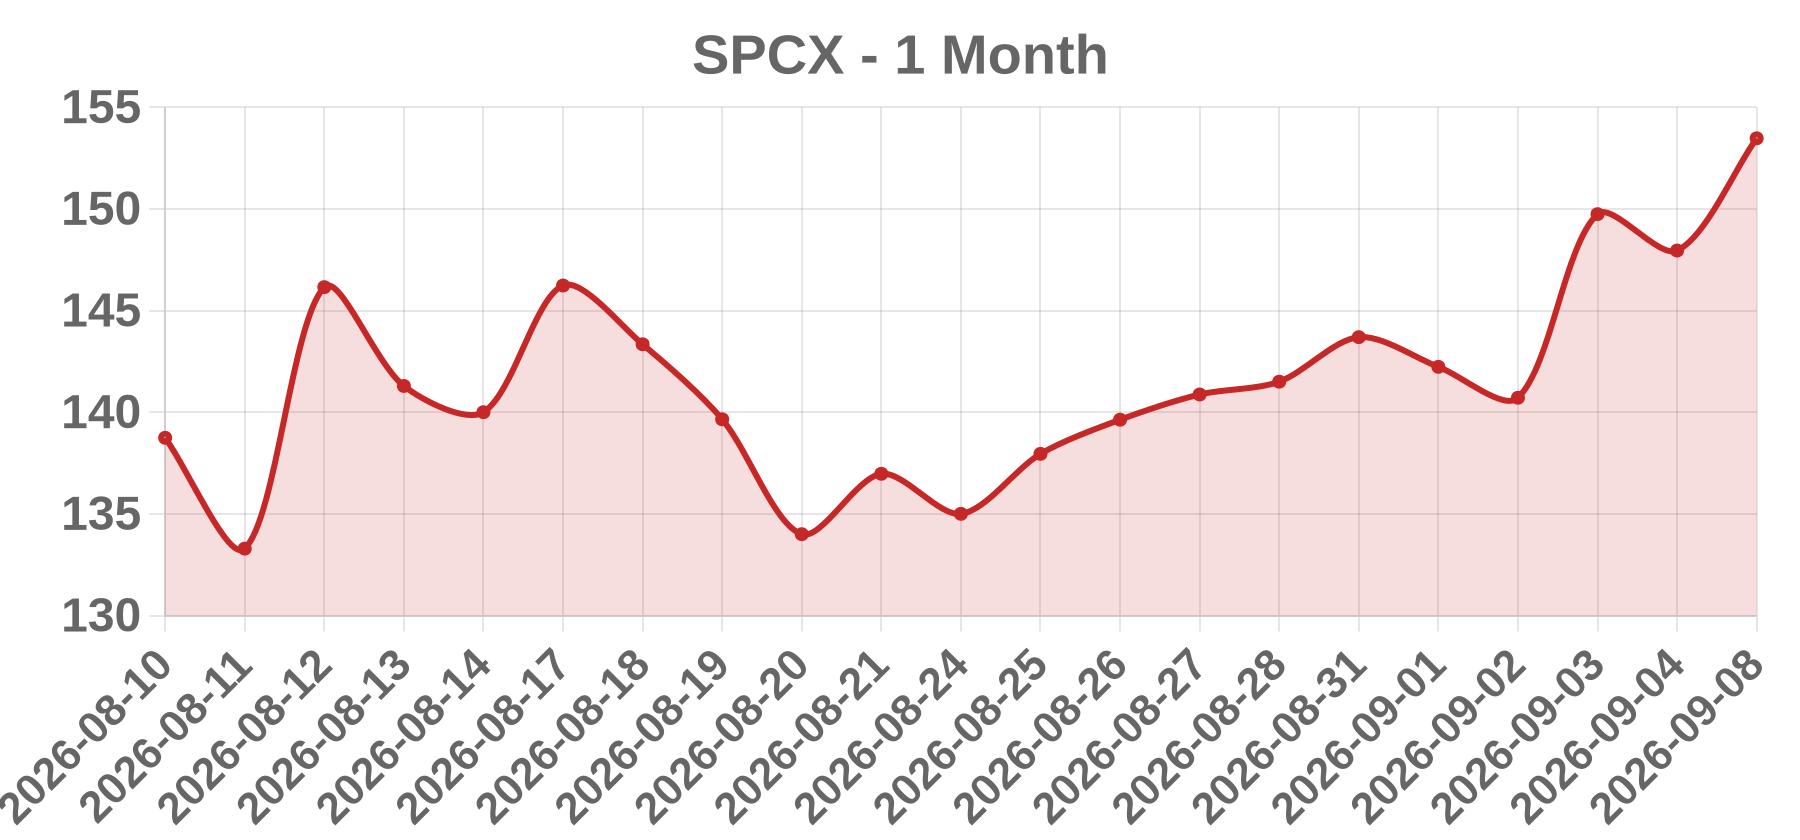
Business Space Exploration Technologies Corp. (SpaceX, NASDAQ: SPCX) is a private-to-public space transportation company founded by Elon Musk, operating launch services, the Starlink satellite-internet constellation, and Starship reusable-rocket development. It trades as a tokenized/listed equity of roughly $2 trillion valuation in 2026.
Today’s take The session closed at $147.95, down 1.80 (-1.20%), on heavy volume near 49.12M shares as traders de-risked ahead of the September 9 lock-up, when another ~319M SPCX shares (~7% of supply) become eligible to sell, followed by ~59M more on Sept 10. This unlock cascades after the Aug 6 release of 911.5M shares that took freely-floating supply from ~639M to ~1.55B. Pivotal Research on Sept 8 initiated coverage with Buy/$220 (≈49% upside from the $147.95 close) tied to Starship reusability, briefly lifting the stock before it 'stalled' near $147.92 and erased early gains. Simultaneously Wells Fargo trimmed its target to $212 from $215, while large short orders (e.g., ~$203M limit shorts near $142) and insider float expansion kept overhead pressure. The stock sits ~34% below its June high of $225.64 and ~44% below Pivotal's $220 base-case target, reflecting supply-overhang uncertainty.
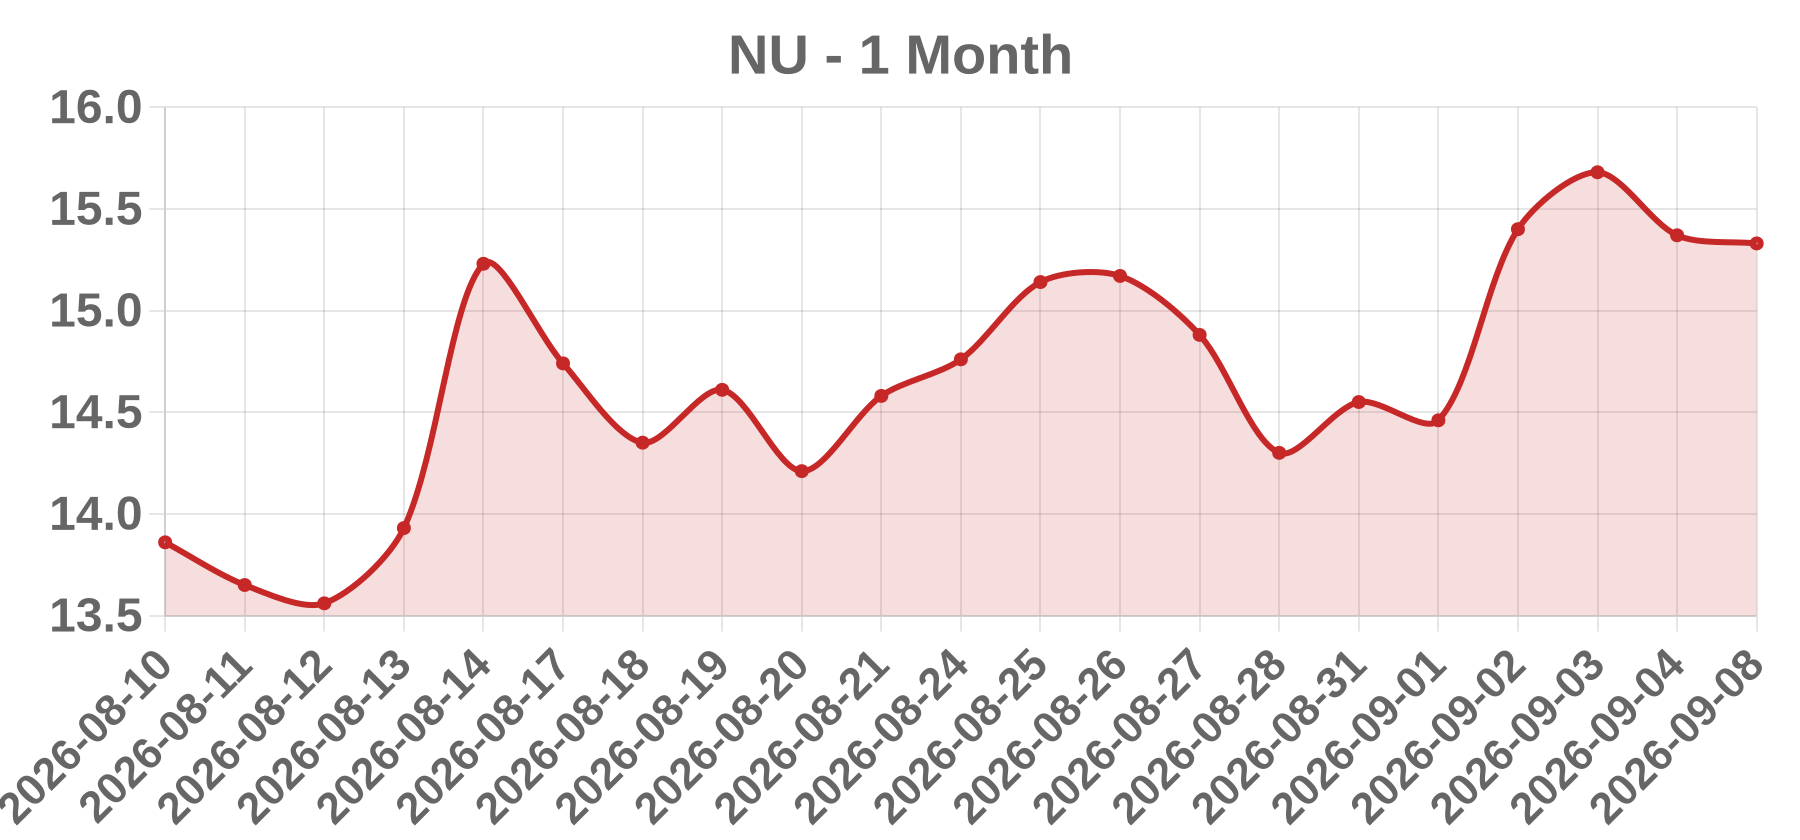
Business Nu Holdings (NU), the NYSE-listed parent of Brazilian digital bank Nubank, fell 1.98% to close at $15.37 in the session under review (the underlying trading date is Thursday, September 4, 2026; note the close data carries the next-open label, as U.S. markets were closed Monday, September 7 for Labor Day). The decline was a broad, macro-driven risk-off pullback rather than a company-specific event. That morning the U.S. Labor Department reported August nonfarm payrolls of 162,000 — far above the ~56,000 consensus forecast — which spiked Treasury yields and revived 'higher-for-longer'/hike fears about the Federal Reserve. Stocks sold off across the board: the S&P 500 fell 0.38%, the Dow 0.51%, and the Nasdaq 0.29%. NU, which trades at a rich ~20x trailing P/E relative to Brazilian bank peers
Today’s take The move on the session in question was overwhelmingly a macro/rates reaction layered on top of post-earnings profit-taking, not a Nu-specific negative. The blockbuster August payrolls print (162K vs ~56K expected) on Sept 4 re-priced rate expectations, sent Treasury yields higher, and pressured richly valued, long-duration growth and emerging-market names. As a high-multiple crossover fintech-bank, NU is especially sensitive to discount-rate moves and to Brazil credit-cycle conditions (elevated Selic and rising late-stage delinquencies). It had already appreciated sharply (~+6.4% on Sept 2 and ~7% off the Aug 13 earnings base) following record $1.06B net income, +39% revenue, a 139M-customer base, and a $1B buyback, leaving it vulnerable to a two-way valuation debate: bulls cite 33% ROE and premium growth, while bears flag ~20x P/E vs ~9x-10x for traditional Brazilian banks and rising loss ratios. So on the down day NU fell proportionally more than the indexes, and Brazilian bank/fintech peers were also under broad pressure on the same rate and credit worries. The below-average volume (~48.6M vs ~66-76M average) confirms the pullback was orderly, low-conviction distribution/profit
Business PG&E Corporation (NYSE: PCG) is a California-based utility holding company whose principal subsidiary, Pacific Gas and Electric, delivers electricity and natural gas across northern and central California to roughly 16 million people. It has massively invested in wildfire mitigation (undergrounding lines, covered conductors, enhanced grid monitoring) after its 2019 bankruptcy tied largely to wildfire liability.
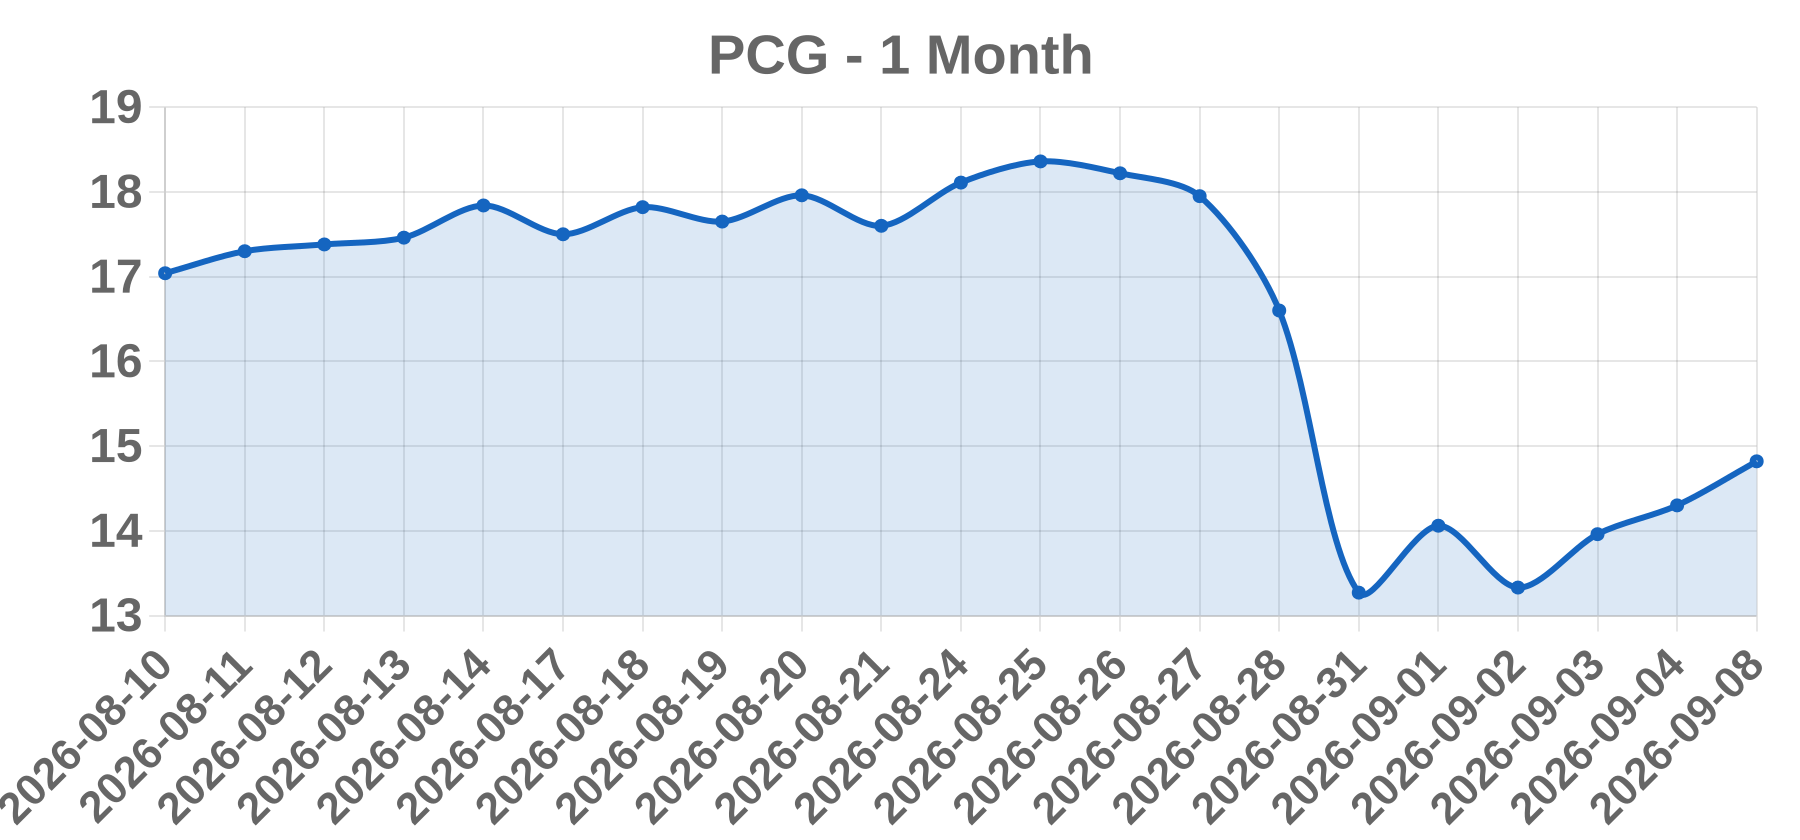
Today’s take The catalyst behind the move is California's SB 492 wildfire-liability saga reaching its denouement. After weeks of negotiation, Governor Newsom's original plan to shift more utility-sparked wildfire cost onto property insurers was stripped out, and the gutted compromise (SB 492) preserved insurers', survivors', and local governments' ability to pursue claims against utilities — with no cap on damages or meaningful new liability protection. Utilities including PG&E, Edison and Sempra vocally opposed it. On Tuesday September 1, 2026 (the final day of the legislative session), the Assembly declined to take it up and the bill died without a vote. Markets first cratered PCG ~18% (to a ~$13 low / 52-week low $13.045) when it looked like an adverse version might pass, then rebounded sharply on the bill's outright death, which removed the near-term financing/liability overhang PG&E feared. PG&E reinforced the bounce on Sept 2 by launching a Strategic Review, deferring ~$2B of planned 2027 capex (while keeping ~$11.4B of California investment), reaffirming 2026 core EPS guidance of $1.64-$1.66 and framing 2027 guidance of $1.78-$1.82. The Google-backed SHARE virtual power plant pilot (~21,
Business American Outdoor Brands, Inc. (NASDAQ: AOUT) is a designer and distributor of outdoor recreation products and accessories. Its portfolio spans shooting, hunting, outdoor lifestyle, and preparedness/camping categories, marketed through well-known brands. The company serves both commercial channels and consumers and has had a presence in the outdoor industry with roots in the Smith & Wesson heritage of firearms accessory, cutlery, and outdoor gear given the historical corporate lineage of American Outdoor Brands.
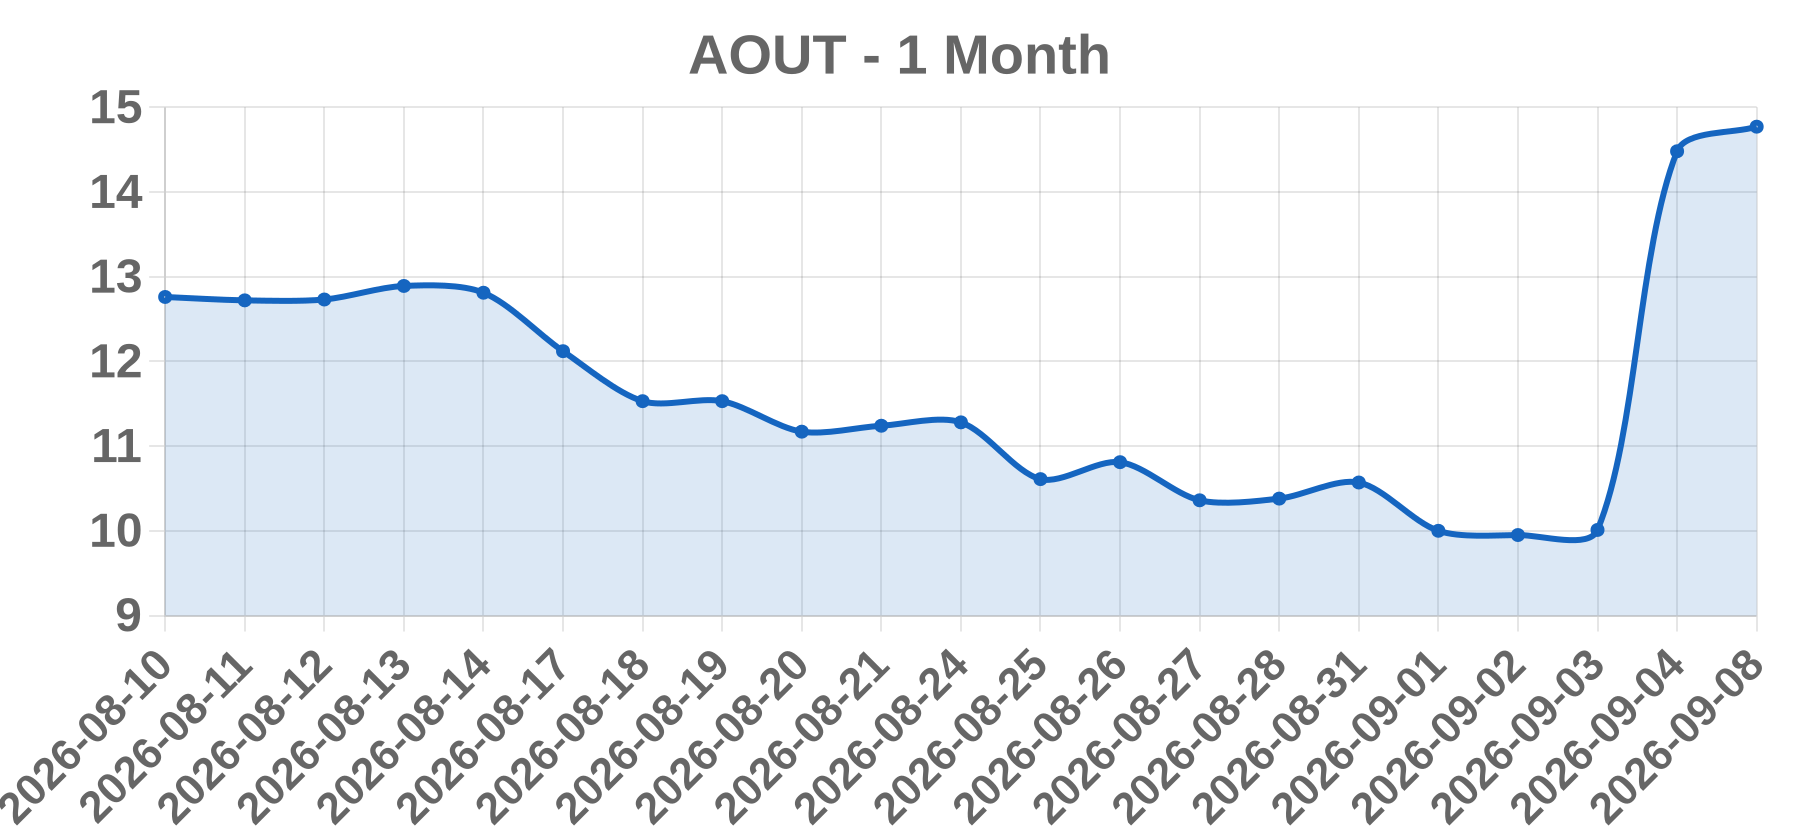
Today’s take American Outdoor Brands (AOUT) surged about 45% on Friday, September 4, 2026, closing at $14.48, up $4.47 (+44.66%), after the company reported fiscal Q1 2027 results after the close on Thursday, September 3, 2026 that decisively beat expectations. The report showed a swing to profitability: non-GAAP EPS came in at $0.03 versus a much deeper expected loss (consensus around -$0.24 to -$0.30) and versus -$0.26 in the year-ago quarter, while net sales reached $37.3 million, up 25.4% year over year from $29.7 million and above the ~$35.6-36.6 million consensus. Management noted that even after adjusting for the prior-year order-acceleration calendar effect, underlying revenue grew about 4.3%. The company maintained full-year fiscal 2027 net sales guidance of $200-210 million (implying roughly 5-10% growth over fiscal 2026's $190.5 million) with adjusted EBITDA margins of 7.3-8.3%, characterized as the foundation of a new growth trajectory after several years of decline. Sentiment was reinforced by an earnings-call narrative crediting product innovation and a retail turnaround. The move was especially notable because the broad market fell on the same Friday (Dow -250+ points) on a hot A
Business Greenpro Capital Corp. (GRNQ) is a Nevada-registered, Nasdaq-listed micro-cap business-services and venture company headquartered in Kuala Lumpur, Malaysia. It provides financial consultancy, tax planning, company formation, cross-border listing advisory, trust/wealth management, Shariah-compliant digital asset exchange, and real estate/venture services to SMEs mainly across Asia. Revenue (TTM) is ~$2M with recurring net losses and auditors citing substantial doubt about going concern.
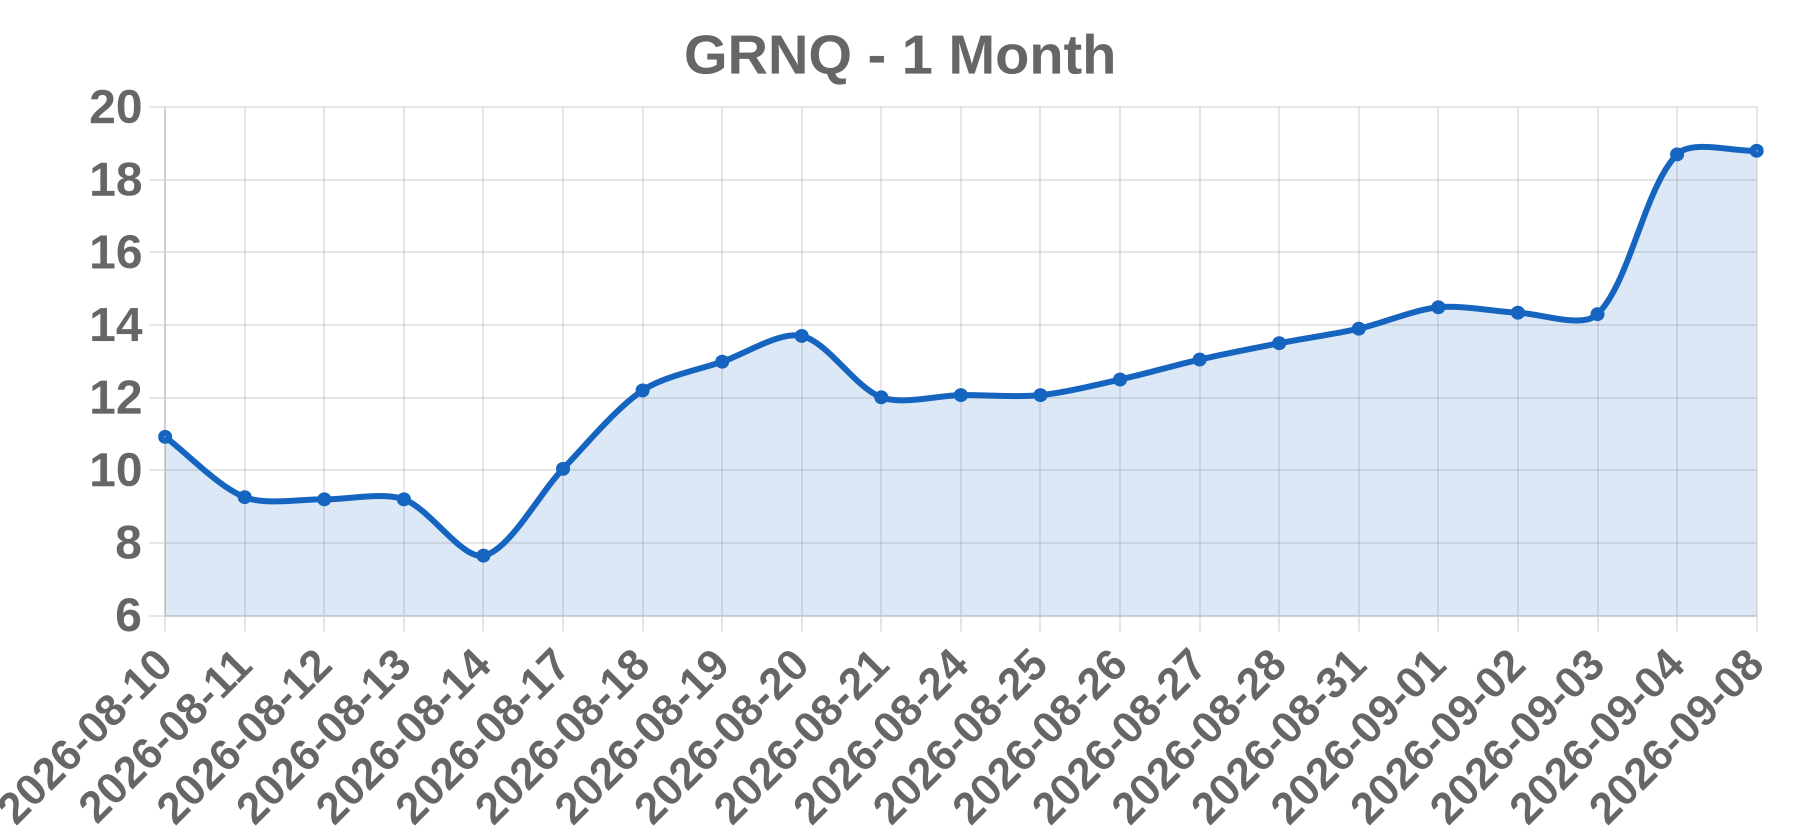
Today’s take The ~+30.77%/$18.70 move the user flags for the 2026-09-08 session shows a data-date discrepancy across vendors; Sina, Fidelity and stockanalysis attribute that exact +30.77% run ($14.00-ish to $18.70) to Sep 4, while Yahoo/10jqka show Sep 8 opened $18.01, spiked to a $22.70 intraday high before fading to ~$18.80 on volume near 727k vs ~62k average. Fundamentally, no fresh company announcement matched the surge. Instead, the springboard is structural: a 1-for-10 reverse split took effect Aug 6, 2026, cutting shares outstanding to ~1.8M with a public float of ~4M to keep Nasdaq listing compliance after an April AI-acquisition (Forekast) and after numerous August volatility-driven trading pauses on this thin, low-priced stock. With a ~$26-34M market cap, ~$2M revenue, persistent net losses, going-concern doubts and heavy retail chatter of squeeze/momentum, this is best read as a speculative, thin-float retail/momentum run, not an earnings or fundamental catalyst. High volatility and extreme data noise warrant caution.
Business GRI Bio, Inc. (NASDAQ: GRI) is a La Jolla, California-based clinical-stage biopharmaceutical company developing therapies for inflammatory, fibrotic, and autoimmune diseases. Its lead program, GRI-0621, is an oral small-molecule RAR-beta/gamma dual agonist that inhibits type 1 invariant Natural Killer T (iNKT) cell activity, in Phase 2a development for idiopathic pulmonary fibrosis (IPF).
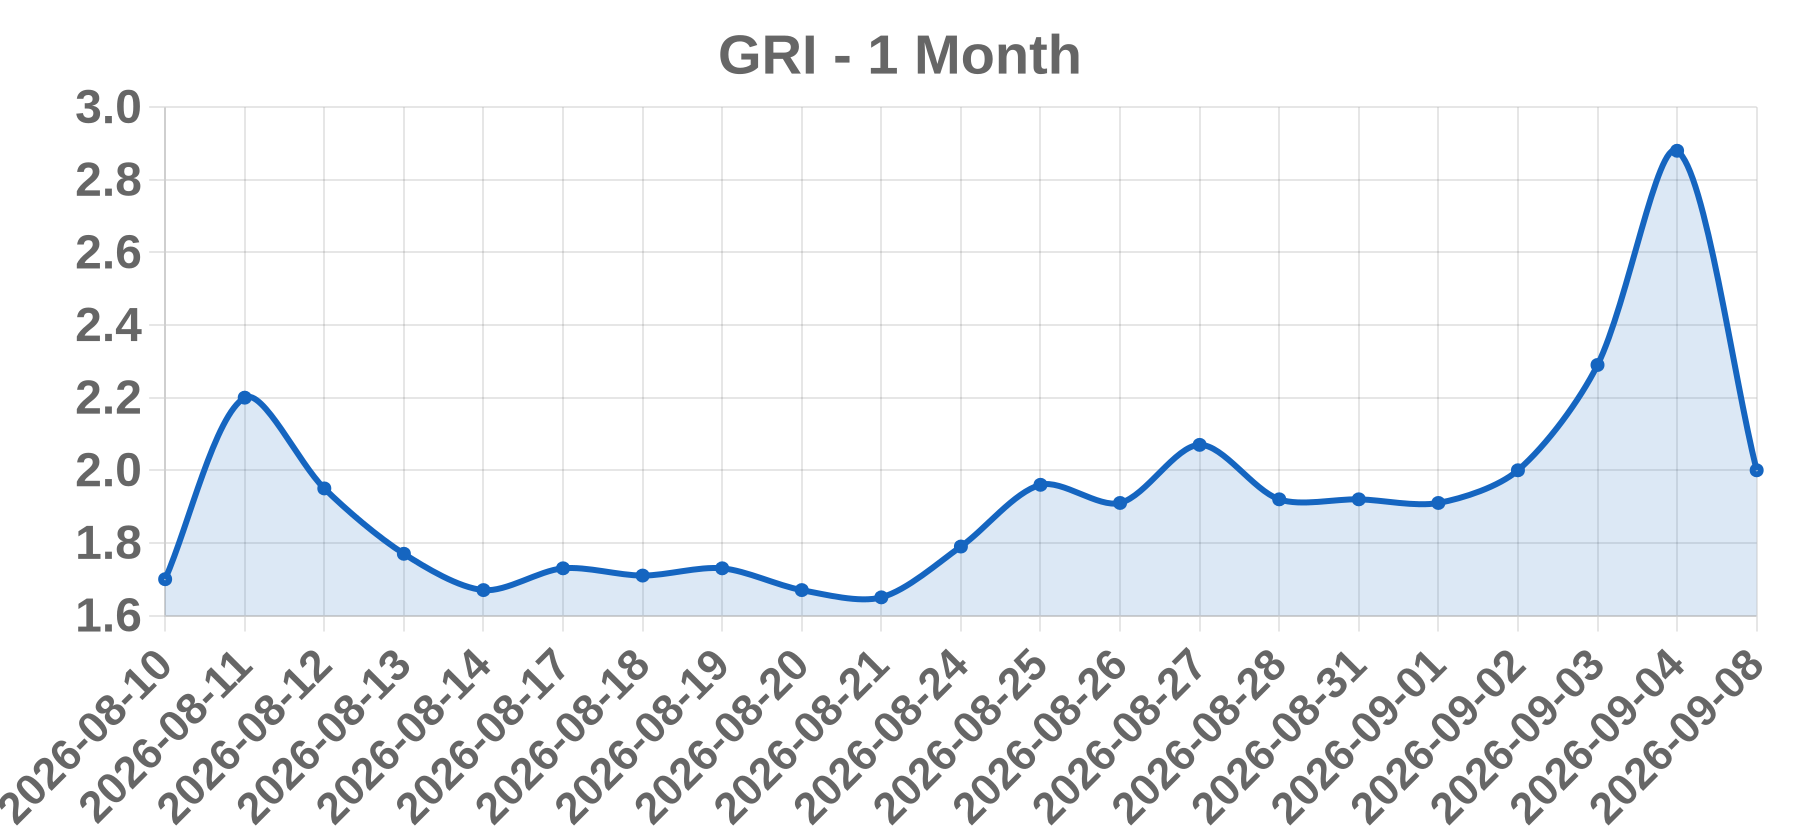
Today’s take The strong +25.76% climb to $2.88 (a 7.27M-share session) reflects pre-event momentum into GRI-0621's late-breaking Phase 2a IPF data slated for presentation at the 2026 European Respiratory Society Congress (Sept 6), with the full mechanistic press release following Sept 8. The ERS findings were positive across multiple pillars: 39% of GRI-0621 patients achieved an FVC increase of ≥30 mL at Week 12 vs 20% on placebo (rising to 50% on background SOC antifibrotics); only 8% of treated patients suffered an FVC decline of ≥10% vs 20% placebo, a 60% relative reduction in accelerated-decline events; placebo-adjusted FVC change was +99 mL overall and +139 mL with SOC. An amended 13G disclosed fresh institutional ownership, adding conviction. Note a data-label quirk: WSJ/wire sources tag this snapshot to the Sept 8 reference date, whereas the +25.76%/2.88 print actually belongs to Sept 4 (last close before the ERS event); the actual Sept 8 session subsequently fell ~30% to ~$1.99 as good news was already priced in. The company runs on ~$11M cash, no long-term debt and ~4 employees after a Jan 2026 1-for-28 reverse split, making this a high-risk, binary clinical catalyst trade.
Business Xtend AI Robotics, Inc. (NYSE: XTND) is an Israeli-founded defense and robotics company that develops XOS, a hardware-agnostic operating system for autonomous drones and robots ("physical AI"). It went public via a ~$1.5 billion reverse merger with JFB Construction Holdings, listing on the NYSE under XTND effective September 4, 2026.
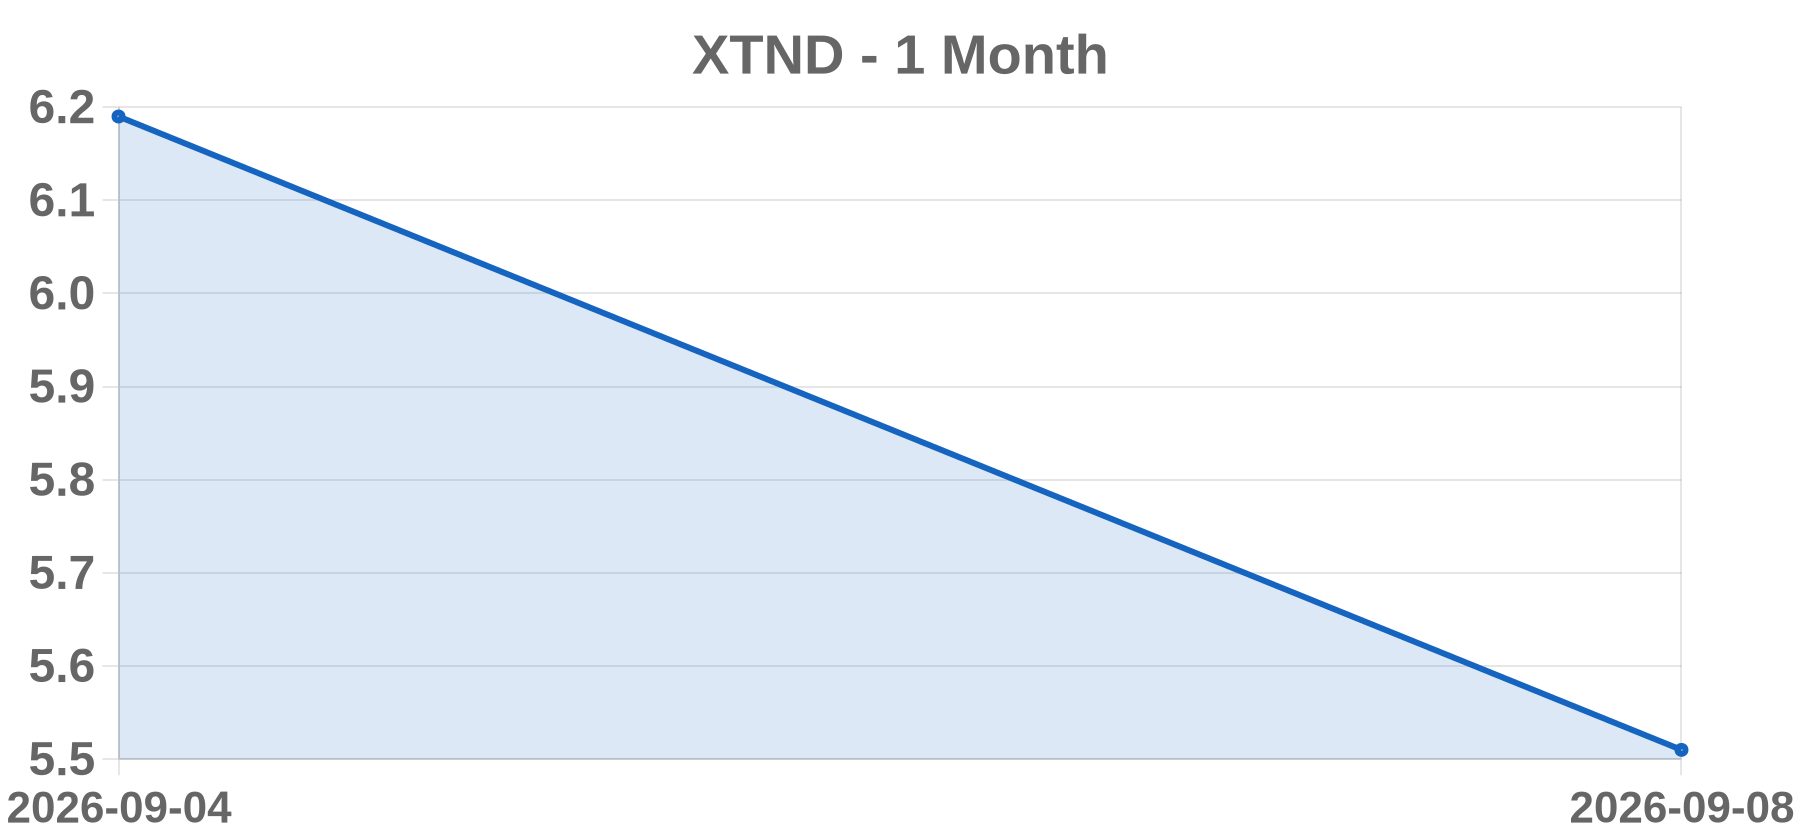
Today’s take XTND's +25.18% gain (closing ~$6.19 vs. a ~$4.94 reference price) reflects the listing-driven pop of its debut as a new NYSE ticker following the completed $1.5B reverse merger with JFB Construction Holdings (the shell's last pre-deal JFB levels were near the reference). Covering the move, media highlighted the initial first-day surge plus a formal NYSE opening-bell ceremony on September 8, 2026, and fresh CEO visibility: an exclusive Benzinga interview (Aviv Shapira on "operational learning velocity") and a Globes interview published Sept 8 reinforced the software-defined defense thesis. Fundamentals remain stretched relative to price: ~$20M 2025 revenue with a $26.8M net loss, and Q1 2026 revenue of $5.8M against an $11.5-11.6M net loss. Trading is extremely thin for the newly-listed, heavily-splitting stock (essentially zero reported volume), so the price print is noisy and should be treated cautiously.
Business Mannatech, Incorporated is a micro-cap Texas-based health-and-wellness company (market cap roughly $17M at the time) operating a direct-selling / network-marketing model across North America, Asia, Europe and Africa. It develops and sells nutritional supplements, topical skincare and weight-management products through independent associates, plus a separate cross-border e-commerce platform in mainland China. The stock trades on the Nasdaq Capital Market (MTEX).
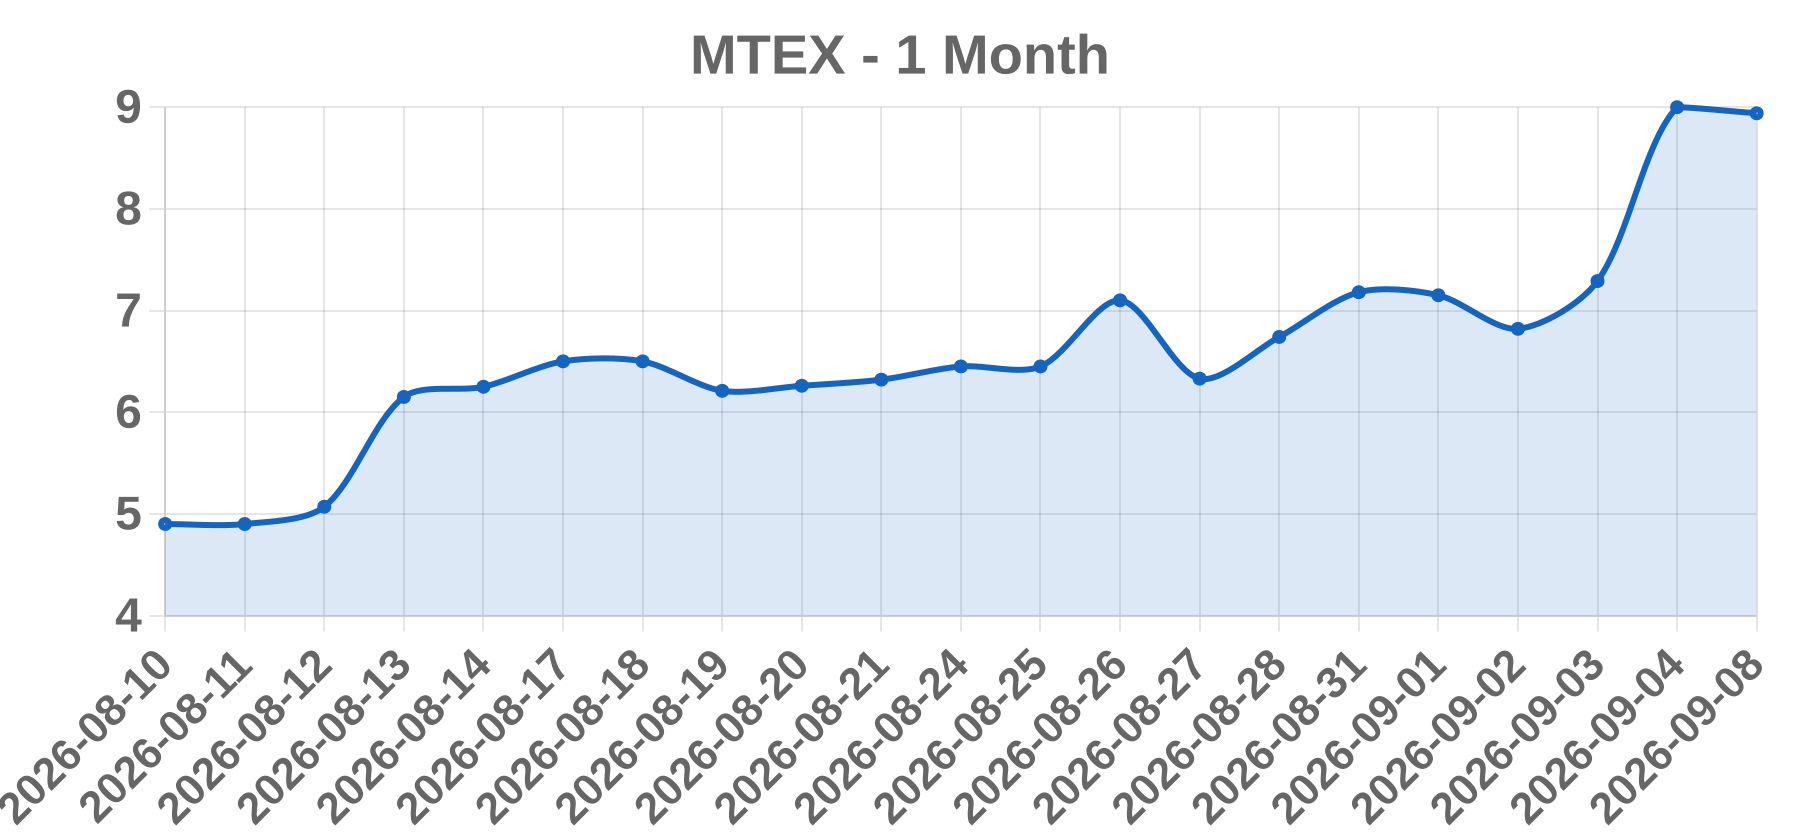
Today’s take The data point (close 9.00, change +1.71, +23.46%) matches the Friday, September 4, 2026 session exactly: prior close 7.29, open 8.05, high 9.20, low 7.40, close 9.00, on 76,870 shares (well above the typical 18-41K), with after-hours strength to ~9.45. Because Monday September 7, 2026 was the U.S. Labor Day market holiday, the September 8 session was the next trading day (open 9.03, high 9.65, close 8.94, -0.67%), so the 'session close date 2026-09-08' in the prompt is a shelf/metadata label while the price/change belong to the Sept 4 close. The surge was not driven by an earnings report. Instead, it was a retail-led 'tiny float' speculative/momentum play on this micro-cap (shares float roughly under ~0.6-0.8M, Stocktwits message volume reportedly up ~9,900% over seven days with sentiment ~99/100 'extremely bullish'). This coincided with a tangible corporate-governance catalyst: Mannatech announced (8-K; notice Aug 26, published Sept 1) the retirement of 25-year Chairman J. Stanley Fredrick (age 87) and the appointment of former Avon International President Robert Toth (40+ years of direct-selling experience, with operations once spanning 120+ countries and >$5.5B revenue) as Chai
Business Quanex Building Products Corporation (NYSE: NX), founded 1927 and headquartered in Houston, Texas, designs, manufactures, and distributes engineered components for window, door, and building products OEMs in North America and Europe. Its segments (Hardware, Extruded, Custom Solutions) supply vinyl profiles, insulating glass spacers, and hardware following the 2024 Tyman plc integration.
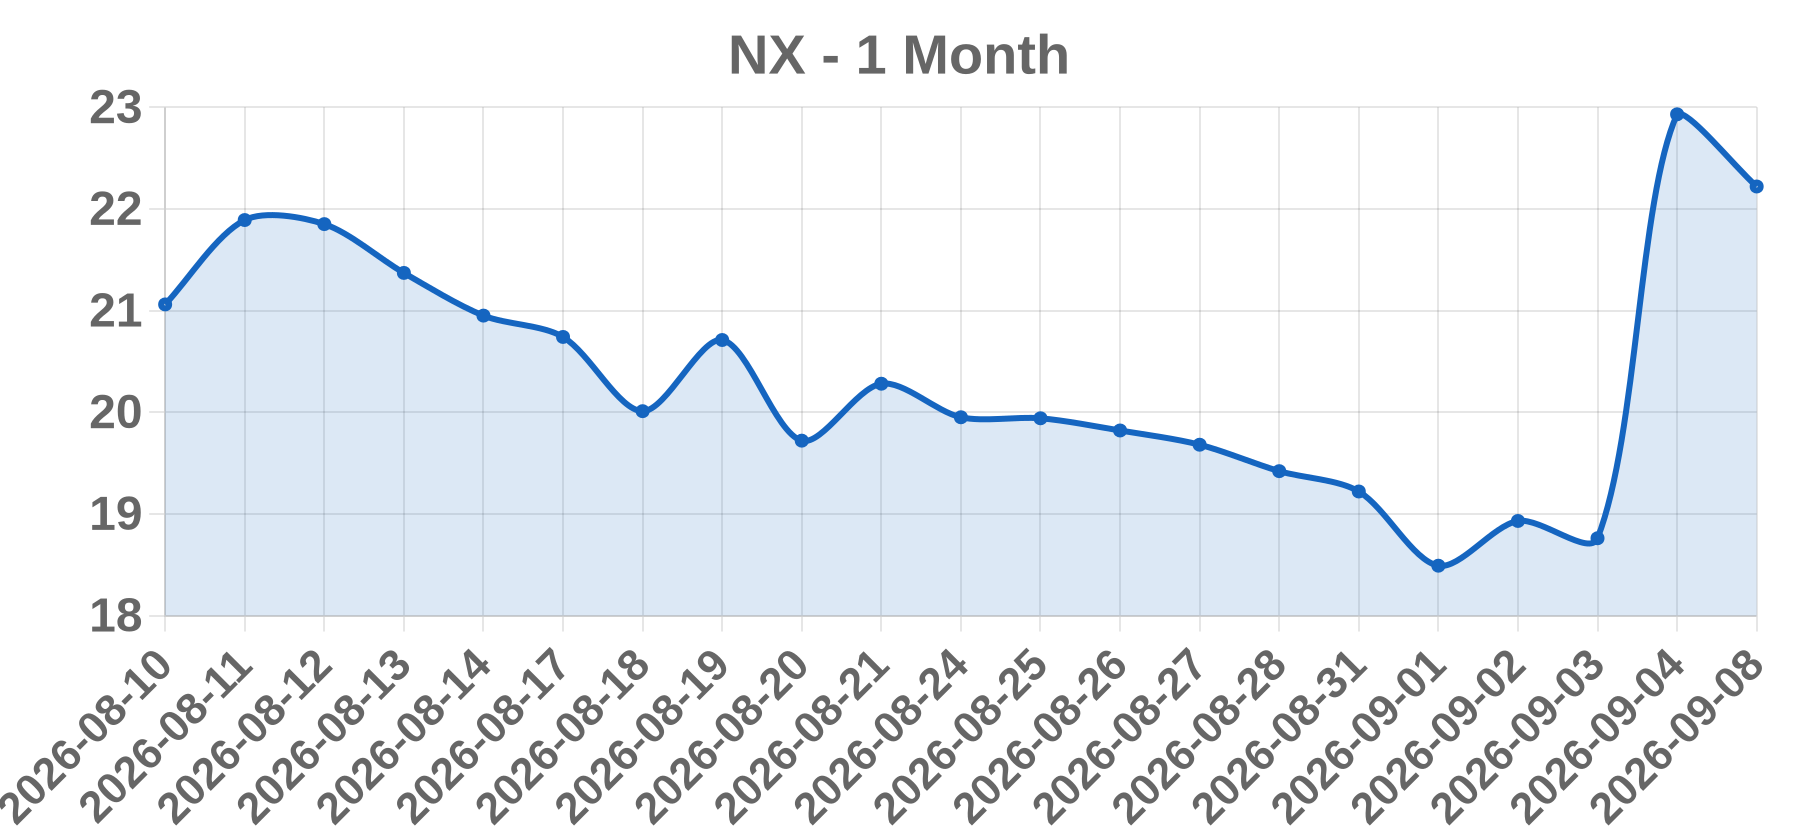
Today’s take After market close on Sept 3, 2026, Quanex reported fiscal Q3 adjusted EPS of $0.79, beating consensus of ~$0.65 by ~$0.14, on net sales of $501.8M (+1.3% YoY), above ~$497.5M estimates; GAAP net income swung to $26.5M ($0.58/sh) vs a year-ago $276M loss driven by a $302.3M goodwill impairment. Management guided Q4 revenue growth of 2-3% with 50-75bp adjusted EBITDA margin expansion, cited debt repayment of $42.25M, lowered leverage to 2.8x, and flagged moderating inflation with targeted mid-single-to-low-teens price increases. The crush beat plus constructive outlook drove the stock ~+22.23% from ~$18.76 to a $22.93 close with a 52-week high of $23.23, while peers/stocks continued tracking tariff and US housing demand headwinds.
Business bioAffinity Technologies, Inc. (Nasdaq: BIAF) is a San Antonio, Texas-based biotechnology company developing noninvasive solutions for the early detection, monitoring, and treatment of lung disease and cancer. Its lead product, CyPath Lung, is a noninvasive sputum-based flow cytometry and AI diagnostic test marketed as a laboratory developed test (LDT) through its CLIA-certified, CAP-accredited subsidiary Precision Pathology Laboratory Services.
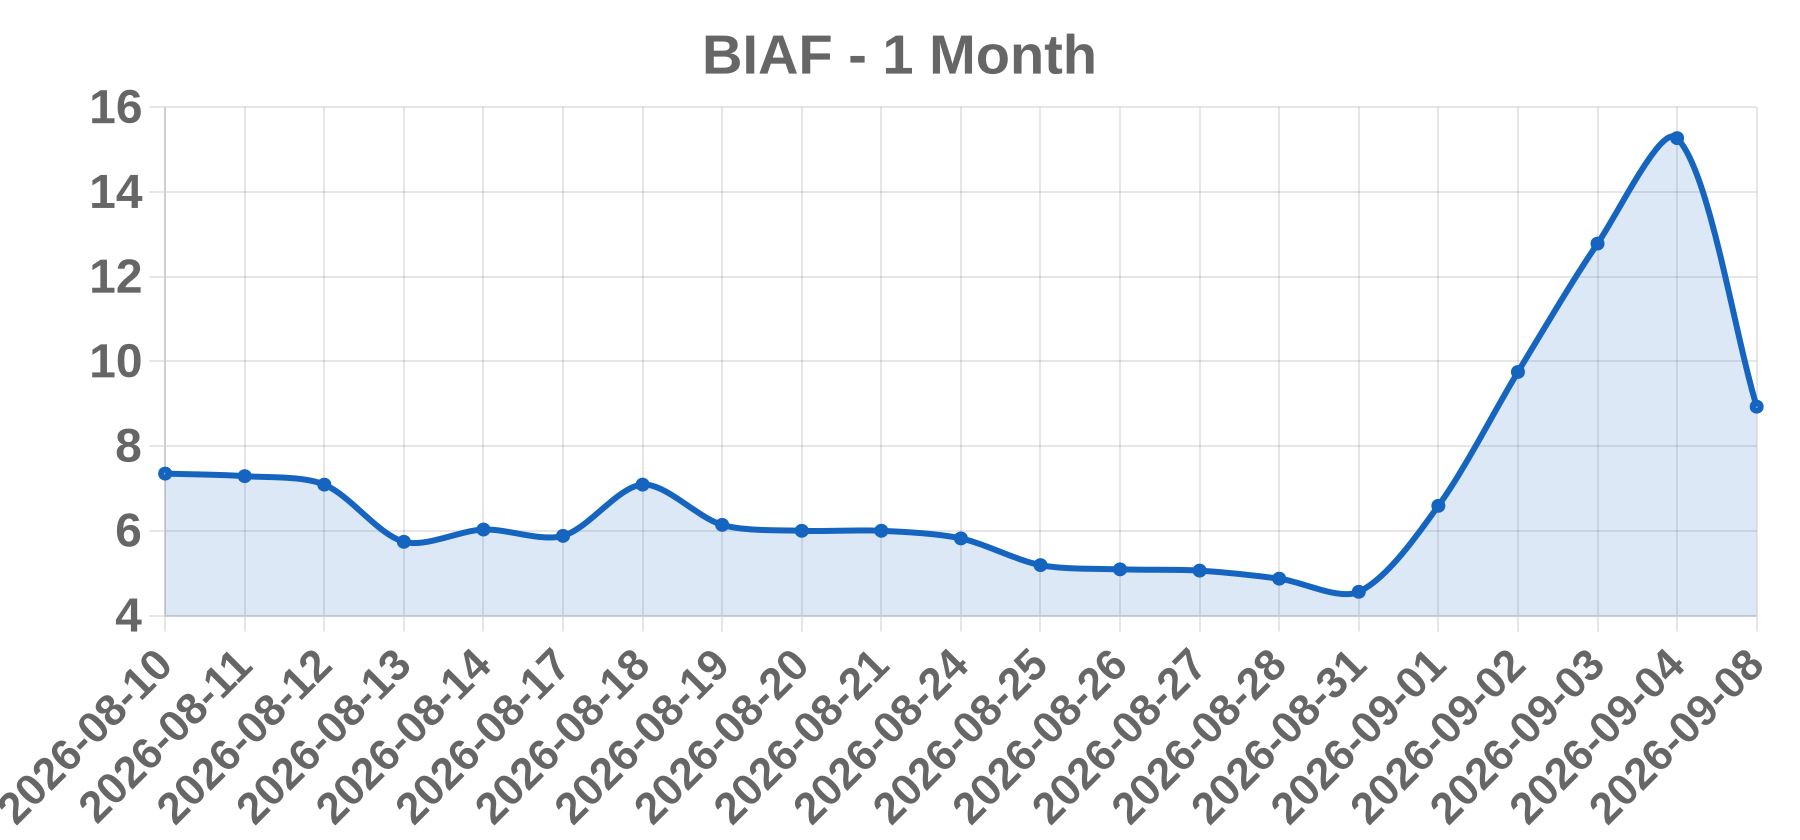
Today’s take NOTE: the row price/change data (close $15.27, +19.48%) verifiably corresponds to the Friday, September 4, 2026 close per StockAnalysis, Yahoo, Sina and Baidu, rather than a September 8 session. The +19.48% gain capped a four-session speculative vertical run (Sept 1: +44.52% to $6.59; Sept 2: +47.95% to $9.75; Sept 3: +31.08% to $12.78; Sept 4: +19.48% to $15.27). The catalyst was the September 1, 2026 announcement that bioAffinity would advance CyPath Lung for post-treatment surveillance of the 680,000+ US lung cancer survivors, expanding the test's commercial use beyond first-line screening despite no new clinical data. The move was amplified because the 1-for-15 reverse stock split effective August 24, 2026 cut shares outstanding to ~592,373 (tiny float), magnifying volatility. September 4 trading saw ~20.1M shares change hands (~$306.7M dollar volume), representing turnover far exceeding the entire float, characteristic of heavy momentum/retail speculation given the stock had fallen ~95% over the prior year.
Business Pro-Dex, Inc. (NASDAQ: PDEX), headquartered in Irvine, California, designs, develops, manufactures, and sells powered surgical instruments for medical device original equipment manufacturers (OEMs). Its portfolio includes autoclavable, battery-powered, electric, and multi-function surgical drivers and shavers used primarily in the orthopedic, thoracic, and craniomaxillofacial markets.
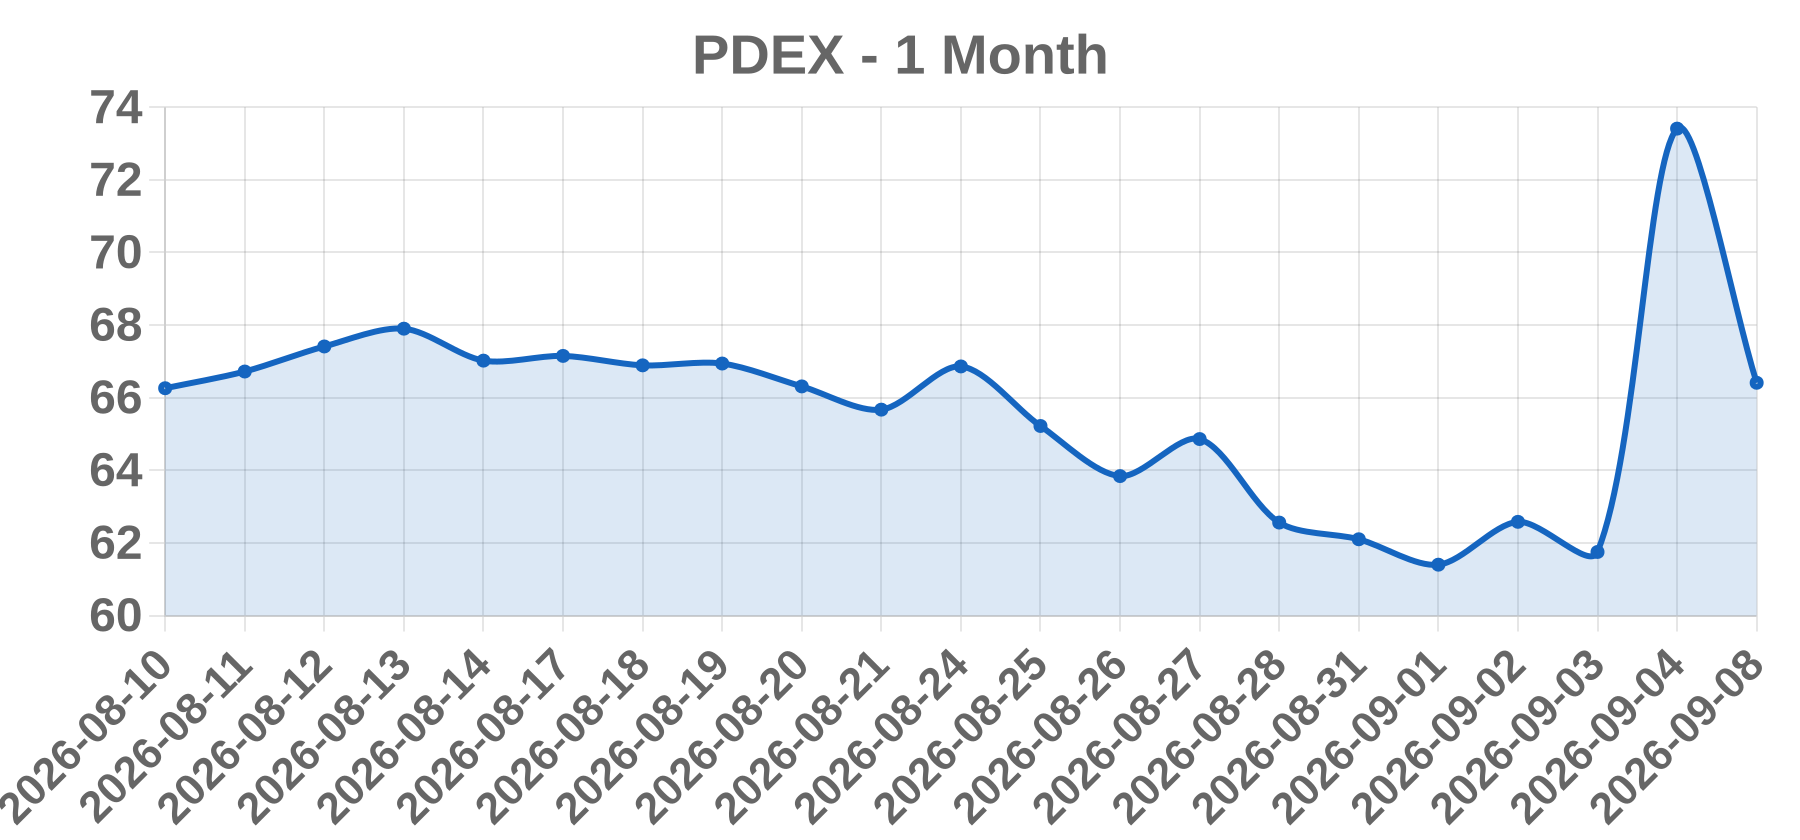
Today’s take Pro-Dex surged +18.88% (+$11.66) to close at $73.41 after reporting strong fiscal Q4 and full-year FY2026 (ended June 30, 2026) results on Thursday, September 3. Q4 net income more than doubled to $2.86M ($0.87/share) from $1.20M ($0.36/share) a year earlier, beating EPS estimates by $0.21, while net sales rose 17% to $20.41M versus the ~$19.4M consensus. Full-year net income jumped to $13.66M ($4.12/share) from $8.98M ($2.67/share) on 16% higher net sales of $77.55M. Gross margin expanded sharply from ~20% to ~35% in Q4 on better volume, mix, and absorption. Driven by higher orthopedic handpiece sales, the stock ran as high as a 52-week high of $77.00 during the session (range: $23.47-$77.00). Note: the +18.88% move reflects the September 4, 2026 close (prior close $61.75); Sept. 7 (Labor Day) market closure and data capture timing explain the 2026-09-08 session label.
Business Katapult Holdings, Inc. (Nasdaq Global Market: KPLT) is an Atlanta, Georgia-based financial technology company providing omnichannel lease-to-own financing to nonprime U.S. consumers at the merchant point of sale. Following the August 11, 2026 all-stock combination with The Aaron's Company and CCF Holdings (CCFI), it operates as a scaled platform via its Katapult Pay app, Aaron's and CCFI retail/e-commerce brands.
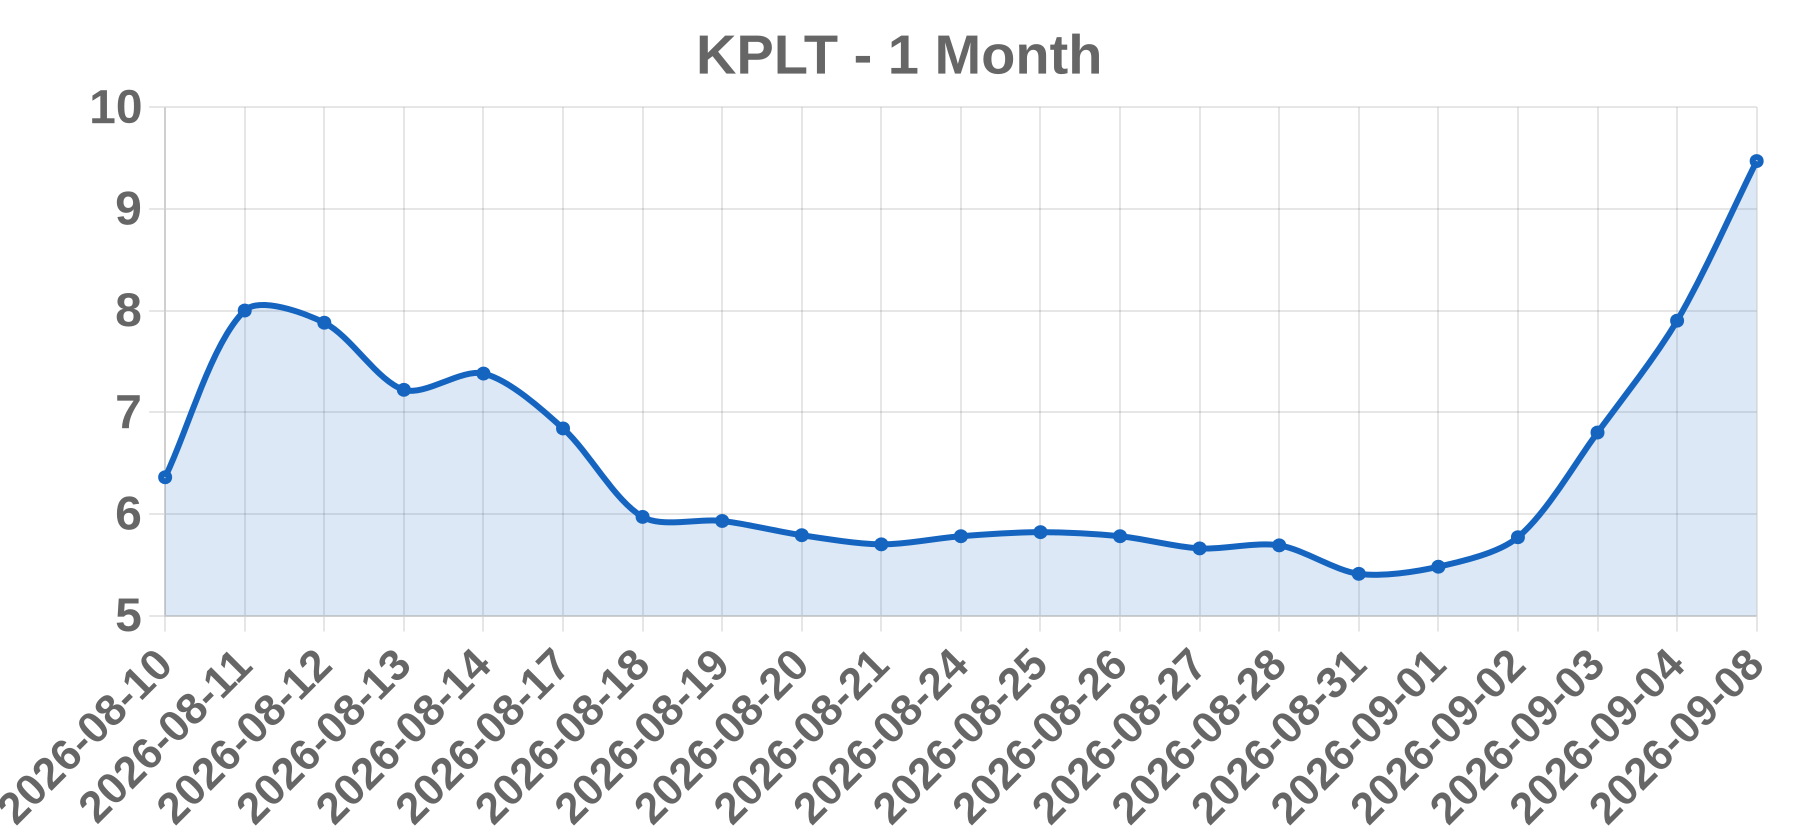
Today’s take KPLT surged roughly +19.9% on Sept 8, 2026 to close near $9.47 (from the ~$7.90 prior close), with a 1-week gain of +38.8% as the market re-rated the newly merged company. The core driver is the Aug 11, 2026 closing of the all-stock reverse combination with The Aaron's Company and CCF Holdings, which created a combined ~$4B nonprime financial-services platform with ~$460M in pro forma 2025 adjusted EBITDA (combined company ~76.8M shares). Supporting bullish catalysts include removal of the going-concern overhang (Katapult dismissed Grant Thornton and named Elliott Davis, PLLC as auditor on Sept 2, whose reports had carried substantial-doubt language), a $200M/$75M term-loan financing, and Loop Capital maintaining a Hold with a $12 PT (vs ~$9.47 stock). Traders also reacted to the first quarter (Sept-ending) expected to reflect full merged operations from the Aug 11 close. Note: intraday sources differ widely on this low-float name; some feeds show the Sept 8 close at $9.46-$9.47 (+19.6-19.9%) while older snaps dated the move to $7.90.
Business Concrete Pumping Holdings, Inc. (NASDAQ:BBCP) is the largest provider of concrete pumping services in the United States. Through its Concrete Pumping and Eco-Pan brands, the company rents concrete pumping equipment and provides related services across commercial, infrastructure, and data-center construction markets.
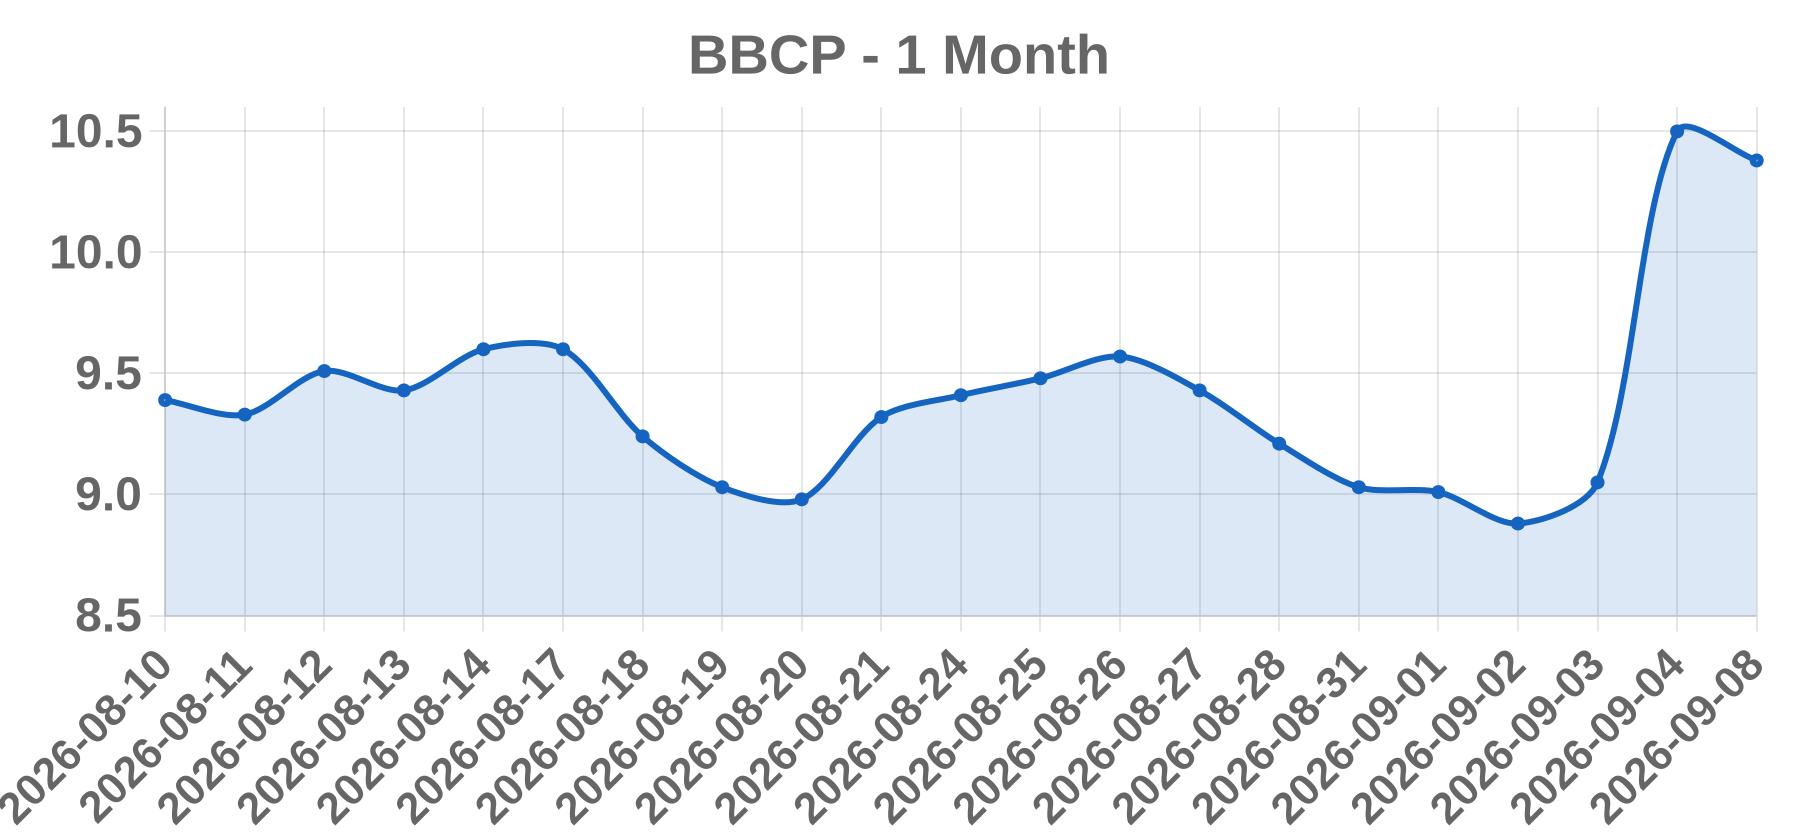
Today’s take BBCP surged +16.02% to $10.50 after the company reported fiscal Q3 2026 results on Sept 3 (after close). Revenue rose ~12.6% Y/Y to $116.8M, beating consensus of ~$109.66M, while EPS of $0.09 (GAAP) exceeded estimates of $0.08; the Seeking Alpha summary cited adjusted EPS of $0.12 beating by $0.03. Management raised full-year fiscal 2026 revenue guidance to $425-$435M (from $410-$425M) and adjusted EBITDA to $98-$105M, citing strong U.S. commercial, infrastructure, and data-center demand (now 10-12% of revenue). The board also initiated a quarterly dividend of $0.13/share ($0.52 annualized, ~5-6% yield). The big one-day move occurred at the Sept 4 close (the first session after the after-hours report). Note: the research flag indicates session date 2026-09-08, but price history (Yahoo, StockAnalysis, Fidelity) shows the $10.50 close, +$1.45 (+16.02%), date-stamped September 4, 2026.
Business CBL International Limited is a Cayman Islands-incorporated holding company listed on the Nasdaq Capital Market (ticker BANL) that operates as a marine fuel logistics and bunkering facilitator, part of the Banle Group, across the Asia-Pacific region. It buys and resells marine fuels — fossil VLSFO as well as LNG and biofuel — to ship operators through local physical distributors and traders. Founded in 2015 and headquartered in Kuala Lumpur, Malaysia.
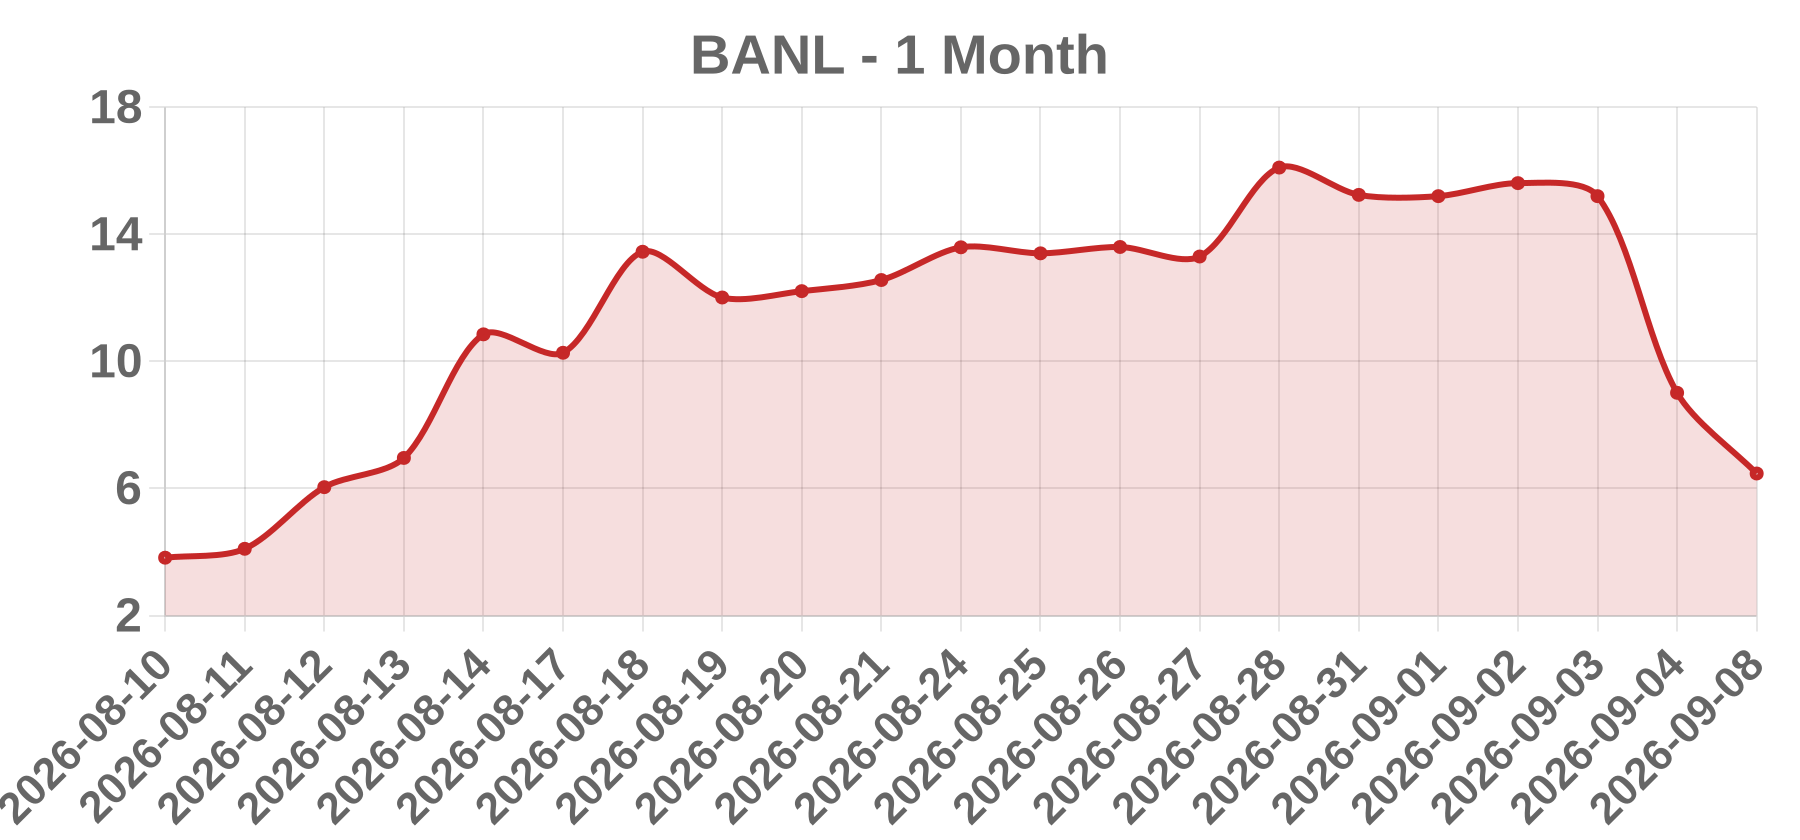
Today’s take BANL collapsed ~40.7% to close at $9.01 in the session dated 2026-09-08 (the deep fall actually landed on Friday, Sept. 4, ahead of Labor Day, and the next session kept sliding toward ~$6.46). The crash followed the Aug. 28, 2026 reactivation of its at-the-market (ATM) equity program — a Form 424B5 that newly allows sales of Class B ordinary shares up to US$2.37M (~US$2.22M net) through sales agent A.G.P., recalibrated after the 1-for-13 reverse split effective July 20, 2026. Compounding supply fears, ~10% shareholder Straits Energy Resources Berhad filed a Form 144 proposing to sell 100,000 Class B shares (~US$1.52M) scheduled for Sept. 8. With only ~2.1M shares outstanding (~US$13–19M micro-cap), the dilution/selling overhang was brutal: shares opened ~$15.31, spiked to $16.00, then plunged to a $7.47 intraday low on heavy volume before settling at $9.01.
Business TurboGen Ltd (TRBG) is an Israeli (Petah Tikva) development-stage company, founded in 2014, that designs combined heat and power (CHP) systems built around multi-fuel microturbines, with its flagship TG-40 unit targeting ~40 kW of electricity and ~60 kW of heat for distributed/building energy applications. It has 18 employees, has generated no revenue (its annual reports show USD 0 revenue for fiscal 2022-2025), and posted roughly a USD 9.2 million net loss over the trailing twelve months. It direct-listed on the Nasdaq Capital Market on Aug 31, 2026 under TRBG, offering up to ~2.07 million existing ordinary shares at roughly USD 4.42 (~USD 9.1 million of proceeds for selling holders), with no new capital raised for the company. Its shares also trade on the Tel Aviv Stock Exchange (TURB).
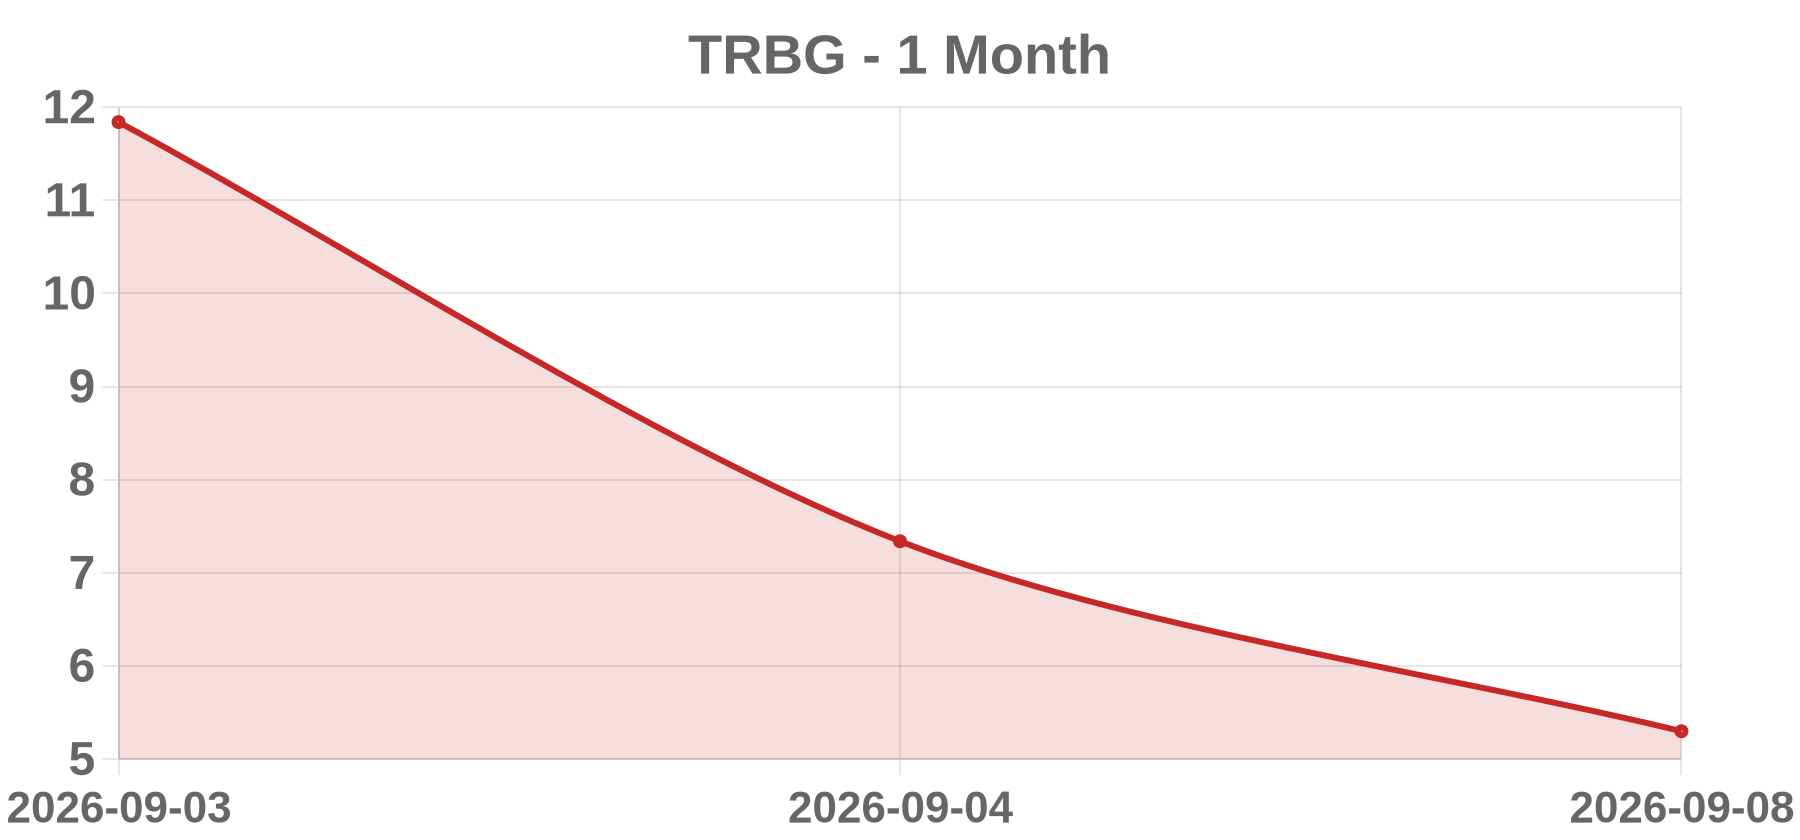
Today’s take The -38% collapse is not a fundamental or news catalyst but the violent unwind of an extreme, low-float speculative parabola that followed this pre-revenue micro-cap's Nasdaq direct listing. The board/reference clearing was set near USD 4.42 (no shares traded on listing day Aug 31), and soon after TurboGen disclosed a capital-structure change involving conversion of restricted share units. The resulting micro float (~2 million shares eligible for resale) and no-revenue story made it an easy target for a retail-driven momentum squeeze: on the session after listing the stock ran vertically (+594% intraday, touching ~USD 34) before closing ~USD 11.84, then reversed hard. The day under review (data sources archive this -38.01% close to USD 7.34 on the early-September session immediately following the pop) reflects that momentum reversal - profit-taking and supply overwhelming the thin order book once the speculative bid vanished. Fundamental reality reasserted itself: a cash-burning, pre-revenue developer with ~USD 9M raised, diluted by RSU conversion, with no earnings until a projected late-2026 product deployment. By the following session the shares had slid further to ~USD 5.30 (-27
Business Inflection Point Acquisition Corp. V (IPEX) is a Cayman Islands special purpose acquisition company (SPAC) listed on Nasdaq (formerly Maywood Acquisition Corp.). It has no operating business and exists solely to merge with a target; it has agreed to combine with GOWell Technology Limited, a global provider of well-logging and distributed-sensing technology for oil and gas and energy-transition clients, and would become GOWell Energy Technology.
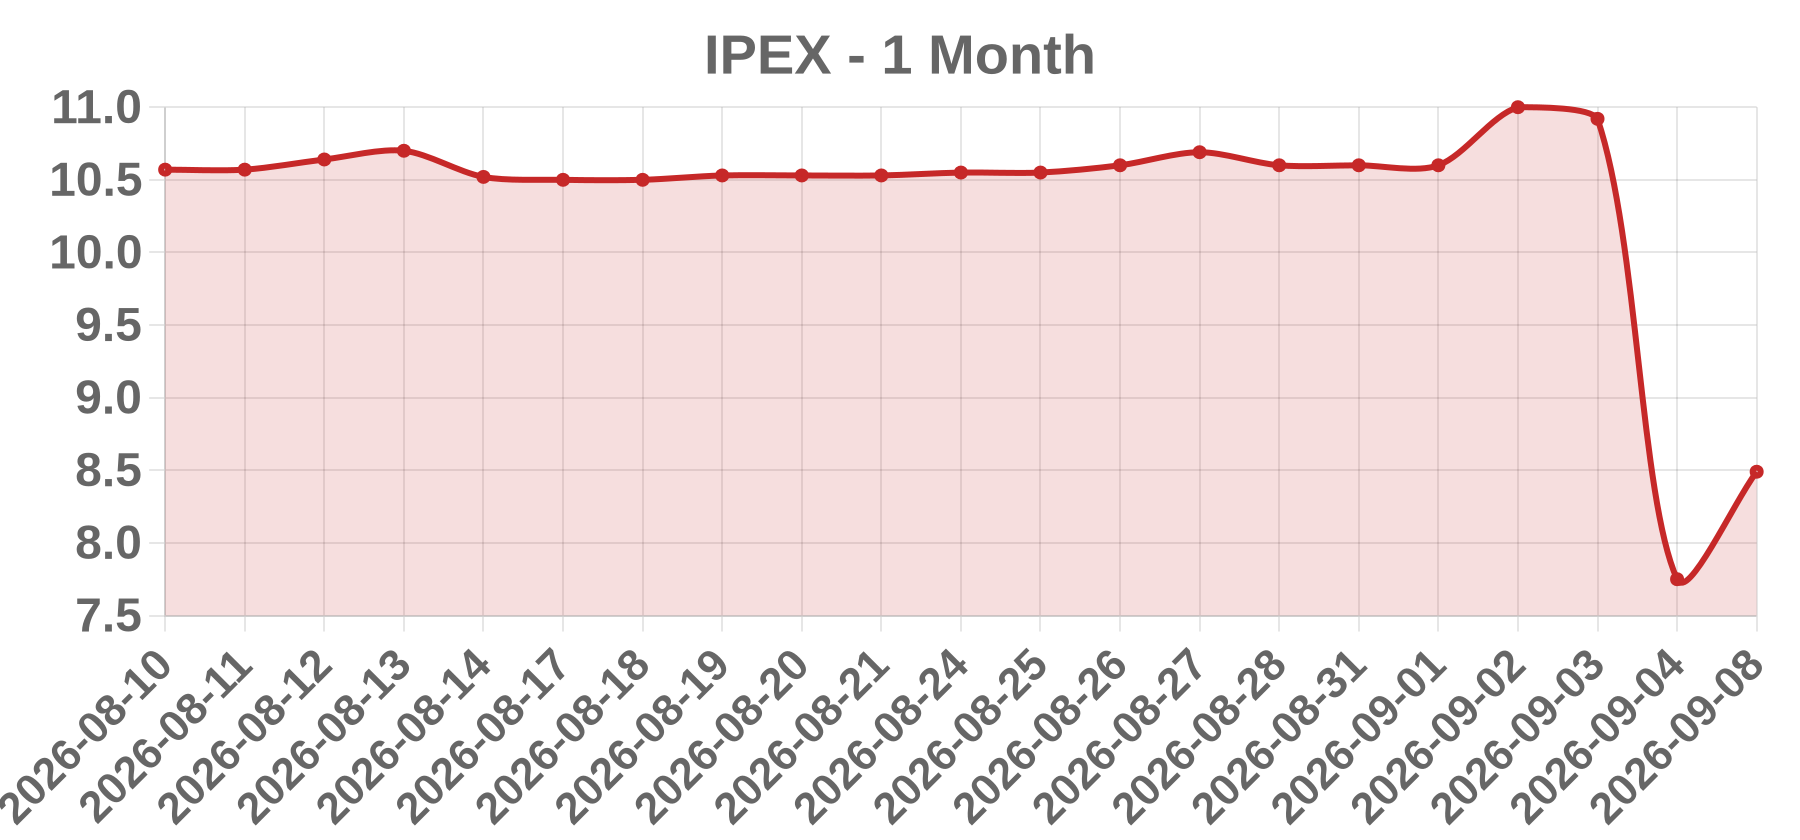
Today’s take IPEX collapsed ~29% to $7.75 (session low $6.00) immediately after its September 3, 2026 extraordinary general meeting approved the de-SPAC business combination with GOWell Technology. The crash reflects extreme redemption-driven dilutive/structural pressure: in the August extension vote public holders redeemed 7,475,610 Class A shares (~$79M at ~$10.59/share), cutting Class A float ~62.8% and trimming the trust to just ~$12.17M, so ~86.7% of the original 8.625M public units walked out, leaving only ~1.149M original public shares outstanding. With the merger approved and the redemption reference price far above the market quote, remaining holders marked the stub toward de-SPAC values and sold down (~$10.90 close prior to the drop). Adding supply overhang, an August 31 amendment eliminated all post-closing lock-ups for sponsors/representatives, making 3,337,500 PubCo shares freely tradable at closing, and 448,125 restricted shares vest at day 90. Reduced trust cash (~$12.17M) also weakens the pro-forma balance sheet for the combined GOWell Energy.
Business Founder Group Limited (FGL) is a Malaysia-based, British Virgin Islands-incorporated pure-play provider of end-to-end engineering, procurement, construction and commissioning (EPCC) solutions for solar photovoltaic facilities. Listed on the Nasdaq Capital Market in October 2024, it focuses on large-scale solar and commercial & industrial segments in Malaysia, having delivered over 400 MWp of installed capacity.
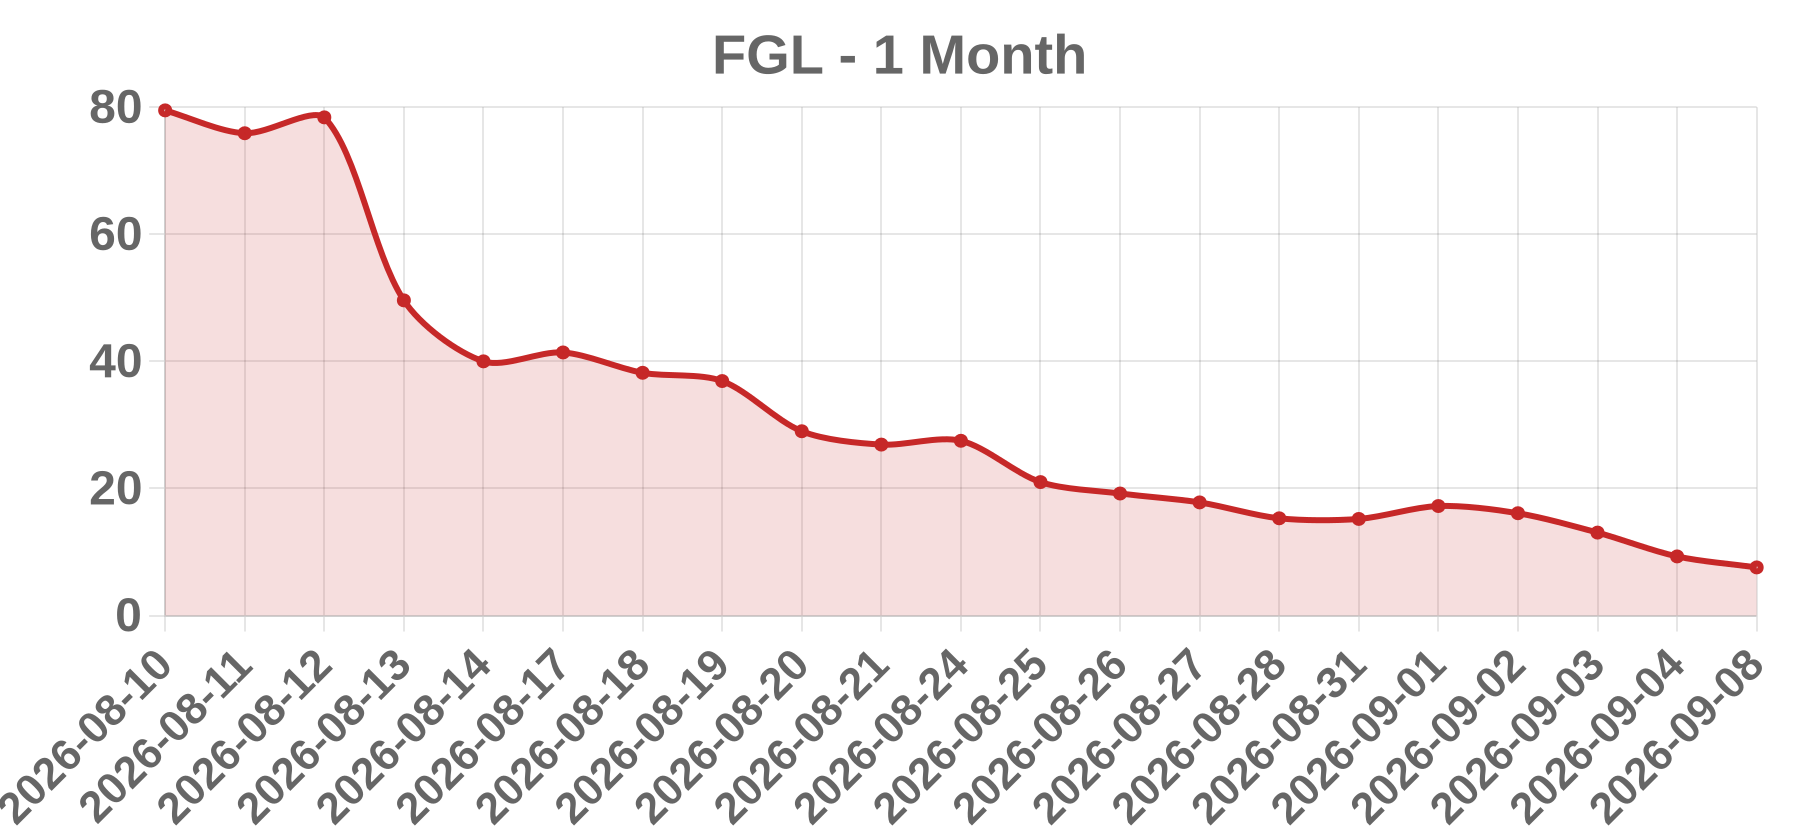
Today’s take FGL collapsed ~28.7% to $9.30 on the session (report frame 9/8/2026), extending a sharp multi-day dive into record-low territory and capping a freefall from a post-split peak above $22 on Sept 1. The drop is the mechanical and psychological aftermath of re-executing a 100-for-1 reverse share split effective Sept 1, 2026 (second in seven months), shrinking outstanding Class A shares to ~73,693 from 7,369,159 and all but eliminating float liquidity. This did not stop dilution: on Aug 19, 2026 FGL amended its $16.07M Streeterville convertible note and $1.08M Avondale pre-paid purchase agreement to price conversions/purchases at 85% of the lower of the 10-day or intraday-hourly VWAP—an aggressive floating 'toxic' structure that accelerates selling into weakness as lenders arbitrage the discount. 10% owner HRT Financial LP also sold ~395.8K shares (filed Sept 1). FGL additionally faced Nasdaq delisting notices (minimum public float and, previously, bid-price) and reported a FY2025 net loss of ~RM7.3M despite +33.6% revenue growth (~RM120.7M). Minimal post-split float (vol≈92.7K in the session) makes the tape prone to violent moves.
Business BrenX Ltd. (NASDAQ: BRNX), formerly Brenmiller Energy Ltd., is an Israeli-headquartered integrated industrial energy infrastructure company. It develops, owns, operates and optimizes thermal energy storage (TES), electricity generation and industrial heat solutions, including its bGen storage system. The company rebranded to BrenX Ltd. in August 2026 after a 6-for-1 reverse split.
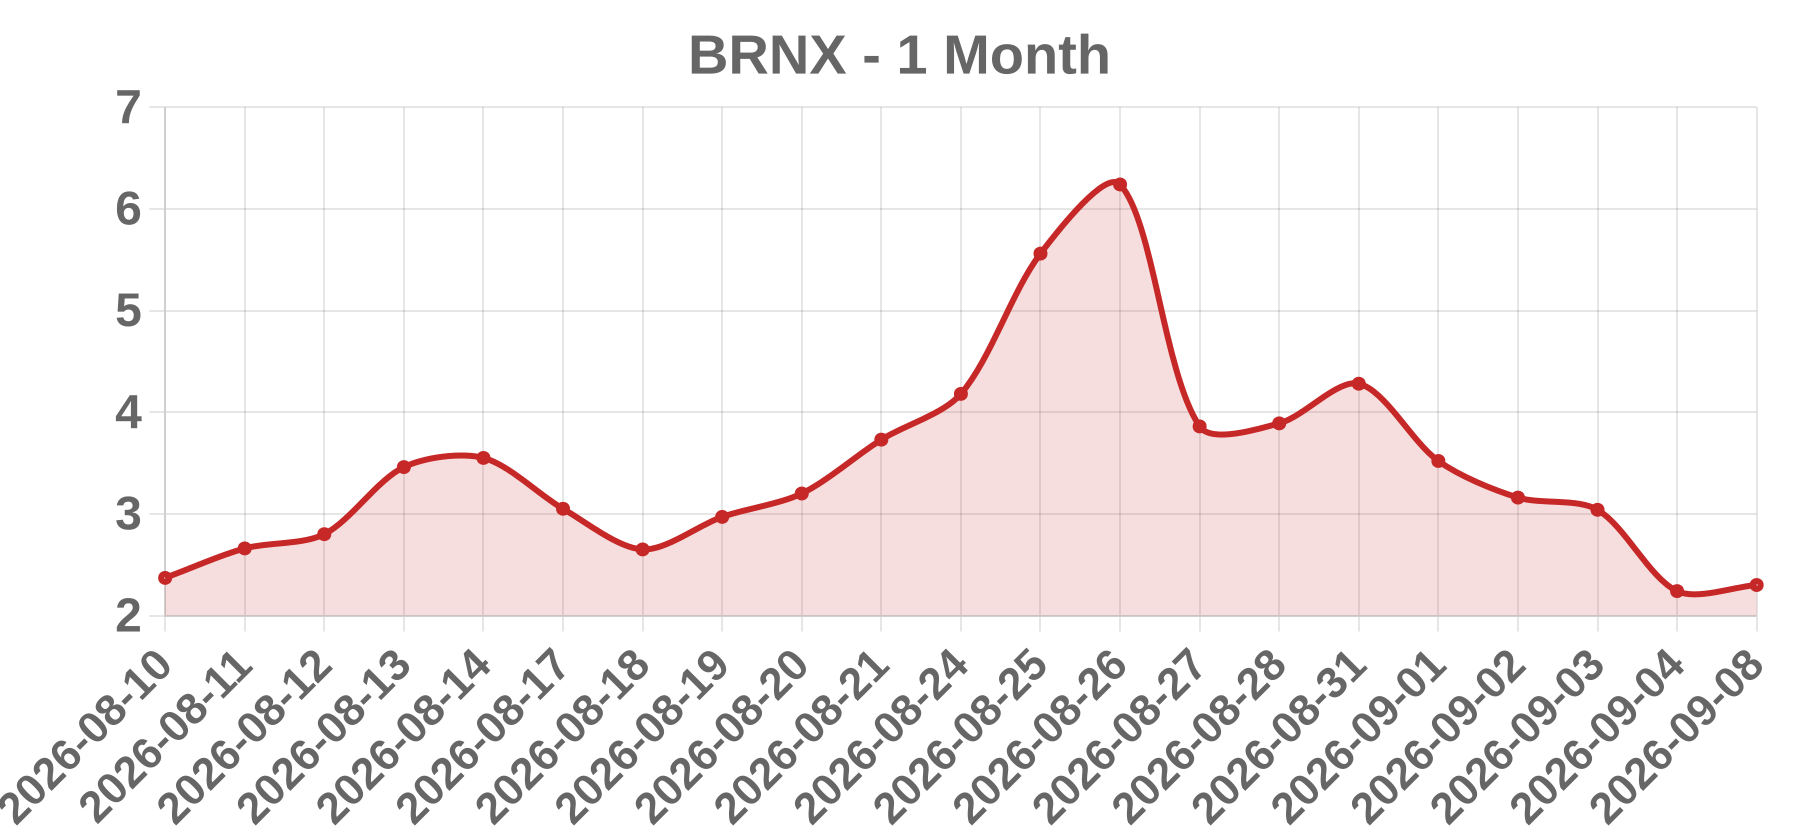
Today’s take BRNX plunged 26.32% to $2.24 on Sept 8, 2026 (prior close ~$3.04), pressing toward its ~$2.06 52-week low. The selloff is driven primarily by relentless equity dilution: between Aug 24-28, 2026, BrenX closed three separate $1.0M tranches with Alpha Capital under its SPA, issuing 1,000 convertible preferred shares per tranche (stated value $1,000) priced at $3.12-$3.928 plus ~254K-320K warrants per tranche at a $87.36 exercise price. On Aug 31, 2026 the company filed F-3 registration covering resale of 2.68M ordinary shares held by selling stockholders (Alpha), flagging imminent overhang/offering supply. Traders also cite regulatory-investigation and potential financial-misreporting concerns alongside macro oil/gas momentum hunting. Compounding distress: an ~EUR1.7M EIB loan payment waiver expires Sept 15, 2026, with a debt-settlement still pending. Dilution fears outweigh the Hungary solar asset purchase, bGen commercialization, and CEO media appearances, sending the small-cap (market cap ~$3.8M) to new lows.
Business AlTi Global, Inc. (NASDAQ: ALTI), headquartered in New York, is an independent global wealth and asset management firm serving wealthy families, foundations and institutions. It manages or advises roughly $49-51 billion in assets across 9 countries/19 cities, offering discretionary investment management, fiduciary/wealth advisory and alternative-investment strategies.
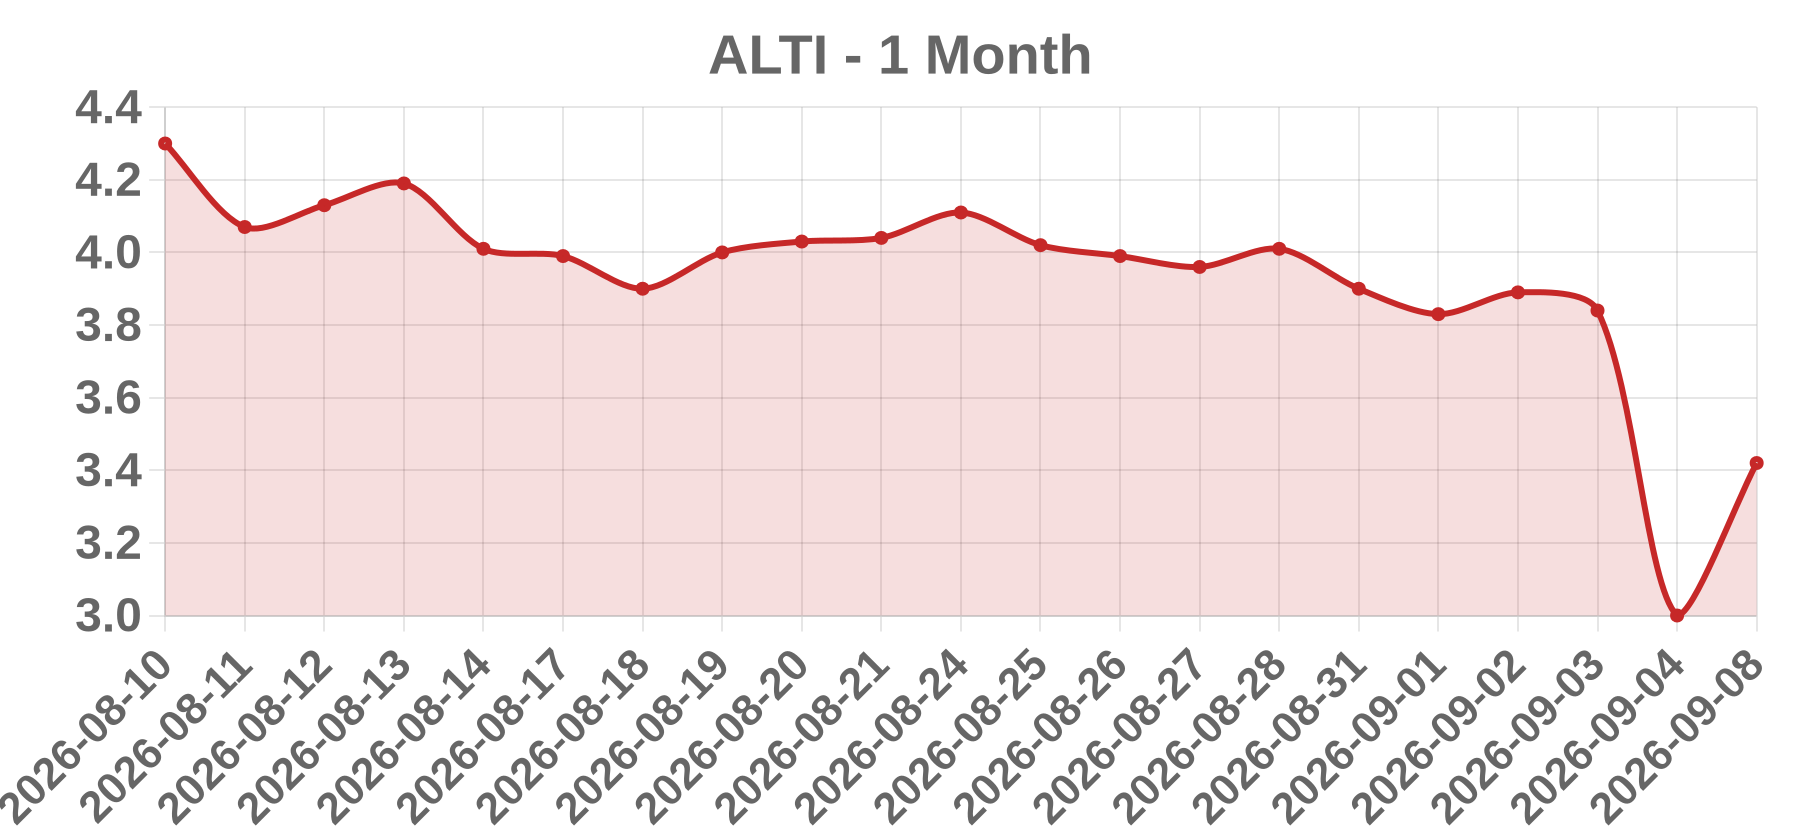
Today’s take ALTI shed ~21.9% to close near $3.00 (the session ending Sept 4, 2026; the Sept 8 print actually rebounded to ~$3.42, +14%). The acute slide followed persistent fundamental and rating weakness rather than one new headline. Q2 2026 results missed, showing a $31M net loss, ~negative 26-69% EBIT/pretax margins, ~$2.4-3.2M quarterly cash burn, and a ~$19M unrealized loss tied to an external manager unwinding its Asia credit/special-situations fund. Sell/strong-sell ratings were reiterated or initiated in late Aug (Zacks 'strong sell', Weiss 'sell'), and media framed ALTI as a subscale, loss-making manager trading at a premium-to-true-value multiple. The Franklin Templeton/Corient go-private talk stalemated on 'highly consequential' AllianzX/Constellation PIK (9.75%) and convertible preferences, leaving a large valuation gap. Sector pressure from a global bond selloff and rising oil/rates further hit rate-sensitive alternatives. Note: data labels the -21.88%/$3.00 print to Sept 8, but history sources confirm it was the Sept 4 close followed by Sept 8's rebound.
Business Wetour Robotics Limited (formerly Webus International Limited) is a NASDAQ-listed Physical AI infrastructure and wearable robotics company. It is building the 'Orchestra' system that combines surface electromyography (sEMG) wristbands with first-person vision cameras to capture richer human-hand data for robot learning and physical-AI deployment.
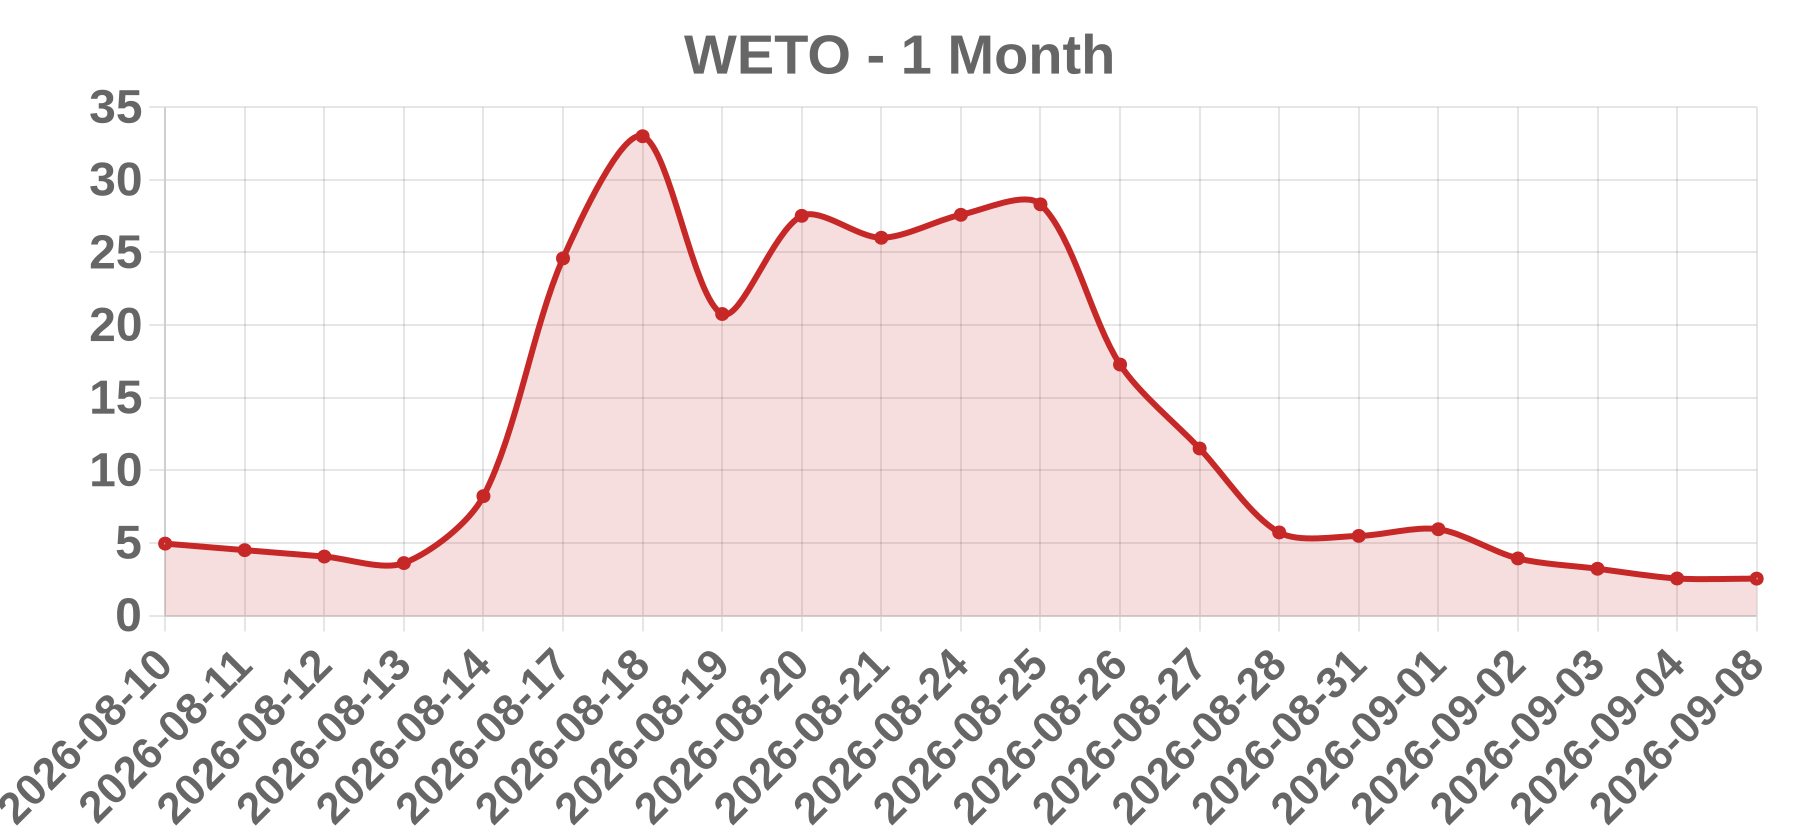
Today’s take Data reconciliation: the -20.81% move to a $2.55 close shown for the 2026-09-08 label actually reflects the Friday Sep 4, 2026 session (the last close before the Labor Day holiday weekend); on Sep 8 itself WETO traded roughly flat at ~$2.54 (-0.39%, ~3.9M shares). The collapse trace runs: WETO spiked to a ~$53.59 intraday high in mid-Aug after its effective 100:1 reverse split (Aug 3) shrank the float to ~1.08M shares, then unwound 37.09% on Aug 19 to $20.76, and continued to break down after the Aug 24 EGM approved the reverse split and a massive authorized-capital increase. On Sep 2 the stock fell 33.84% to $3.93, and into Sep 4 it plunged another 20.81% to $2.55 on unusually heavy volume of ~20.7M (vs ~3.6M average). Drivers: durable fear of dilution from the US$50M at-the-market (ATM) equity program (Chaince/Rodman & Renshaw sales agents), a critically thin post-split float prone to violent retail unwind, plus skeptical coverage (btw.media) questioning that Orchestra's force-estimator validation was run only on synthetic data, not live wristband tests.
Business Guidewire Software, Inc. (NYSE: GWRE), headquartered in San Mateo, California, provides cloud-based software platforms (InsuranceSuite, PolicyCenter, ClaimCenter, BillingCenter, InsuranceNow) purpose-built for the global property and casualty insurance industry, delivered primarily as subscriptions on Guidewire Cloud. The company was founded in 2001 and serves carriers worldwide.
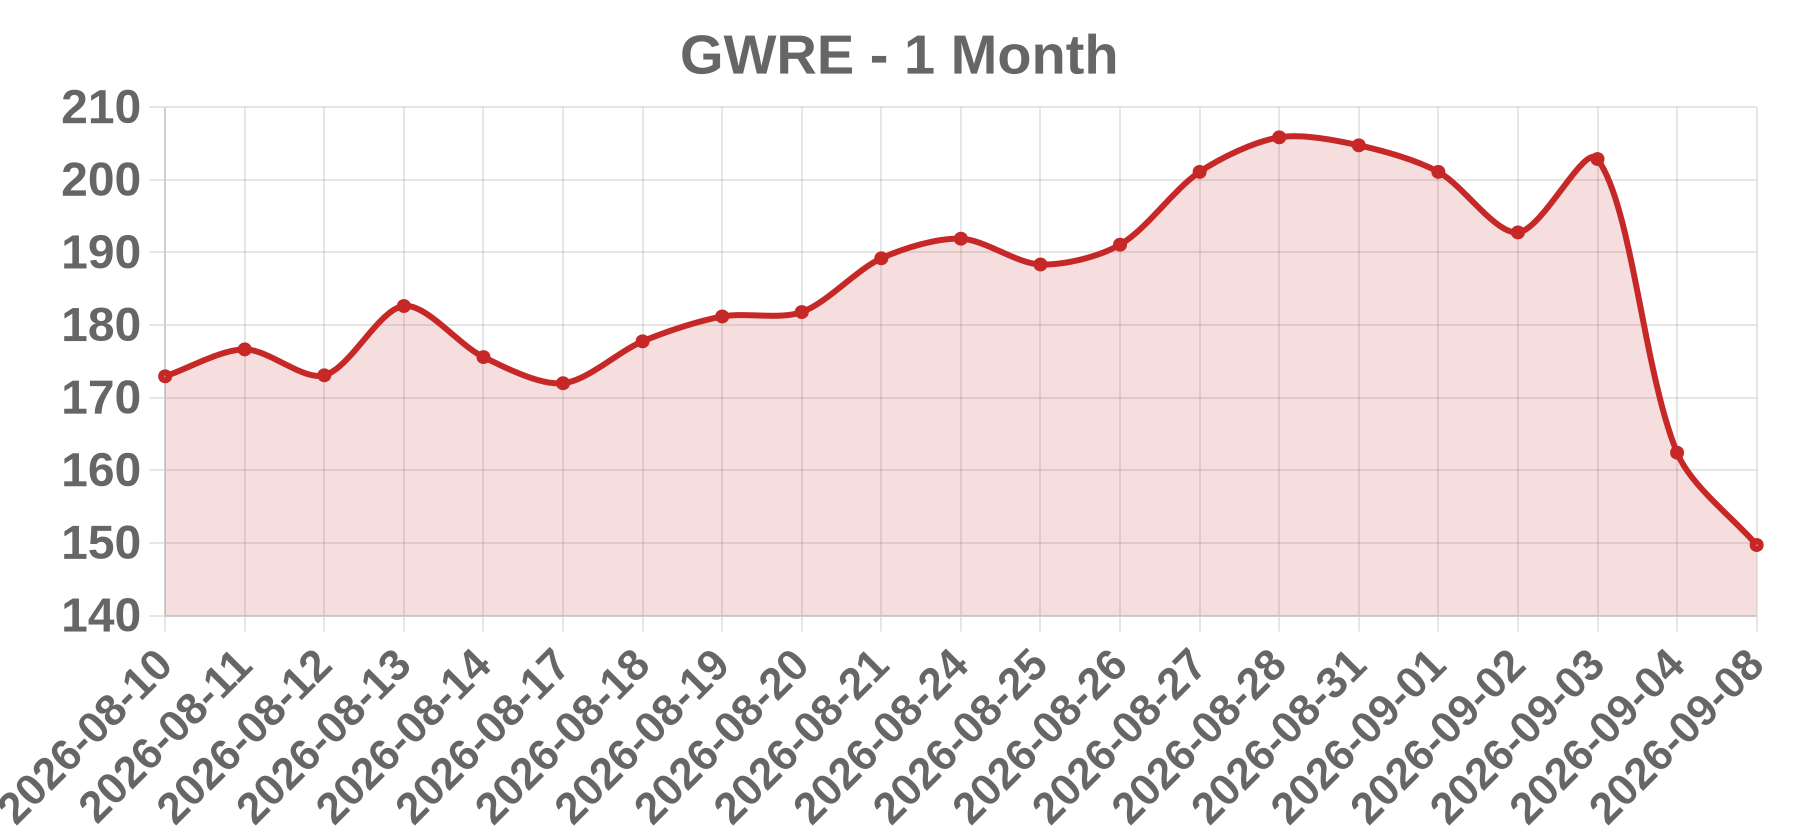
Today’s take GWRE fell approximately 19.9% (about -$40.4 to $162.42) following its Q4/FY2026 earnings report. Guidewire beat the quarter—Q4 revenue of $411.1M (+15% YoY, above ~$402.5M consensus) and non-GAAP EPS of $0.99 (beating ~$0.94)—and FY2026 revenue rose 23% to $1,475.4M with ARR up 19% CC to $1.242B. The sell-off was driven by tempered FY2027 guidance: Q1 revenue of $372-378M vs ~$387M consensus, and full-year revenue of $1,707-1,727M implying ~16% growth, down from 23%. Management also flagged that FY2026's record-low ARR attrition (<1.5% gross, <1% core) contributed ~1pt to growth and would normalize higher in FY2027, raising durability concerns among investors. Post-drop, shares traded near ~7.9x guided FY27 revenue (vs ~10x pre-drop). Shares continued lower on subsequent sessions.
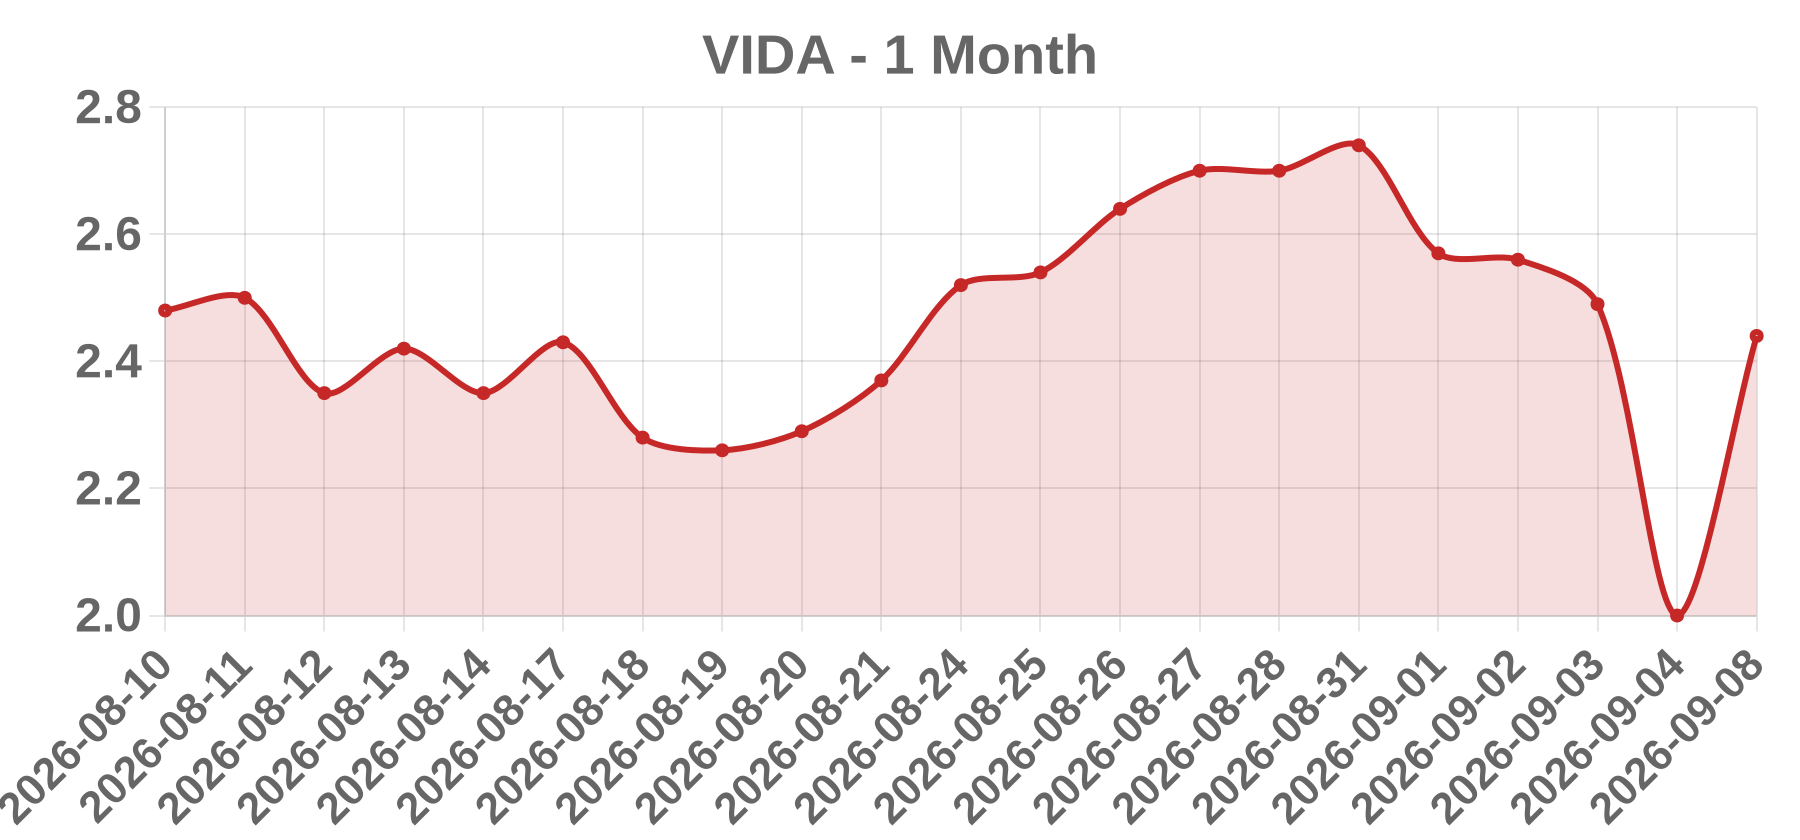
Business VIDA Global Inc. (NYSE American: VIDA) is a Delaware-based SaaS provider of a cloud-based AI agent operating system that lets enterprises build, deploy, manage, and monetize omnichannel AI agents handling voice, text, email, and chat while automating business workflows. Founded and led by CEO Lyle Pratt, it completed an ~$15M IPO in May 2026 and also lists tokenized equity ('VIDAx') on crypto platforms.
Today’s take VIDA's selloff to $2.00 (-19.68%) reflects a meme/crypto-driven trading event. The stock, which IPO'd May 2026 at $4.00 and lists tokenized equity via Kraken's xStocks, has traded with ~22% average weekly swings on speculative retail activity. Around this period a 'CTO' meme coin using VIDA's stock token as its liquidity pool on Solana's Stonk platform spiked (+51%, ~$7.47M cap, Sept 6-7), and CEO Lyle Pratt publicly floated a stock-linked meme-coin issuance platform with a Solana Foundation product lead. The reported -19.68% day (Sept 4 close session, from $2.49; intraday low $1.80, a fresh 52-wk low) came as a sharp cooldown/reversal after the stock ramped through early September (Sep 1-3 highs touched $3.06), with volume surging to ~362k vs ~40k late-August daily averages. The screen snapshot date of Sept 8 followed the Labor Day holiday; Sept 8 itself rebounded +22% to $2.44. Underlying fundamentals remain weak: ~$1.07M trailing revenue and ~-$4.99M net loss.
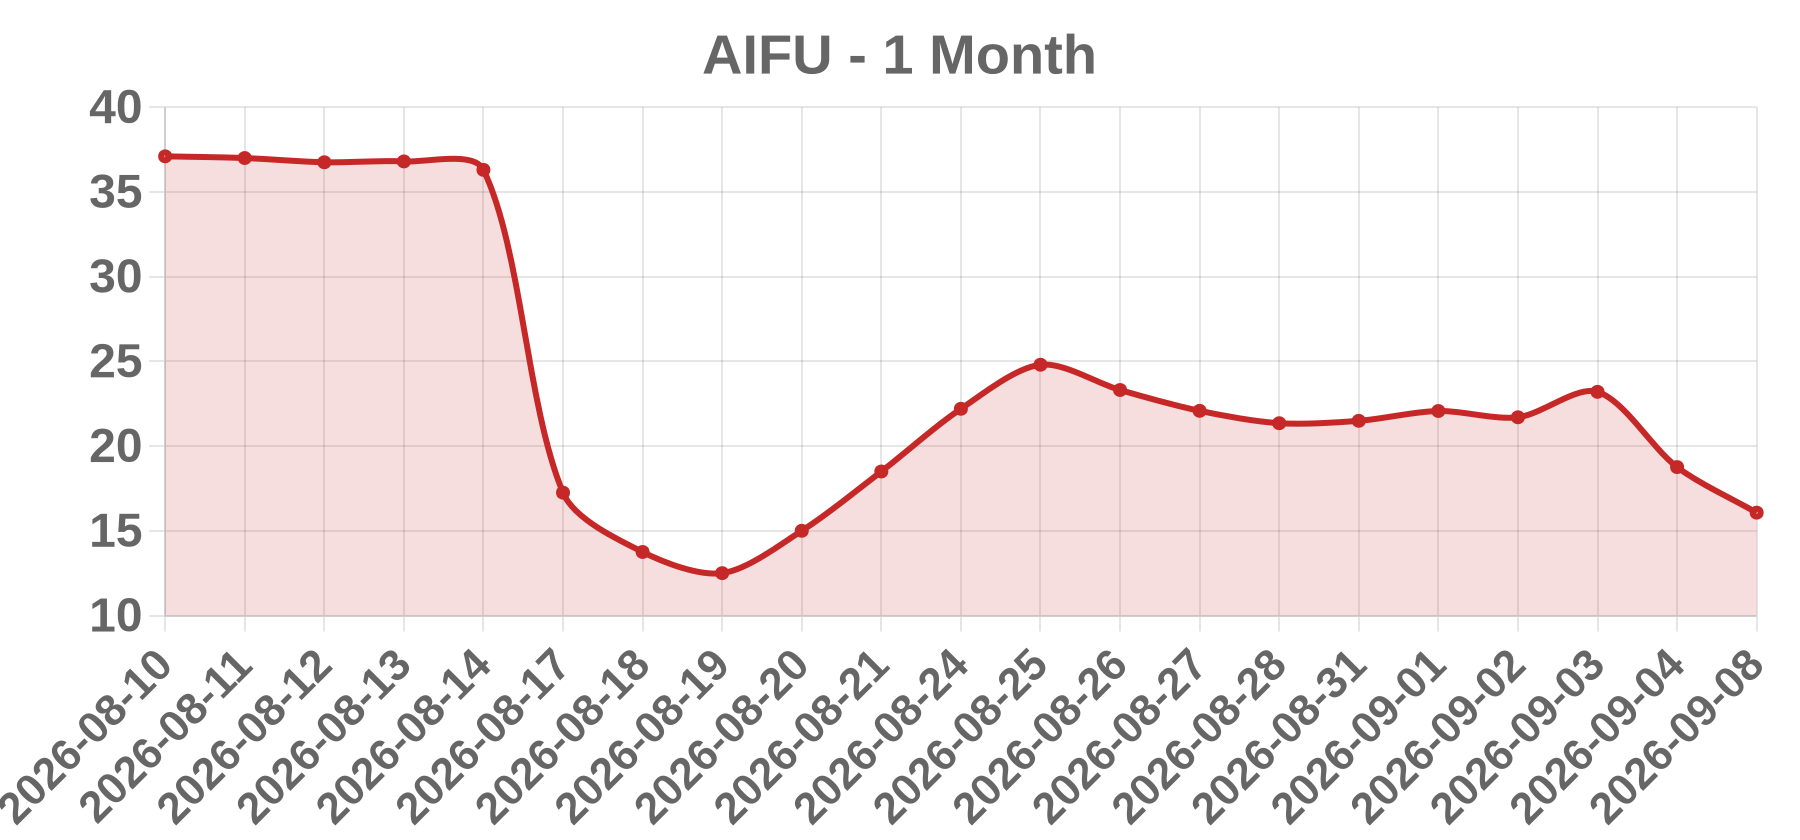
Business AIFU Inc. (NASDAQ: AIFU), formerly Fanhua Inc., is a Cayman-incorporated, AI-driven independent financial services platform headquartered in Shenzhen, China. It operates through insurance agency and claims-adjusting segments, primarily distributing full-lifecycle insurance products to mass-affluent and high-net-worth households via Fanhua Group companies.
Today’s take The -19.16% plunge to $18.76 (recorded under the Sept 8 reference but attributable, per multiple price histories, to the September 4 session that closed at $18.76; the following session slid further to ~$16.07, roughly -14%) capped a brutal slide for this ~US$110m Nasdaq micro-cap. Intraday the stock opened ~$22.86, spiked to a $31.11 high, then cratered to an $18.25 low. No single fresh headline drove that session; sellers stayed in control amid converging chronic overhangs: the abrupt CFO resignation effective August 17, 2026 (which had triggered a >50% one-day crash), dilution fears from a just-filed $300m mixed-shelf F-3 against an enormous authorized-share base, and a fundamentally hemorrhaging core — FY2025 revenue fell roughly 58% year-on-year while the company swung to a CN¥2.28bn net loss versus a CN¥455m profit in 2024. The stock is down roughly 48% in one month and ~84% year-over-year, underscoring persistent selling pressure and very thin liquidity.