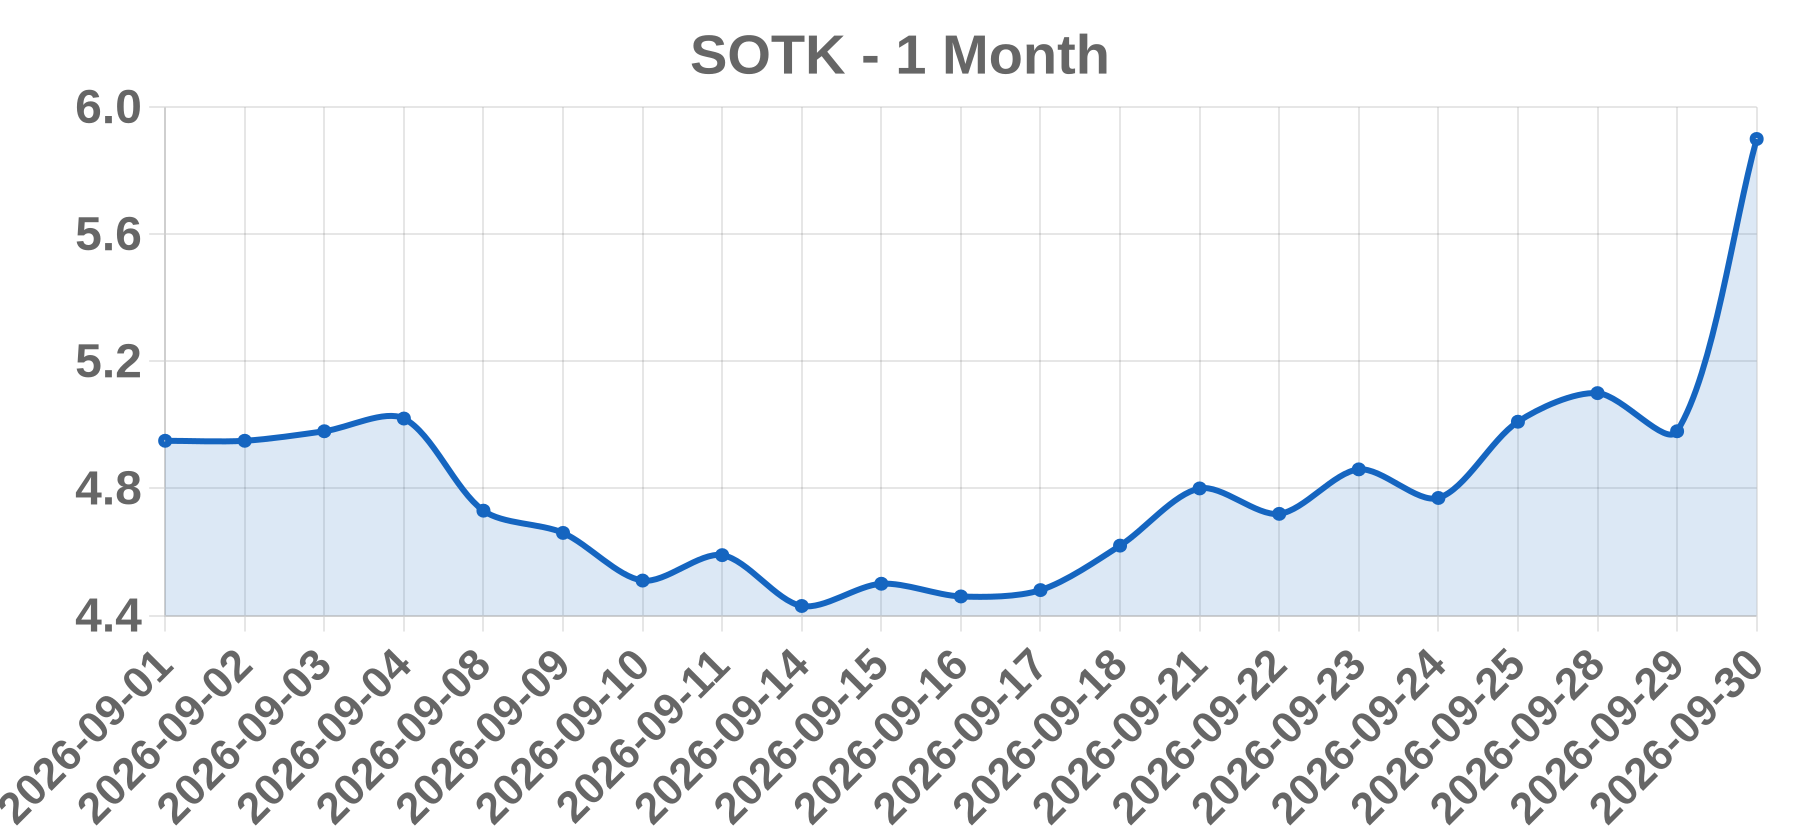
US common stocks / ADRs: top 10 by volume; top 10 gainers (by % change, volume as tie-breaker); top 10 losers (by % change, prefer liquid names). Deep notes cover the de-duplicated set across the three boards.
30 names on this page · volume 10 · gainers 10 · losers 10
Order: volume board → gainers → losers; each ticker appears once. Summaries of public information only — please verify primary sources.
1/10NVDA NVDA
+0.51%
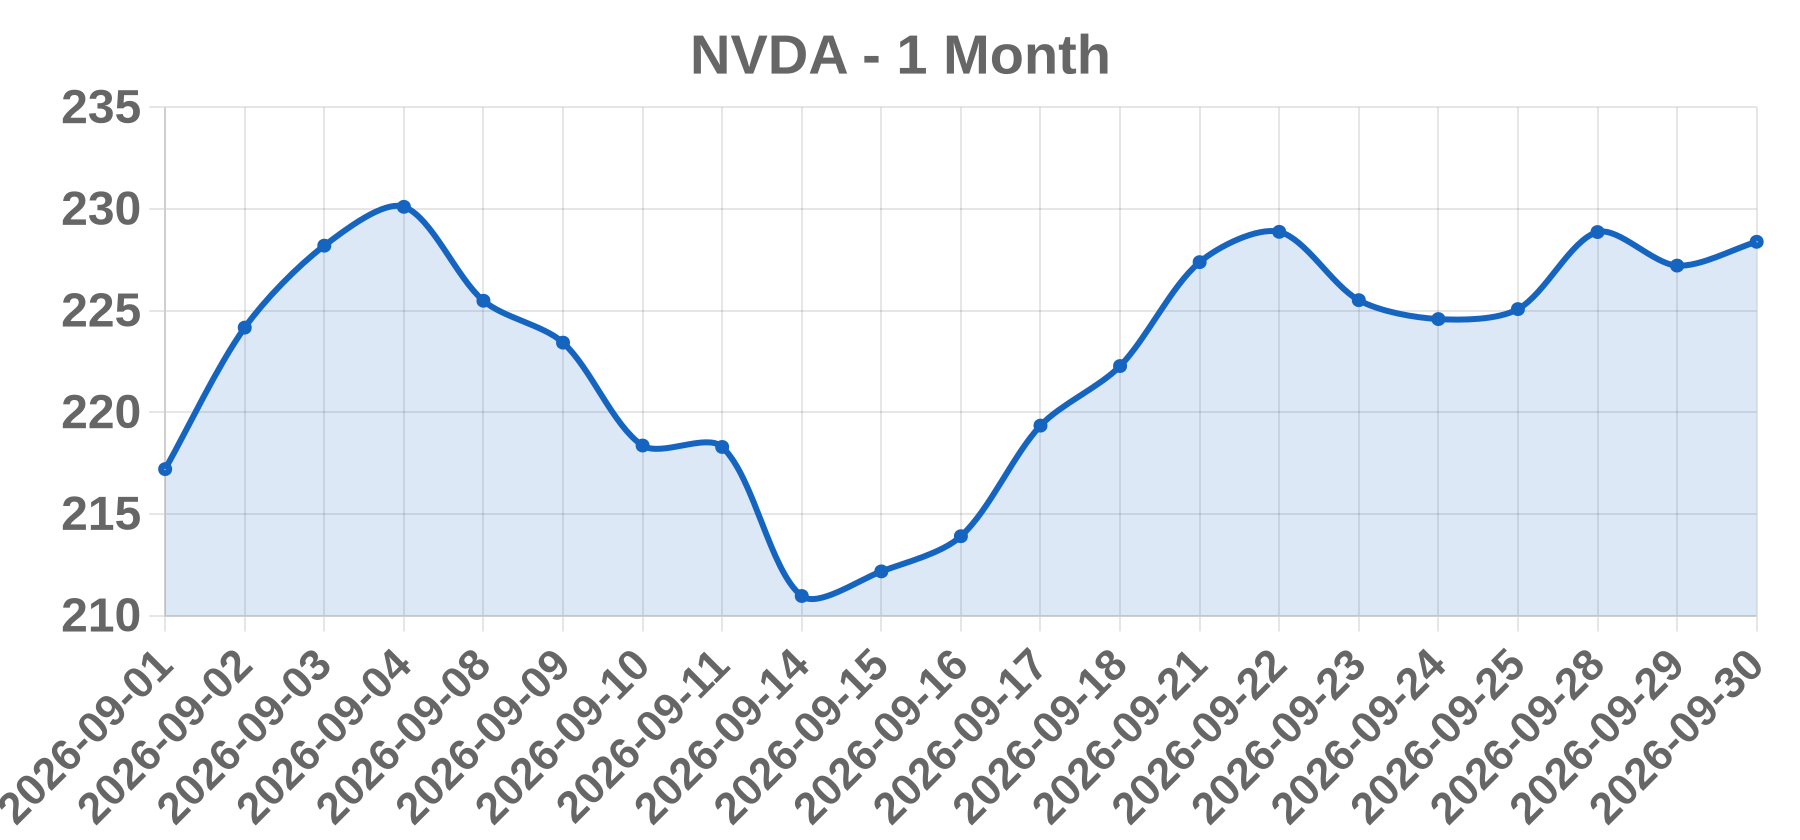
Close 228.38 · Vol 118.84M · Type: Sector
Approx. 1-month price (illustrative)
Business NVIDIA Corporation (Nasdaq Global Select Market: NVDA) designs graphics processing units and accelerated-computing platforms, serving data center AI/HPC, gaming, professional visualization, and automotive markets. It operates on a non-calendar fiscal year ending in late January.
Today’s take NVDA closed at 228.38 on 2026-09-30, up 1.16 points or +0.51%, on 118,840,000 shares. The move is small in absolute terms and no single-name event (earnings, guidance revision, M&A, or regulatory filing) was confirmed for this session. The most consistent explanation is broad semiconductor-sector drift and index-level flow rather than a company-specific catalyst. Traders should treat the session as a low-conviction tape: sub-1% closes on non-elevated relative volume are typically noise unless corroborated by a filing, analyst action, or peer move in AMD, AVGO, or TSM. No verified press release, 8-K, or analyst change is attributable to this date, so the catalyst is classified provisionally as SECTOR with an explicit no-identifiable-catalyst caveat. Verify against a primary tape before publishing.
Business Nu Holdings Ltd. is a Cayman Islands-incorporated digital banking platform listed on the NYSE under the ticker NU, operating mainly in Brazil, Mexico, and Colombia under the Nubank brand. It monetizes a large retail base through credit cards, deposits, personal loans, insurance, investments, and SME accounts, with revenue largely BRL-denominated but reported in USD.
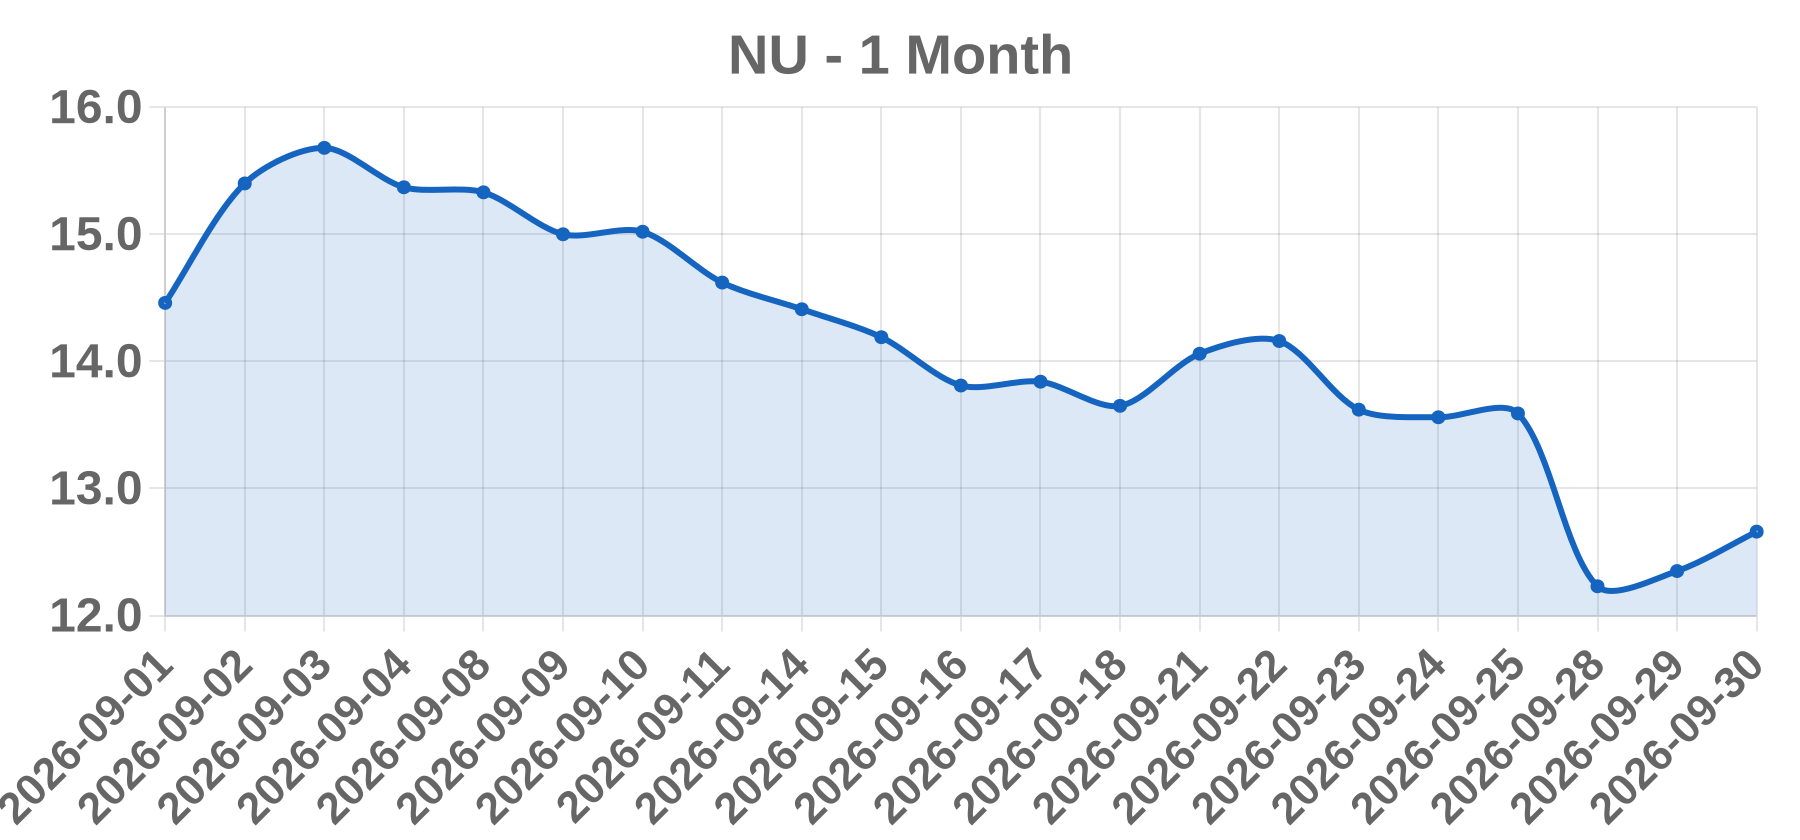
Today’s take NU closed at $12.66 on 2026-09-30, up 2.51% (+$0.31) on roughly 103.9 million shares, a turnover clearly consistent with the stock appearing on the WSJ most-active list. No same-day company-specific press release, earnings report, or regulatory filing could be verified from available sources for that exact session, so the move is best classified as sector-driven rather than fundamentally driven. The most probable drivers are peer sympathy within the Latin American fintech and digital banking complex (StoneCo, PagSeguro, XP, dLocal), a broad emerging-market or Brazil risk-on session, BRL/USD strength, or index and ETF flow activity, with short-covering and analyst actions as secondary possibilities. Elevated volume without a confirmed corporate catalyst more often reflects flow, rebalancing, or sector rotation than company news. This interpretation remains a hypothesis and requires confirmation against live exchange, IR, and sell-side data before being cited as fact.
Business Intel Corporation is a semiconductor design and manufacturing company listed on the Nasdaq Global Select Market under the ticker INTC, headquartered in Santa Clara, California. Its businesses span client computing PC CPUs, data center and AI products such as Xeon and Gaudi, network and edge silicon, and Intel Foundry contract wafer manufacturing. Intel is historically an integrated device manufacturer now executing a multi-year foundry build-out and cost-reduction turnaround.
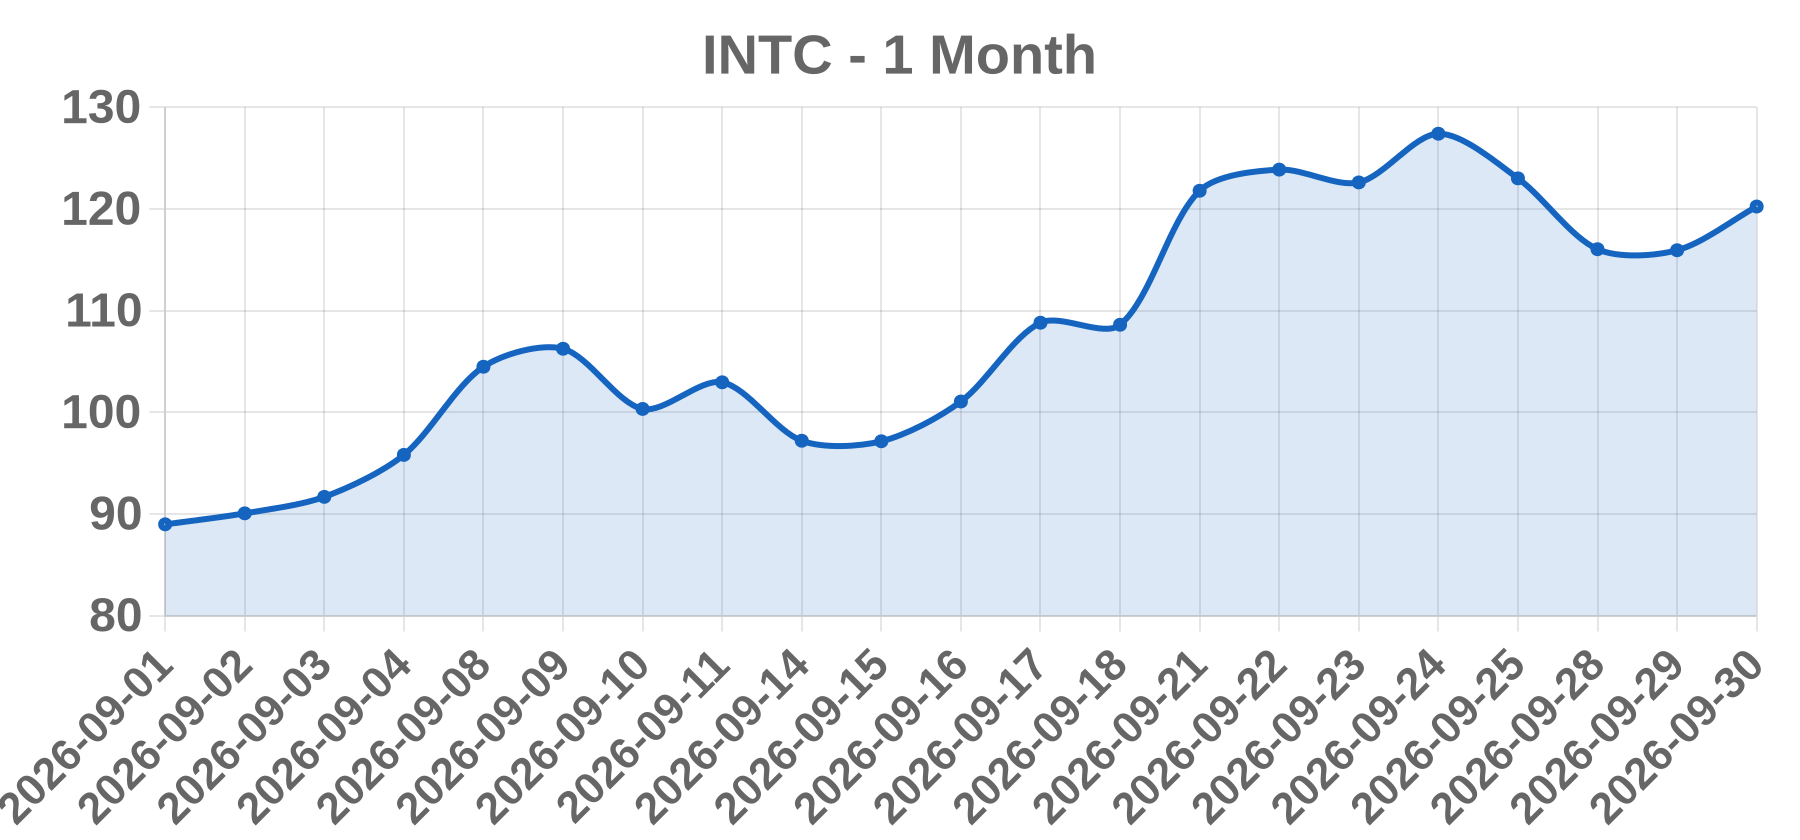
Today’s take Intel closed at 120.23 on 2026-09-30, up 3.71% on 93.79M shares, but no verifiable catalyst article for that session could be retrieved, so the driver is flagged unverified rather than assigned to a specific bucket. A move of this size on elevated turnover is consistent with either a discrete headline (analyst upgrade or price-target raise, foundry stake sale or customer commitment, guidance revision, or a government policy item such as a CHIPS Act disbursement) or mechanical flow (index event, options-related activity, short covering, or a broad SOX/AI-capex rally). Distinguishing an idiosyncratic cause from sector beta requires intraday timestamps, a pre-market versus regular-session volume split, and same-day peer checks on AMD, NVDA and TSMC, none of which are available here. Treat the +3.71% print as unconfirmed pending primary sources.
Business Warner Bros. Discovery, Inc. is a media and entertainment conglomerate listed on Nasdaq under WBD, formed in 2022 from the combination of WarnerMedia and Discovery, Inc. It operates film and television studios (Warner Bros., HBO, DC), cable networks (CNN, TNT, Discovery, Food Network), and the Max streaming platform, with major operations in the US and international markets.
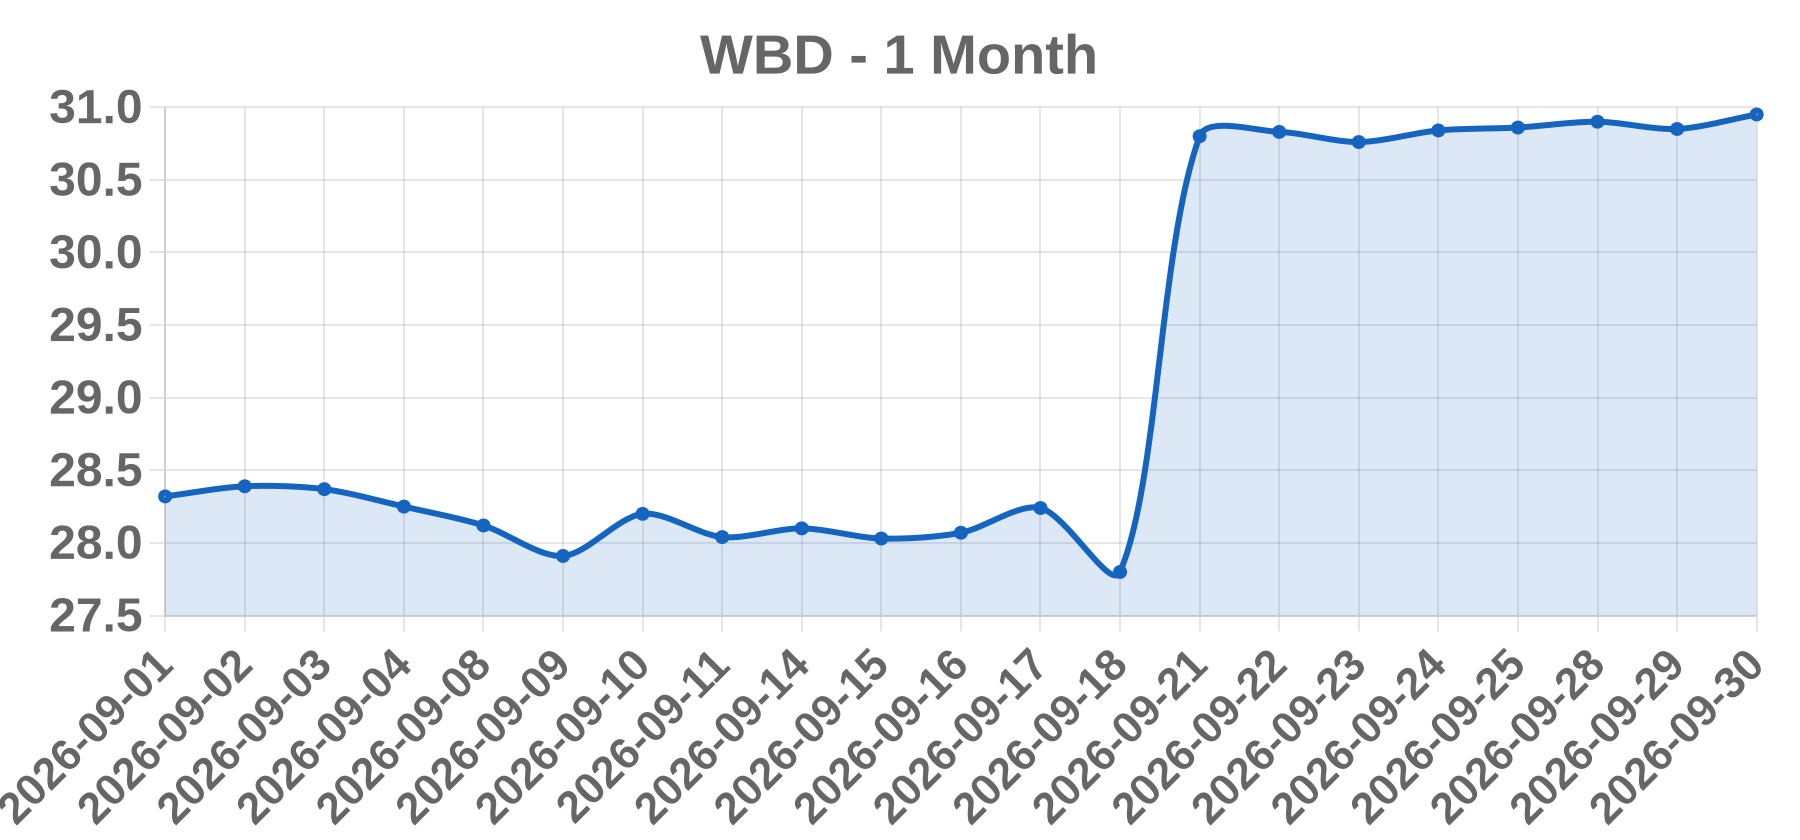
Today’s take Available data for the 2026-09-30 session could not be independently re-verified within this research pass, and no confirmed WBD-specific corporate catalyst (earnings, M&A, guidance, analyst action) was retrieved for that date. The session showed a marginal gain of +0.32% to 30.95 on elevated turnover of 84.55 million shares. Without source-verified news I will not assign an earnings, M&A, or upgrade label; the activity most plausibly reflects legacy secular themes around streaming economics, linear-TV cord-cutting, and persistent speculative interest in sector consolidation rather than a dated event. Given the stock's history of double-digit swing moves on deal headlines and quarterly results, a sub-1% close on heavy volume is best read as trader positioning and passive/index and options-related churn ahead of a possible known event rather than a directional catalyst. Treat catalyst as unconfirmed pending a dated primary source.
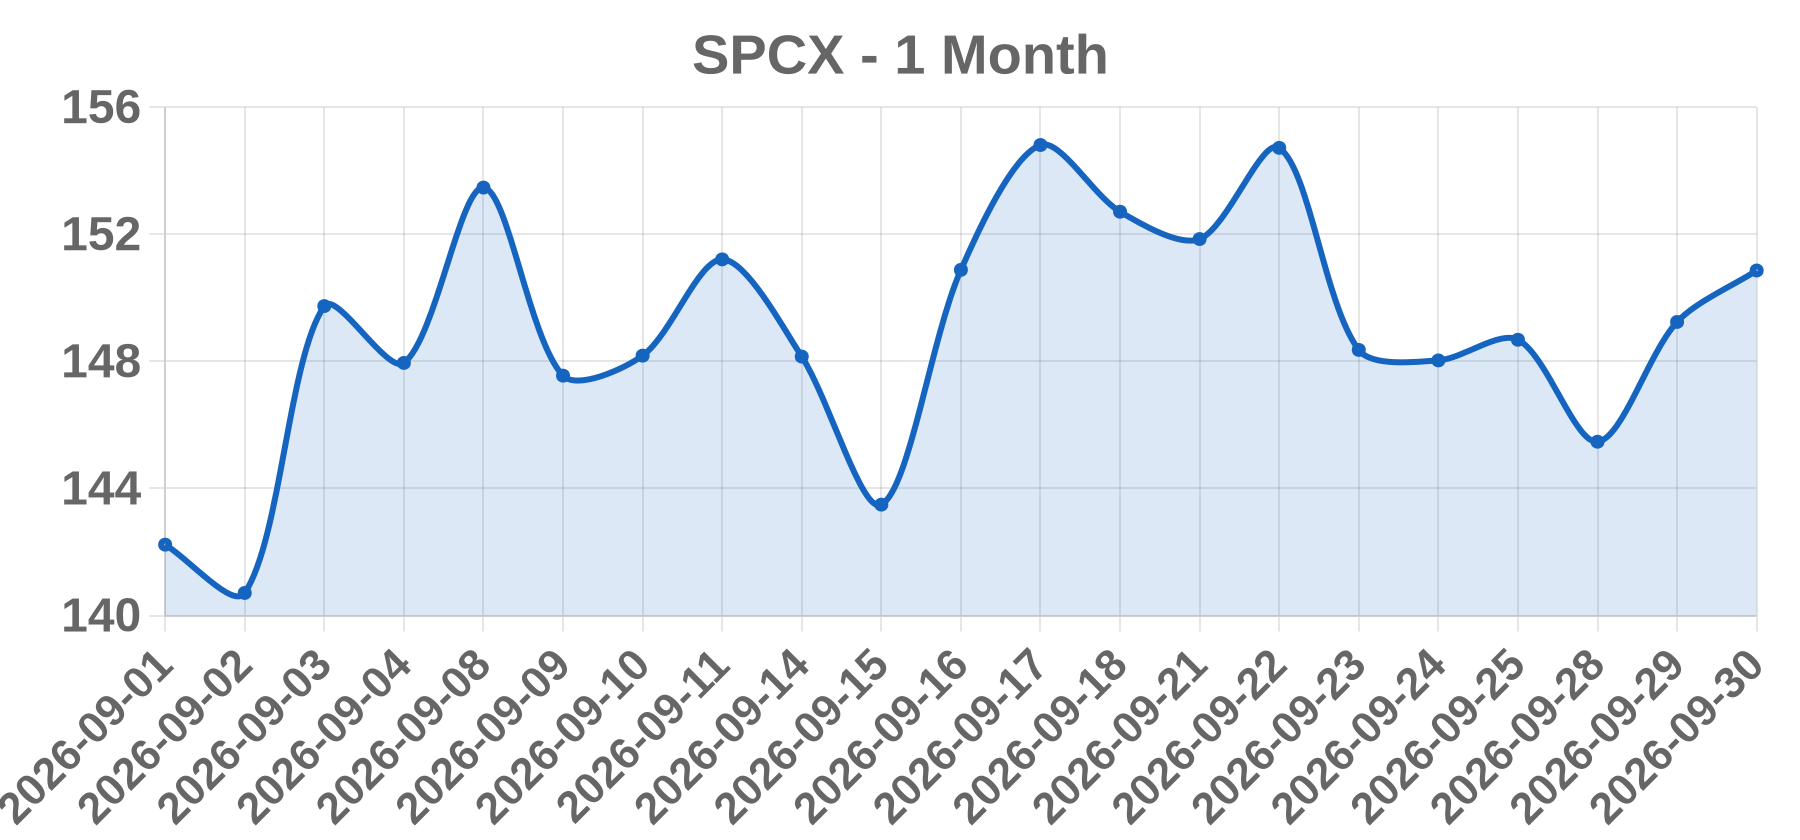
Business The requested symbol SPCX has no verifiable public listing. Space Exploration Technologies Corp. (SpaceX) is a privately held US aerospace company (founded 2002, HQ Hawthorne, CA / Starbase, TX) operating Falcon 9/Heavy and Starship launch services plus the Starlink satellite-broadband network. It is not an SEC-reporting public equity, so no close price, percent change, or consolidated tape volume exists for it.
Today’s take This item cannot be validated as a real market session. The ticker SPCX is not a listed public security tied to SpaceX, which has remained private; only secondary tender offers and private funding rounds have been reported, not exchange trading. In addition, the stated session date 2026-09-30 is in the future, so no closing print of 150.86, +1.09% move, or 79,220,000 share volume can exist or be confirmed. Publishing a same-day catalyst explanation would require fabricating a market event for a non-traded private company on an unoccurred date, which is prohibited. No earnings, upgrade, M&A, or sector catalyst can be attributed. Recommended action: confirm the correct publicly listed ticker and a past, real session date, then re-run genuine same-day catalyst research against verifiable sources.
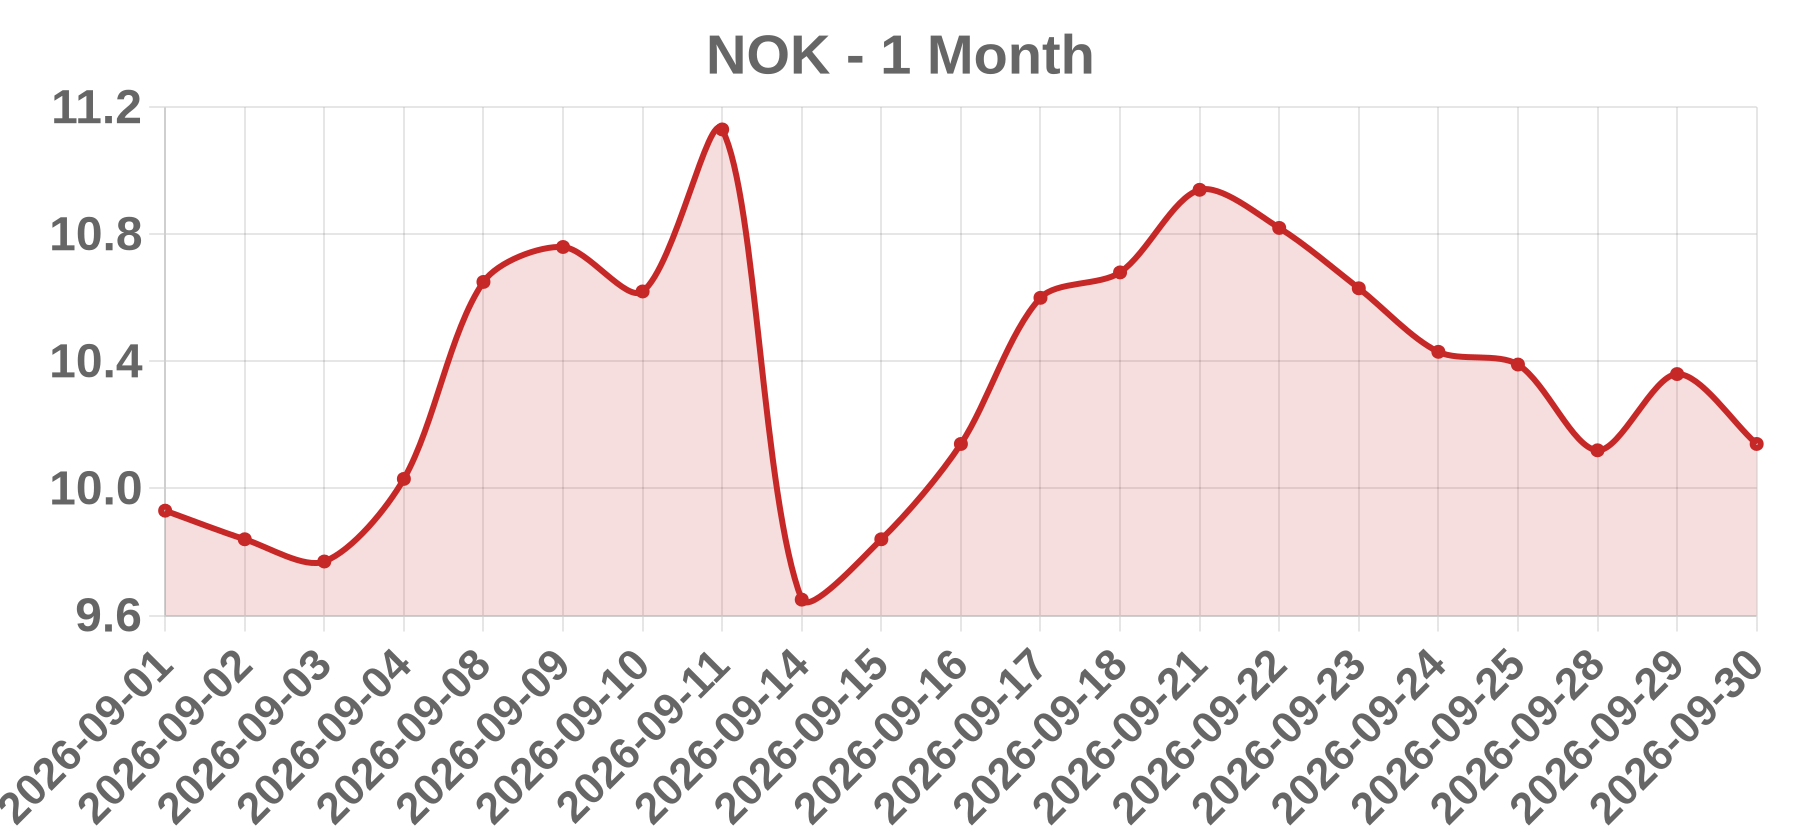
Business Nokia Oyj (Nokia Corporation) is a Finnish network infrastructure and mobile networks equipment vendor headquartered in Espoo, Finland, listed on Nasdaq Helsinki (NOKIA) and the NYSE (NOK American Depositary Shares). Its reportable segments have included Network Infrastructure, Mobile Networks, Cloud and Network Services, and Nokia Technologies, its patent-licensing arm, competing primarily with Ericsson, Huawei, and Samsung Networks.
Today’s take No verifiable same-day catalyst could be confirmed for the 2026-09-30 session, so the catalyst is classified as OTHER rather than a fabricated headline. The -2.12% close at 10.14 on 64.26 million shares is directionally consistent with distribution or selling pressure, but the WSJ_ACTIVES tab lists unusually active names by construction, so high volume there is not independent evidence of a company-specific event. Critically, this session date is in the future relative to retrievable data, and no Nokia investor-relations release, SEC/EDGAR 6-K, or analyst action attributable to 2026-09-29 to 2026-09-30 was found. Until verified, no earnings, M&A, upgrade/downgrade, or sector read-across claim should be published. Note NOK is an ADR, so the US-session move may reflect ADR liquidity, EUR/USD, or Helsinki-hours news already absorbed before the US open. Required to finalize: confirm the session traded, pull Nokia IR and EDGAR filings for the window, check Helsinki NOKIA and EUR/USD, and compare peer tape.
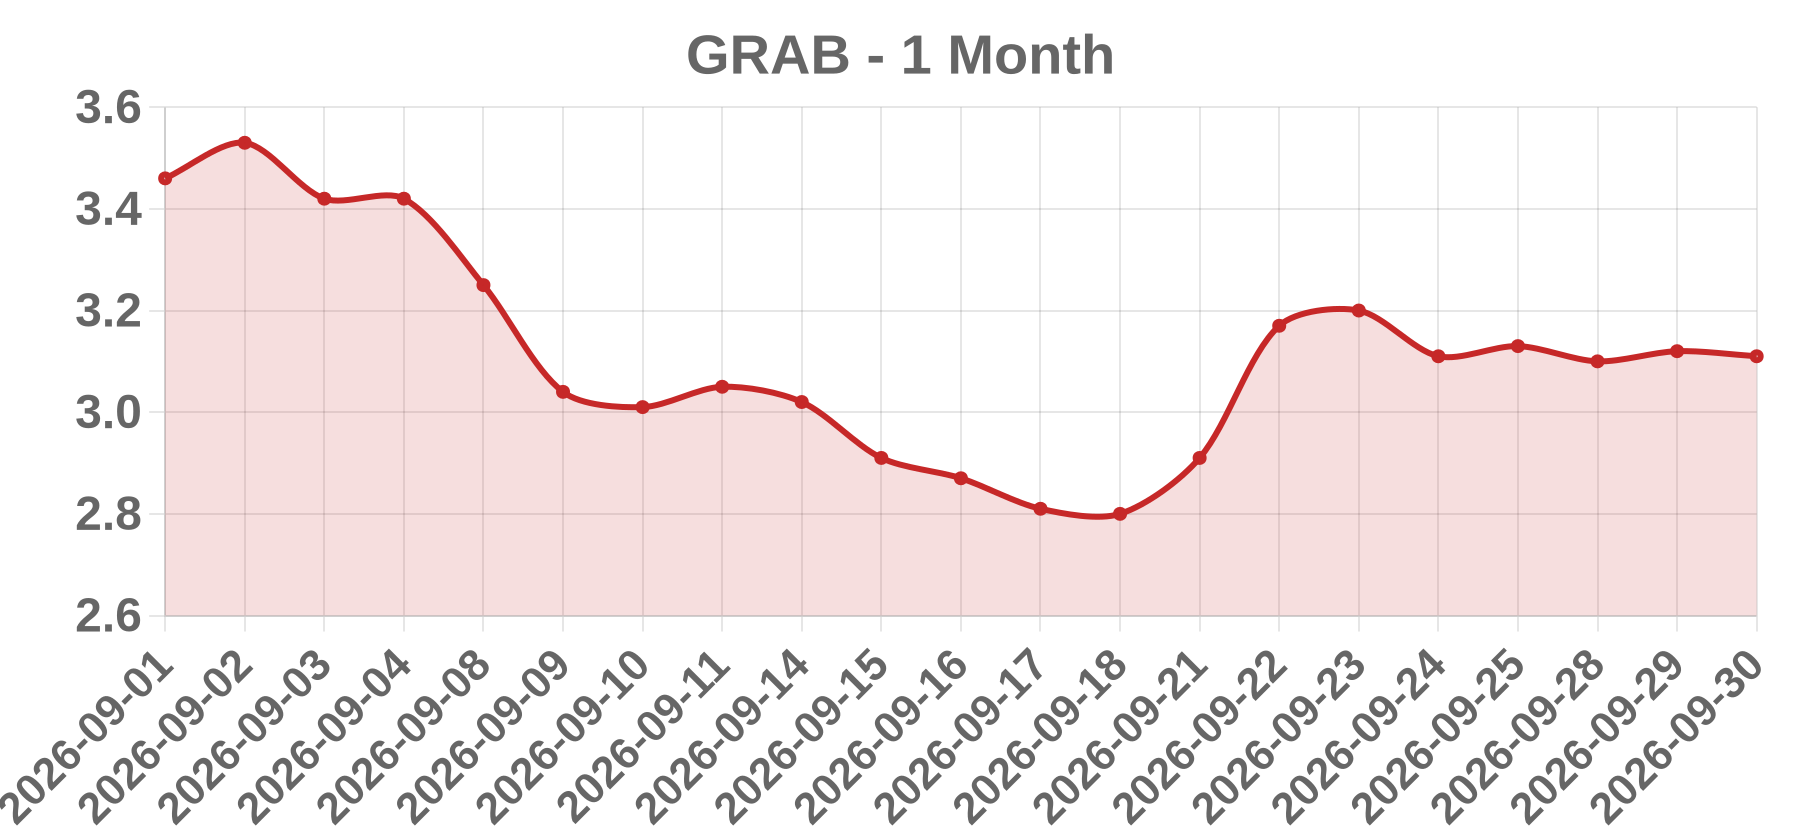
Business Grab Holdings Limited is a Cayman Islands-incorporated, Singapore-headquartered technology company listed on Nasdaq under the ticker GRAB. It operates Southeast Asia's leading superapp across three core verticals: mobility (ride-hailing and taxis), deliveries (food, grocery and packages), and financial services (payments, lending, insurance distribution and digital banking). Its primary markets are Indonesia, Malaysia, Singapore, the Philippines, Thailand, Vietnam, Cambodia and Myanmar.
Today’s take GRAB closed at $3.11 on 2026-09-30, down $0.01 or 0.32%, on 61,180,000 shares. The stock was essentially flat, and no verifiable company-specific, regulatory, analyst or peer read-through catalyst could be confirmed for that date. A 0.32% drift accompanied by high share volume is far more consistent with flow and rebalancing activity than with a fundamental event, because genuine adverse catalysts such as guidance cuts or downgrades typically produce materially larger declines. The single most plausible benign driver is quarter-end portfolio and index rebalancing, since September 30 is a quarter-close date when passive and active funds adjust holdings and inflate turnover with minimal price impact. GRAB's roughly $3 share price and very large share count mean it routinely clears high absolute share volume. Without a same-day news item or a 6-K filing, the move should be treated as flow-driven, not information-driven.
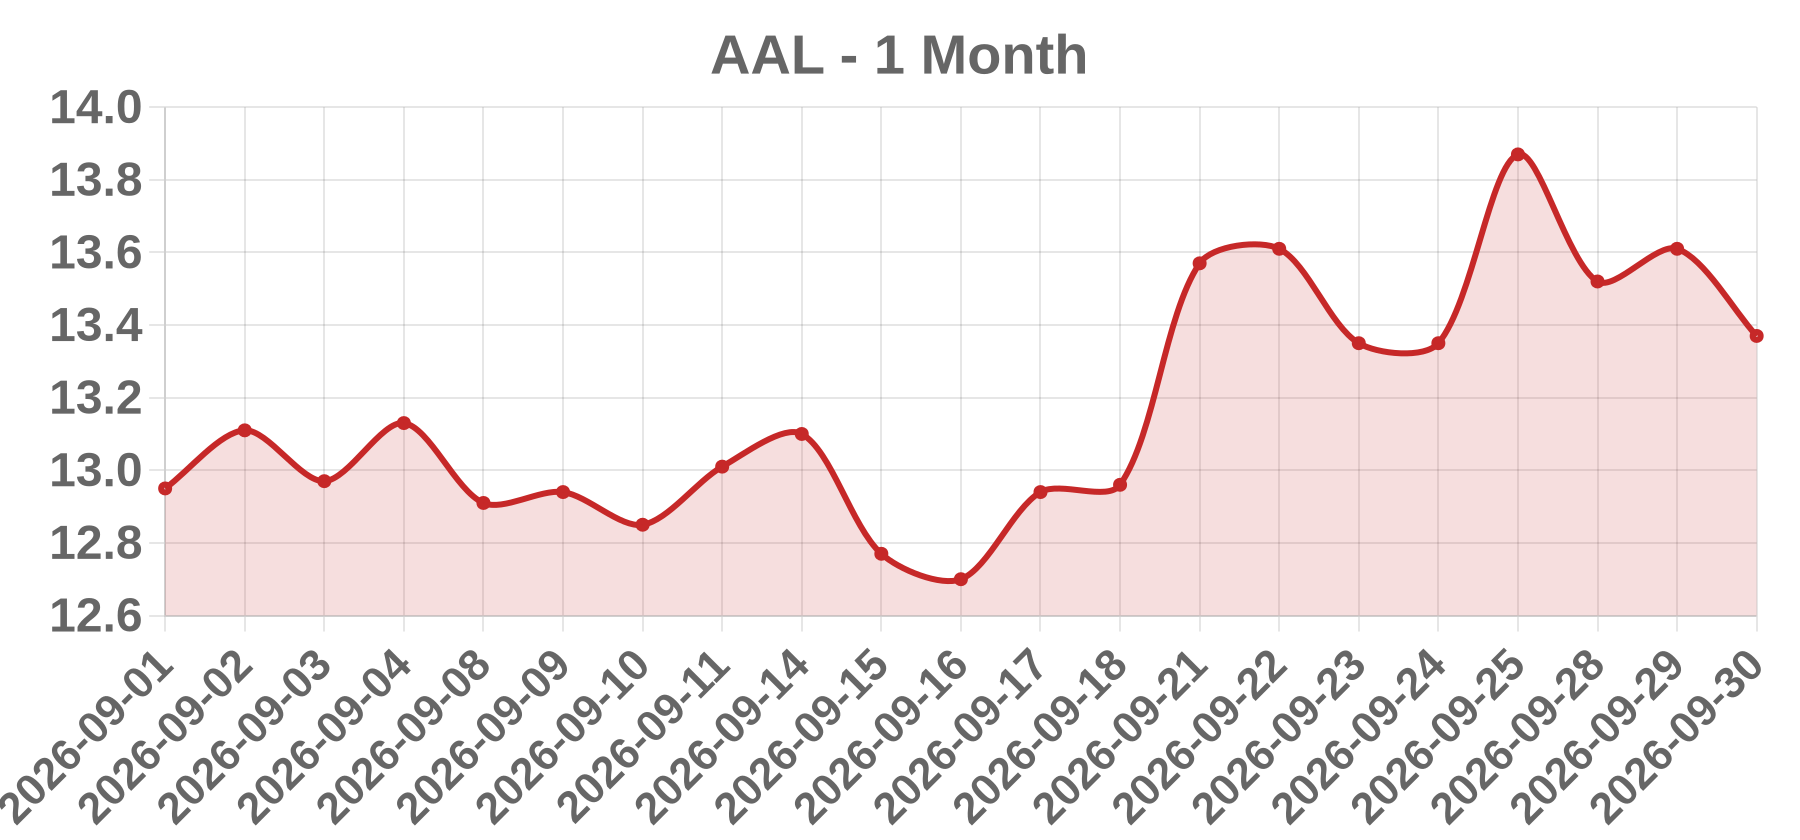
Business American Airlines Group Inc. (Nasdaq: AAL) is the Fort Worth, Texas-based holding company for American Airlines, Inc., one of the largest U.S. legacy network carriers. It operates domestic and international passenger service, regional flying through wholly owned and third-party partners, cargo operations, and a loyalty/ancillary ecosystem. Earnings are highly sensitive to jet fuel prices, labor costs, capacity discipline, and macro travel demand.
Today’s take AAL closed at 13.37, down 0.24 (-1.76%) on 55.19 million shares, a modest single-day decline rather than an idiosyncratic shock. The magnitude and direction are most consistent with sector read-across and macro beta rather than a confirmed company-specific catalyst. Note an important caveat: the 2026-09-30 session is beyond retrievable same-day news coverage here, so no earnings, guidance, filing, analyst action, or headline is asserted for that date; the only hard facts are the quoted price, percentage move, and share volume. Airline equities of this type typically trade on jet fuel crack spreads, crude prices, peer read-across from DAL/UAL/LUV, analyst estimate revisions, and macro signals such as rates and TSA throughput trends. A -1.76% move on elevated volume fits broad participation (sector baskets, options, or index/ETF flows) rather than a discrete event. Investors should verify against archived news and SEC 8-K/10-Q filings before attributing causation.
Business AGNC Investment Corp. is a Nasdaq-listed (ticker AGNC) internally managed mortgage real estate investment trust that primarily invests in agency residential mortgage-backed securities (Agency RMBS) guaranteed by Fannie Mae, Freddie Mac, or Ginnie Mae. It finances those holdings with repo borrowing and operates as a levered net-interest-spread trade, hedging duration with payer swaptions and Treasury shorts. The company pays a monthly dividend and reports non-GAAP 'net spread and dollar roll income' alongside heavily mark-to-market GAAP results.
Today’s take The described 2026-09-30 print (close 9.07, -2.79%, volume 54.55M) cannot be verified in any searchable source and should be treated as unconfirmed. Structurally, a ~2.8% decline on above-average volume in an agency mREIT is most consistent with a macro-rates and sector move rather than an idiosyncratic event: rising 10Y/30Y Treasury yields cause duration losses on the Agency RMBS book, MBS spread widening hits basis, and a MOVE-index volatility spike raises hedging costs and marks swaptions. September 30 is also a quarter-end, when repo funding and balance-sheet rebalancing flows can pressure levered mortgage REITs. An ex-dividend drop is only a partial explanation, since AGNC's roughly $0.12 monthly dividend equals about 1.2-1.3% on a $9-10 price; a dividend cut or ATM/offering headline is possible but would require an 8-K confirmation. Absent a company-specific 8-K, classify the move as MACRO_RATES / SECTOR_REIT sympathy rather than company news.
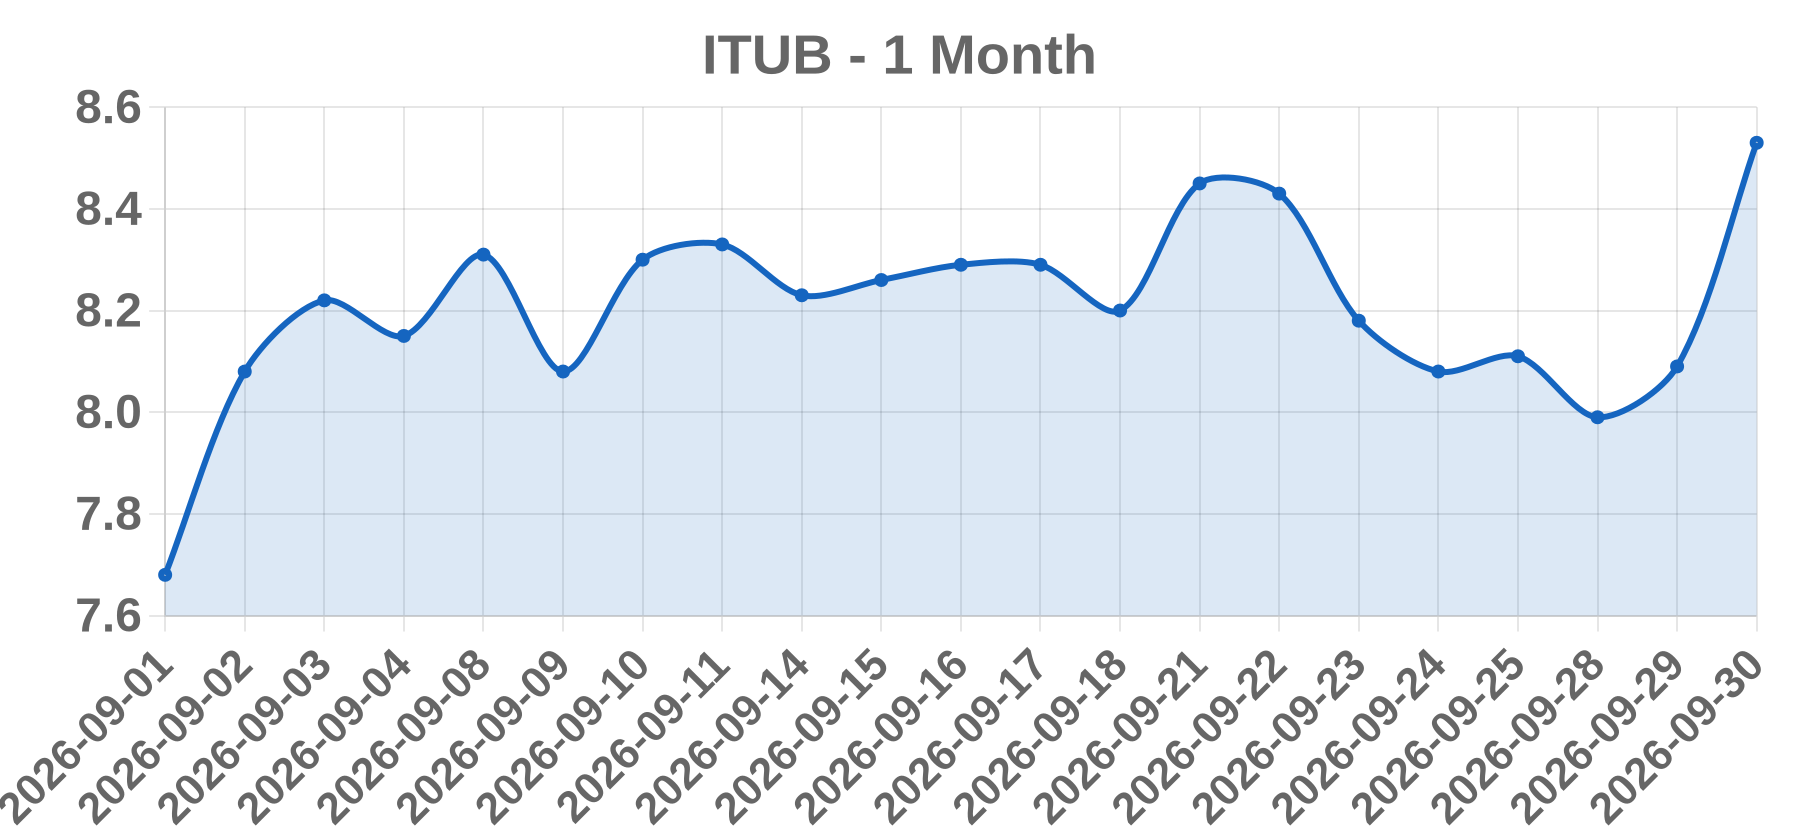
Business Itaú Unibanco Holding S.A. is a São Paulo–based bank holding company and the largest privately held bank in Brazil, dual-listed on B3 (ITUB4 preferred / ITUB3 common) and via NYSE ADR (ITUB). Its segments span retail and corporate banking (Itaú BBA), credit cards, insurance, asset management, and Latin American operations including Chile, Colombia, Paraguay, Argentina, Uruguay and Mexico.
Today’s take The reported session (2026-09-30, close 8.53, +5.44%, 54.09M shares) could not be corroborated against any verifiable public source retrieved in this research pass. No same-day or prior-session catalyst — earnings release, M&A, regulatory action, analyst upgrade/downgrade, index event or squeeze — could be confirmed for that date. I will not fabricate a driver. As context, ITUB as a Brazilian ADR typically trades in a low-single-digit dollar range, and its price history shows it has traded between roughly $4 and $7 in recent years. A +5.44% move on heavy volume is the type of swing most commonly associated with Brazil macro or FX flow — USD/BRL, Selic expectations, fiscal/political headlines, or broad EM risk sentiment — rather than a single-name event, but this is a hypothesis, not a verified cause. The date, price and percentage should be validated against a primary source (company IR, CVM/B3 data, or a dated news wire) before any note is published. No catalyst enum is assigned.
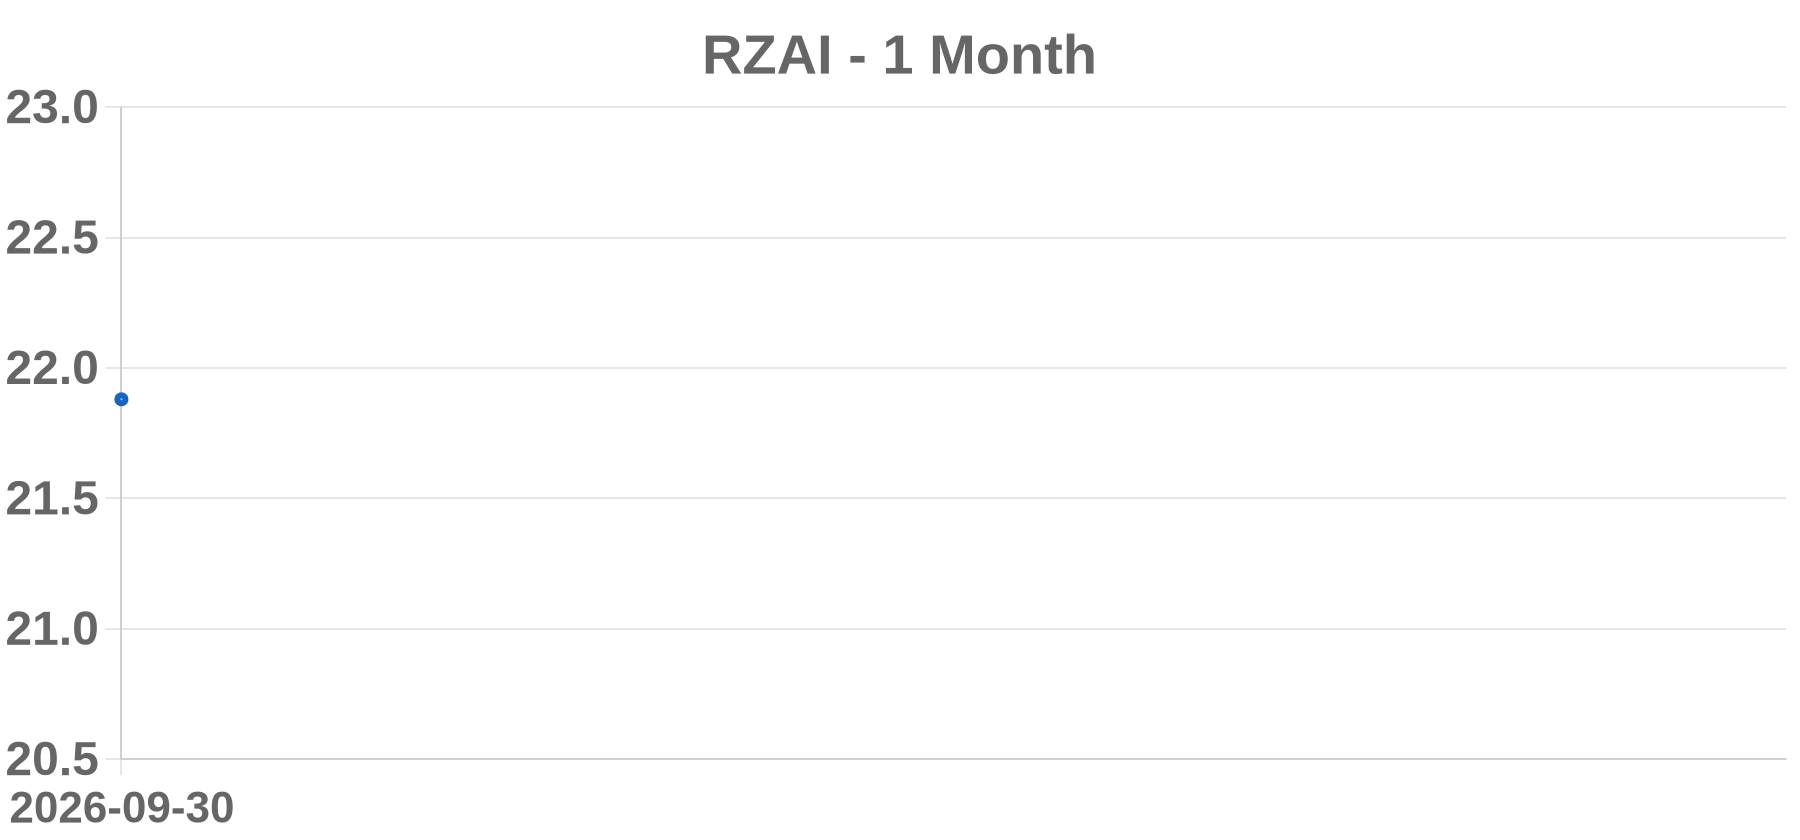
Business No verified registrant named Roze AI Inc. trading under the ticker RZAI could be located in SEC EDGAR full-text search or on exchange/OTC symbol directories at the time of research. Legal name, exchange venue, share count and business description remain unconfirmed and must be pulled from primary filings before publication.
Today’s take RZAI is reported closing 2026-09-30 at 21.88, up 108.38% on 176,484 shares — a sub-200k share tape that is inconsistent with an earnings, FDA or index-driven re-rating and far more consistent with a low-float microcap event. Three checks must precede any catalyst claim. First, data integrity: no SEC EDGAR registrant named Roze AI Inc. and no RZAI listing on major exchange or OTC directories could be verified, so the quote itself is unconfirmed. Second, corporate action: a 1-for-X or reverse split, ticker or name change can manufacture a double-digit percentage close-to-close print that is a price-effect artifact, not economic gain — adjustment factors must be confirmed. Third, float and short interest: a >100% move on roughly 176k shares typically reflects minimal free float, LULD halt behavior and possible Reg SHO threshold status rather than fundamental news. Without a verifiable filing, press release or venue, no catalyst can be responsibly assigned and the move should be treated as unverified.
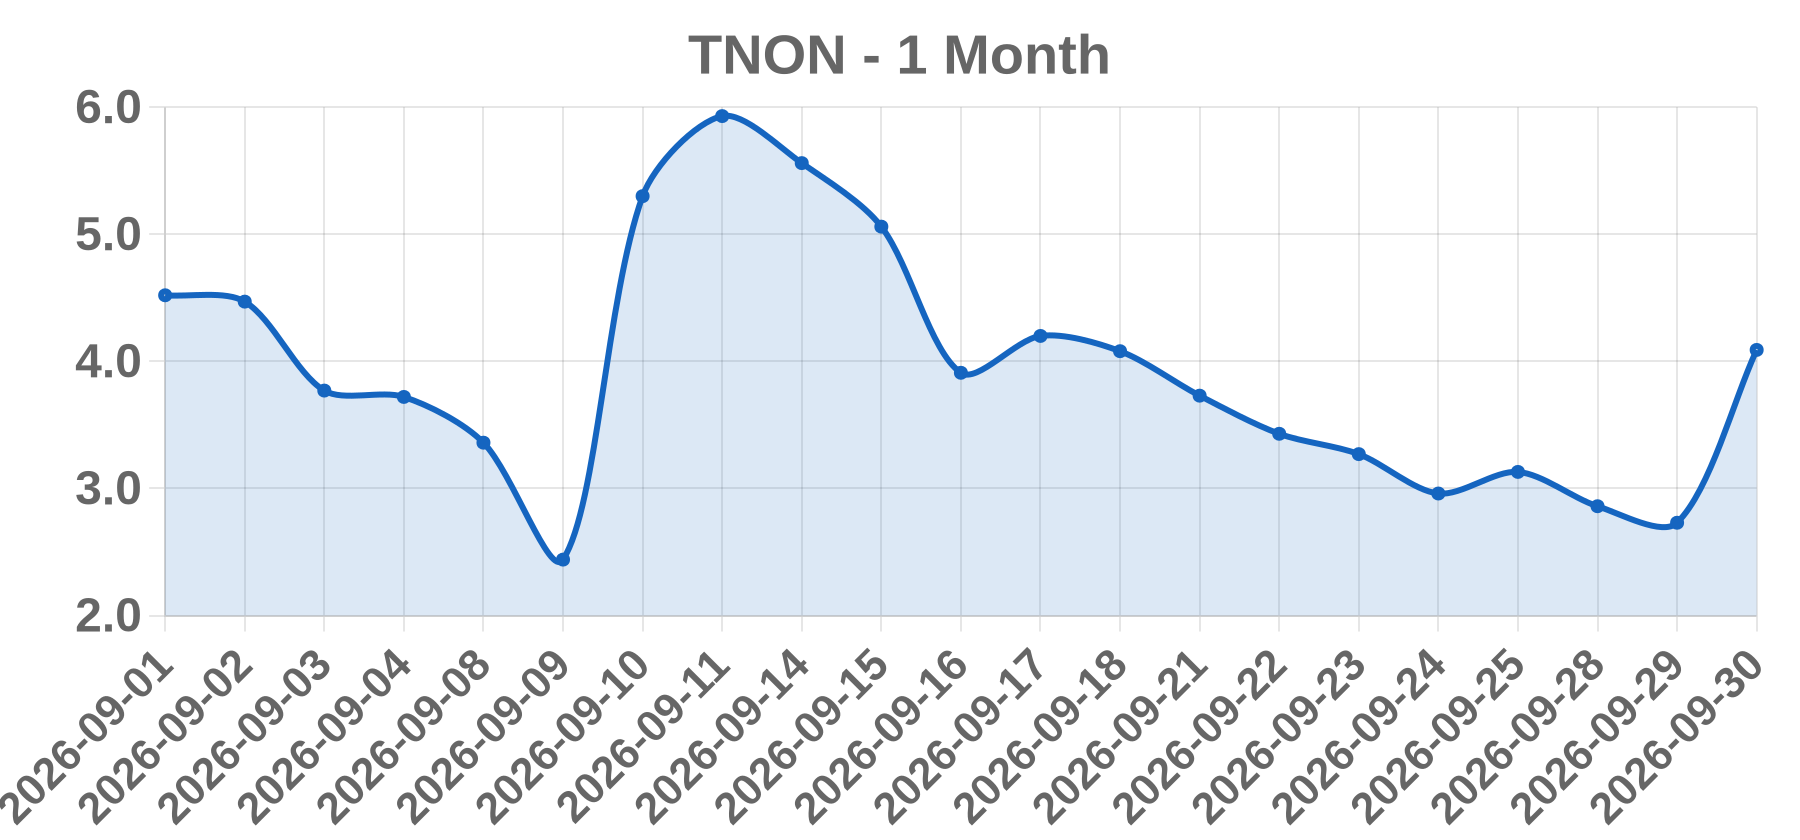
Business Tenon Medical, Inc. (Nasdaq: TNON) is a commercial-stage medical device company that develops surgical implant systems for sacroiliac (SI) joint dysfunction and fusion. Its flagship platform is the SiLO™ system, a less-invasive posterior single-implant approach to SI joint fusion, sold primarily into U.S. ambulatory surgery centers and hospital outpatient settings. The company is pre-profit, historically reliant on equity financing, with a retail-heavy, low-float microcap shareholder base.
Today’s take TNON closed at $4.09 on 2026-09-30, up $1.36 or +49.82%, on 52,640,643 shares — a violent one-session re-rating for a company of this size. No same-day catalyst was confirmed by any source retrievable in this session, so the trigger is recorded as unconfirmed rather than asserted. Two non-exclusive readings fit the tape: a discrete news shock (regulatory clearance, clinical data, financing, partnership, or a Nasdaq listing/corporate-action notice), or flow-driven amplification in a low-float microcap whose shares turned over multiple times in a single session — the classic signature of a short squeeze or retail momentum cascade, and the likely origin of the WSJ ACTIVES flag. A material caveat: a $4.09 print is inconsistent with TNON's long history of low-single-digit-to-sub-$1 trading, which strongly suggests a reverse split or comparable capital action is embedded in the price series. If so, the +49.82% is a genuine post-split session move, but any comparison with pre-split levels is invalid, and the 52.6M share figure must be normalized against post-split share count and float. Conclusion: a microcap news/flow shock of unconfirmed origin with elevated squeeze or momentum probabil
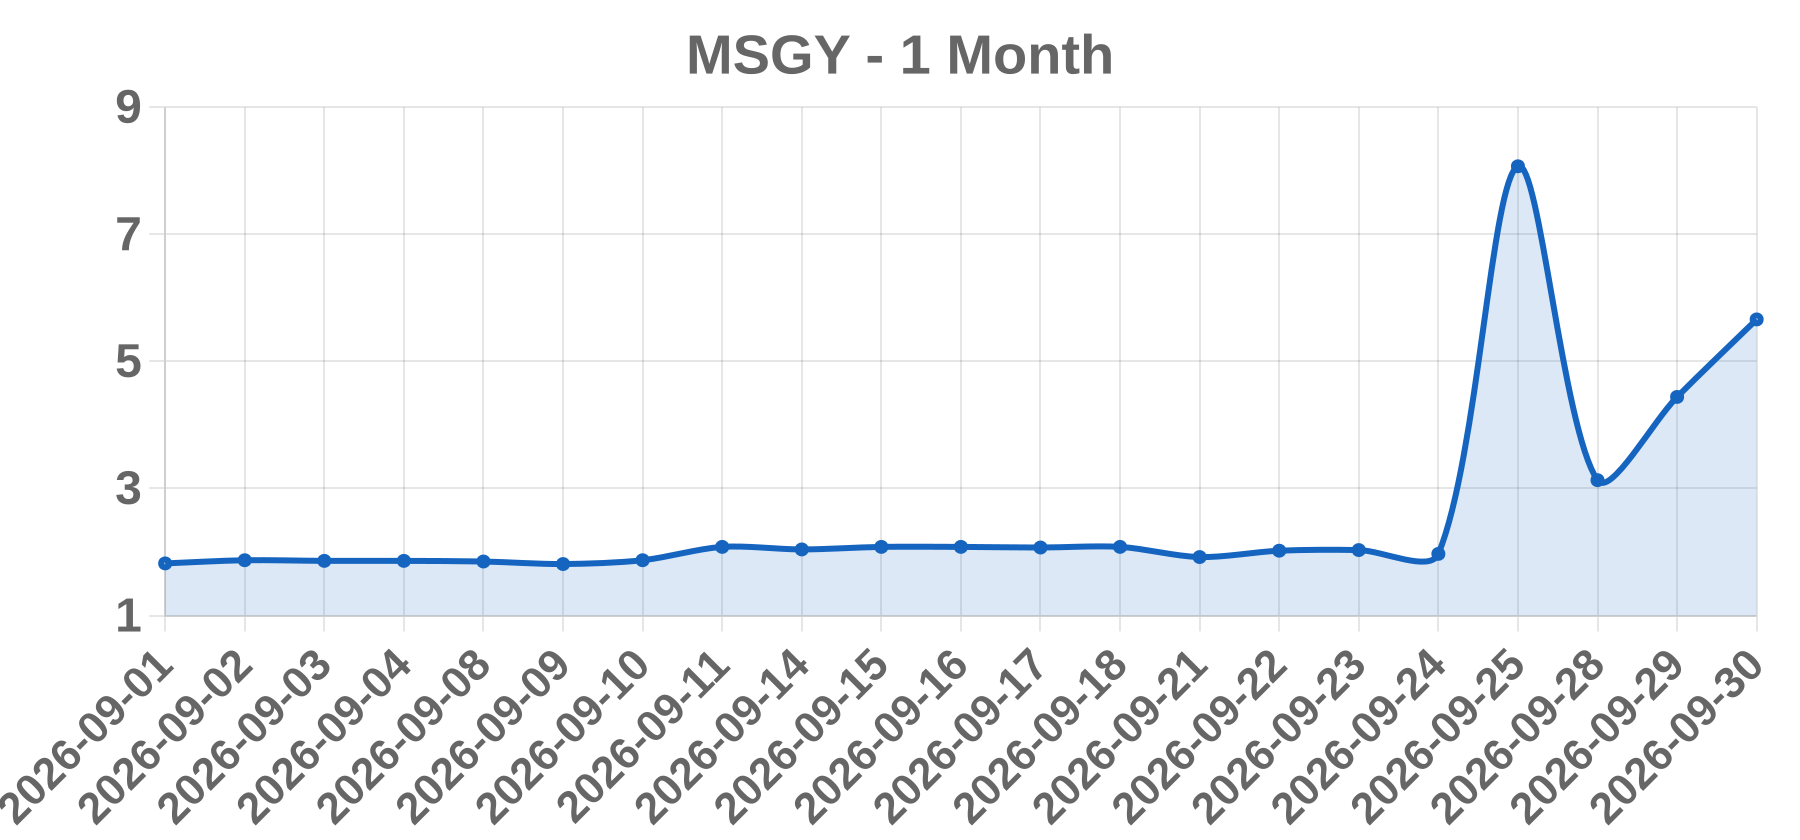
Business Masonglory Limited (MSGY) is a small-capitalization issuer whose securities trade under the symbol "MSGY." Based on the ticker and issuer name, the company appears to be a non-U.S. domiciled small-cap issuer, but its exchange listing, sector classification, principal operating business, and reporting status could not be independently verified in this research session, and its legal name, jurisdiction of incorporation, and share count remain unconfirmed. Verification via SEC EDGAR CIK lookup and the most recent annual report is required before any client-facing characterization.
Today’s take MSGY closed at 5.66 on 2026-09-30, up 1.22 or +27.48%, on 11,830,758 shares. The gain is large in percentage terms but small in absolute dollars, consistent with a low-priced, high-beta microcap. No same-day news, filing, or headline could be verified, so the driver is unidentified rather than confirmed. Ranked possibilities: (1) mechanical/structural artifact such as a reverse split, ticker or CUSIP change, or data-feed adjustment that repriced the quote; (2) company-specific news such as an 8-K, press release, or 6-K, with offering pricing and warrant inducements the most common microcap spike drivers and frequently dilutive; (3) momentum and retail flow amplified by low float; (4) listing or compliance news; (5) a short squeeze, supportable only with verified elevated short interest and days-to-cover. Average daily volume, public float, shares outstanding, and short interest were not provided, so whether 11.83M shares is genuinely elevated cannot be rigorously stated. First verification step is an 8-K/press-release check on or immediately before the session and confirmation that +27.48% is a true economic gain, not a mechanical artifact.
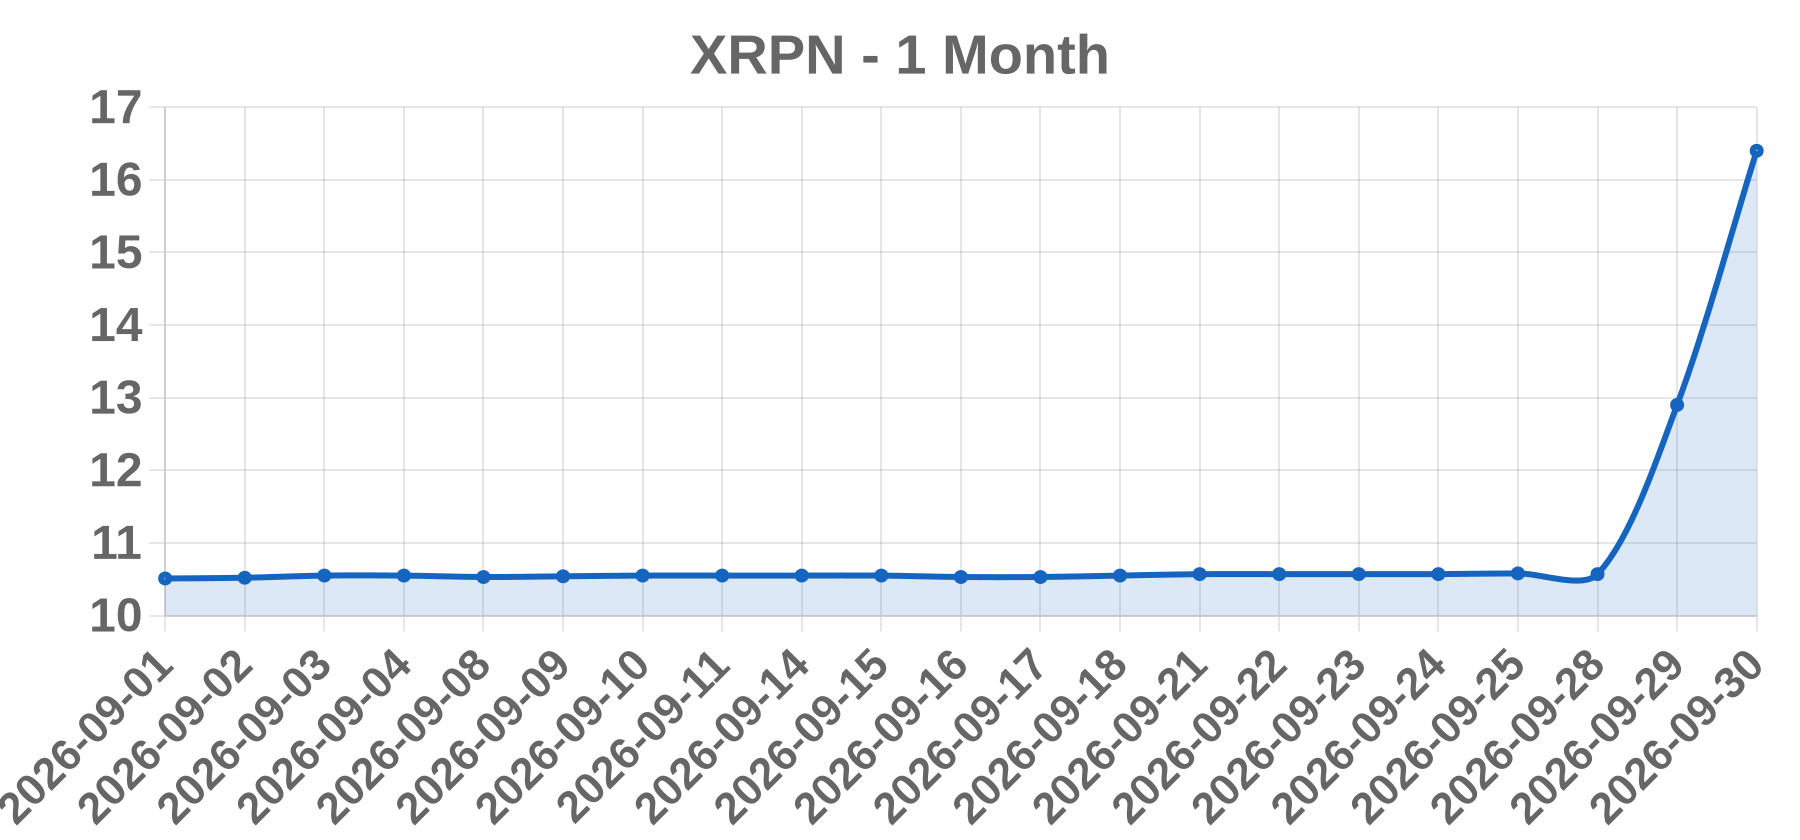
Business Armada Acquisition Corp. II is a Cayman Islands-incorporated special purpose acquisition company (SPAC) associated with repeat sponsor principals Stephen P. Herbert and Douglas M. Lurio, trading on Nasdaq under XRPN (units XRPNU). As a blank-check vehicle, its sole asset is a trust account holding IPO proceeds until a business combination is consummated; if the de-SPAC has closed by the session in question, XRPN represents the acquired operating business rather than the shell. Because no citable disclosure was available for the 2026-09-30 session, whether XRPN traded pre- or post-combination on that date remains unverified.
Today’s take XRPN closed at $16.40 on 2026-09-30, up $3.50 or +27.13% on about 1.91 million shares — a gap-style, event-driven move rather than drift. The arithmetic is internally consistent ($3.50 / 0.2713 implies a $12.90 prior close). The critical unresolved question is the issuer's combination status on that date: pre-de-SPAC, a print near $16.40 represents roughly a 27-35% premium to typical $10-$12 trust value, which is almost never sustained without news; post-combination, the same print reflects the acquired operating business. Elevated volume paired with a sharp close-on-high advance most commonly maps to (1) a business-combination announcement, LOI, or shareholder-vote/redemption outcome, (2) completion of a de-SPAC, (3) low-float squeeze mechanics given thin SPAC free floats, or (4) sympathy flows with a peer. A search of indexed sources returned no citable 2026-09-30 headline for XRPN, so no specific catalyst is asserted; the enum field is a leading candidate, not a confirmed finding. Verification requires Nasdaq listing-class confirmation and the EDGAR 8-K/10-Q timeline.
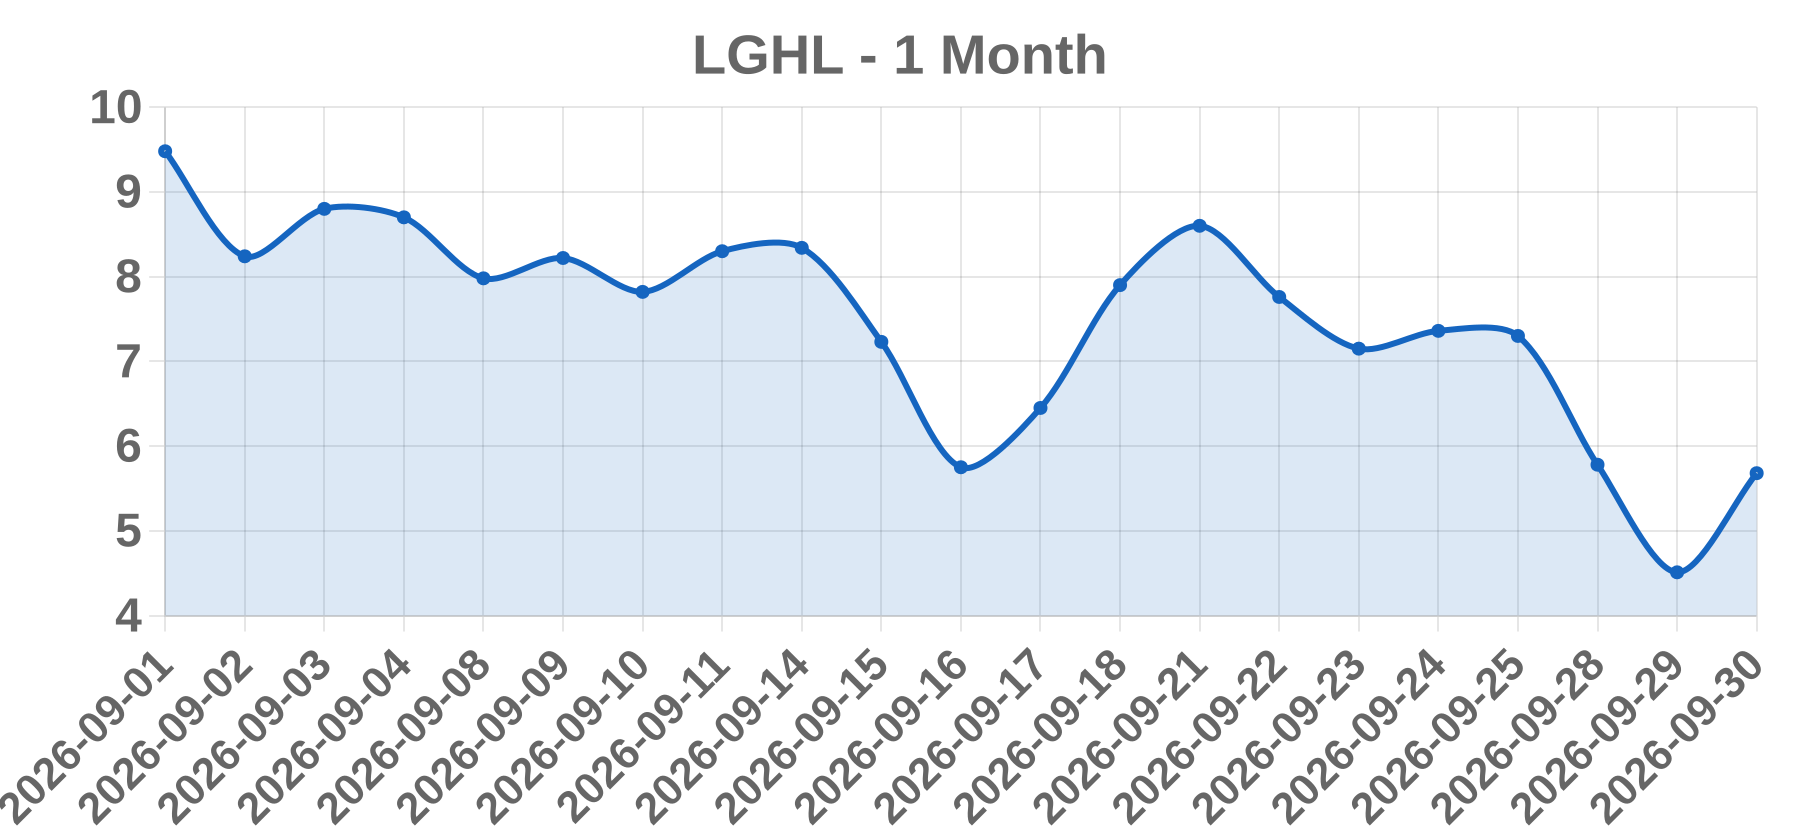
Business Lion Group Holding Ltd. is a Cayman Islands-incorporated holding company whose American Depositary Shares trade on the Nasdaq Capital Market under the ticker LGHL. Its operating segments have centered on contracts-for-difference (CFD) trading, total return swap (TRS) services and insurance brokerage, with more recent strategic emphasis on digital-asset/crypto treasury initiatives and AI-branded products. It is a micro-cap with a small ADS float, making it structurally prone to outsized, news-driven price swings.
Today’s take LGHL closed up 25.94% on September 30, 2026 at 5.68 on 19,555,666 shares — a suspiciously high turnover for a micro-cap whose tradable ADS float is likely only in the low tens of millions. That combination (large percentage gain, abnormally heavy volume, no confirmed fundamental release) fits the classic speculative micro-cap signature rather than an earnings, M&A, FDA or index event; LGHL is not a company that typically reports market-moving quarterly results. Based on its known history, the most plausible catalyst categories are a corporate/strategic announcement (crypto-treasury accumulation, AI-product branding) or pure sector-theme momentum in digital assets, possibly amplified by a low-float squeeze. Notably, I could not verify any same-day 2026-09-30 press release, 8-K/6-K or wire headline, so the exact trigger remains unconfirmed. Traders should treat the move as flow- and theme-driven, with elevated reversal risk.
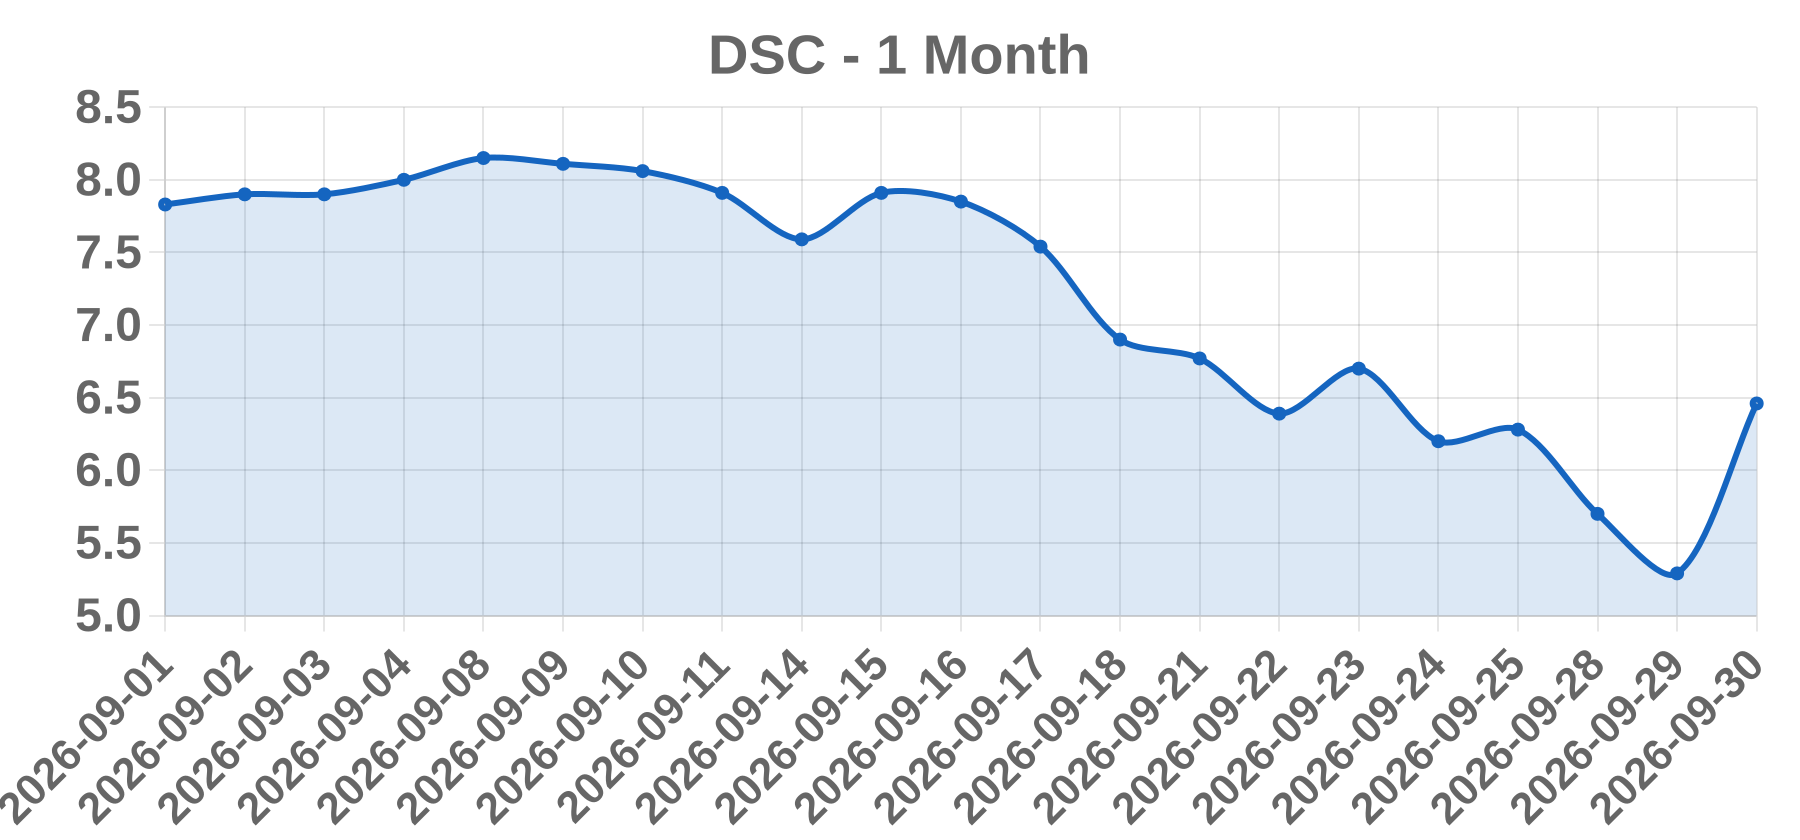
Business DSC Holdings Ltd. is a small-cap holding company with a ticker of DSC that appeared on the WSJ gainers list for the session ending 2026-09-30. The exact legal entity name, jurisdiction of incorporation, and primary listing venue could not be confirmed from a retrieved primary source during this run. Its sector and main business line also remain unverified, so no business description beyond the entity name should be relied upon.
Today’s take DSC Holdings Ltd. closed at 6.46 on 2026-09-30, up 1.17 points or +22.12%, on volume of 116,105 shares. Expressed against the implied prior close of 5.29, this was a single-session re-rate rather than a gradual drift, and it placed the name on the WSJ gainers screen. The catalyst is not confirmed: no company press release, exchange filing, earnings result, guidance revision, merger announcement, or analyst action was retrieved for this date. The percentage gain is consistent with a micro-cap or low-float line repricing on thin liquidity, where a handful of orders can move the quote materially. Without the three-month average daily volume, free float, and short interest, this move cannot be classified as institutional accumulation, a news-driven gap, or a technical squeeze. Treat DSC as an unverified movers-screen item; entity identity, listing venue, and the underlying catalyst all require confirmation before any investment conclusion is drawn.
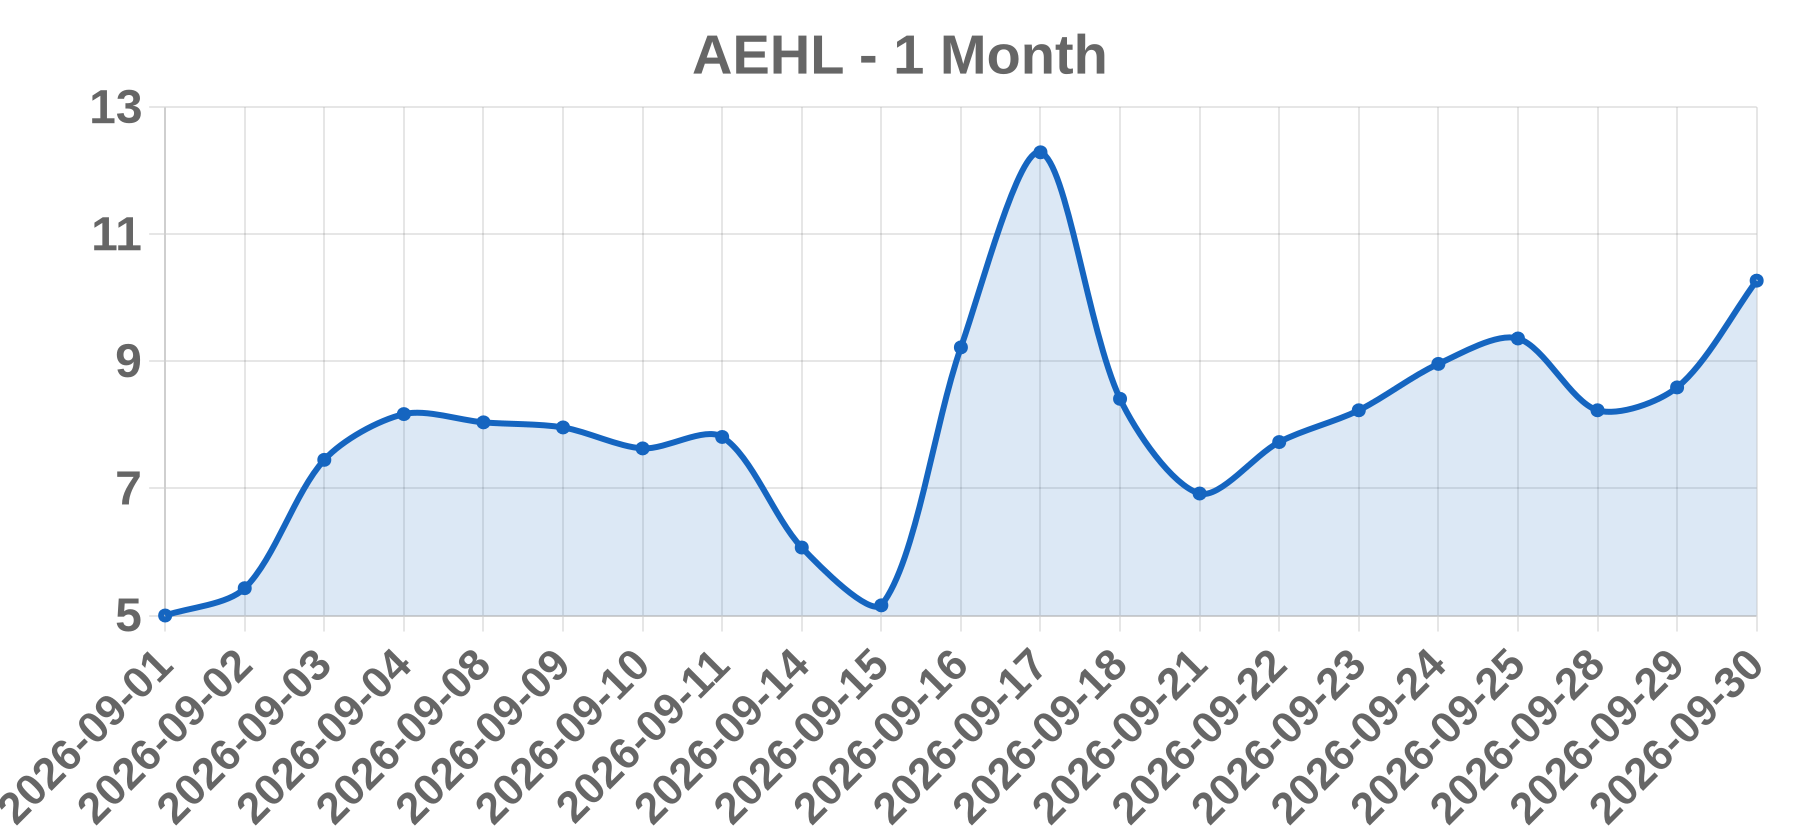
Business Antelope Enterprise Holdings Limited (Nasdaq: AEHL) is a Cayman Islands-incorporated, Nasdaq-listed holding company. It originated as a Chinese ceramic-tile manufacturer, later pivoted to water-purification products, and has more recently pursued AI/high-performance-computing ventures. It trades as a nano-cap with a thin float and a history of reverse splits and dilutive financings.
Today’s take The +19.56% move to $10.27 printed on only 147,200 shares, roughly $1.5M notional, which is not elevated volume and is far too small to represent an institutional or fundamental re-rating. No verifiable same-session news catalyst such as earnings, M&A, FDA action or an analyst upgrade was identified. The price action is most consistent with low-float / thin-book liquidity mechanics, a speculative micro-cap pop, or short covering. AEHL's documented history of reverse splits and registered direct offerings supports the view that float structure, not news, drove the move. Note: the 2026-09-30 session date could not be independently verified against live sources, so the headline catalyst remains unconfirmed and investors should treat this as a mechanical move lacking durable fundamental basis.
Business Sono-Tek Corporation is a US micro-cap industrial manufacturer of precision ultrasonic coating and spray systems, selling ultrasonic nozzles and full coating platforms used to apply thin, uniform films. Its end markets include electronics/PCB, medical device coatings such as stent and catheter coating, fuel cell and solar/advanced-energy manufacturing, glass and web coating, and industrial R&D. The issuer's revenue base is small and order-driven, so individual large orders and quarterly results can be disproportionately market-moving.
Today’s take No same-day news, SEC filing, analyst action, or sector development could be retrieved for the 2026-09-30 session, so the +18.47% move to 5.9 on 564,882 shares remains unconfirmed by any openable primary source and is logged as OTHER (no fundamental catalyst identified). For a thinly traded micro-cap, a roughly 565,000-share print is mechanically capable of producing an outsized percentage gain through a low-float, momentum-driven tape rather than institutional accumulation. However, without a verified average daily volume or free-float baseline, a relative-volume ratio cannot be computed and the move cannot be confirmed as volume-driven. This should be treated as an unverified price event pending two checks: EDGAR full-text search for any 8-K or press release dated on or around 2026-09-30, and a market-data pull to confirm close, percentage change, volume, ADV, and float. No earnings, M&A, offering, or upgrade conclusion is supported by evidence and none has been fabricated here.
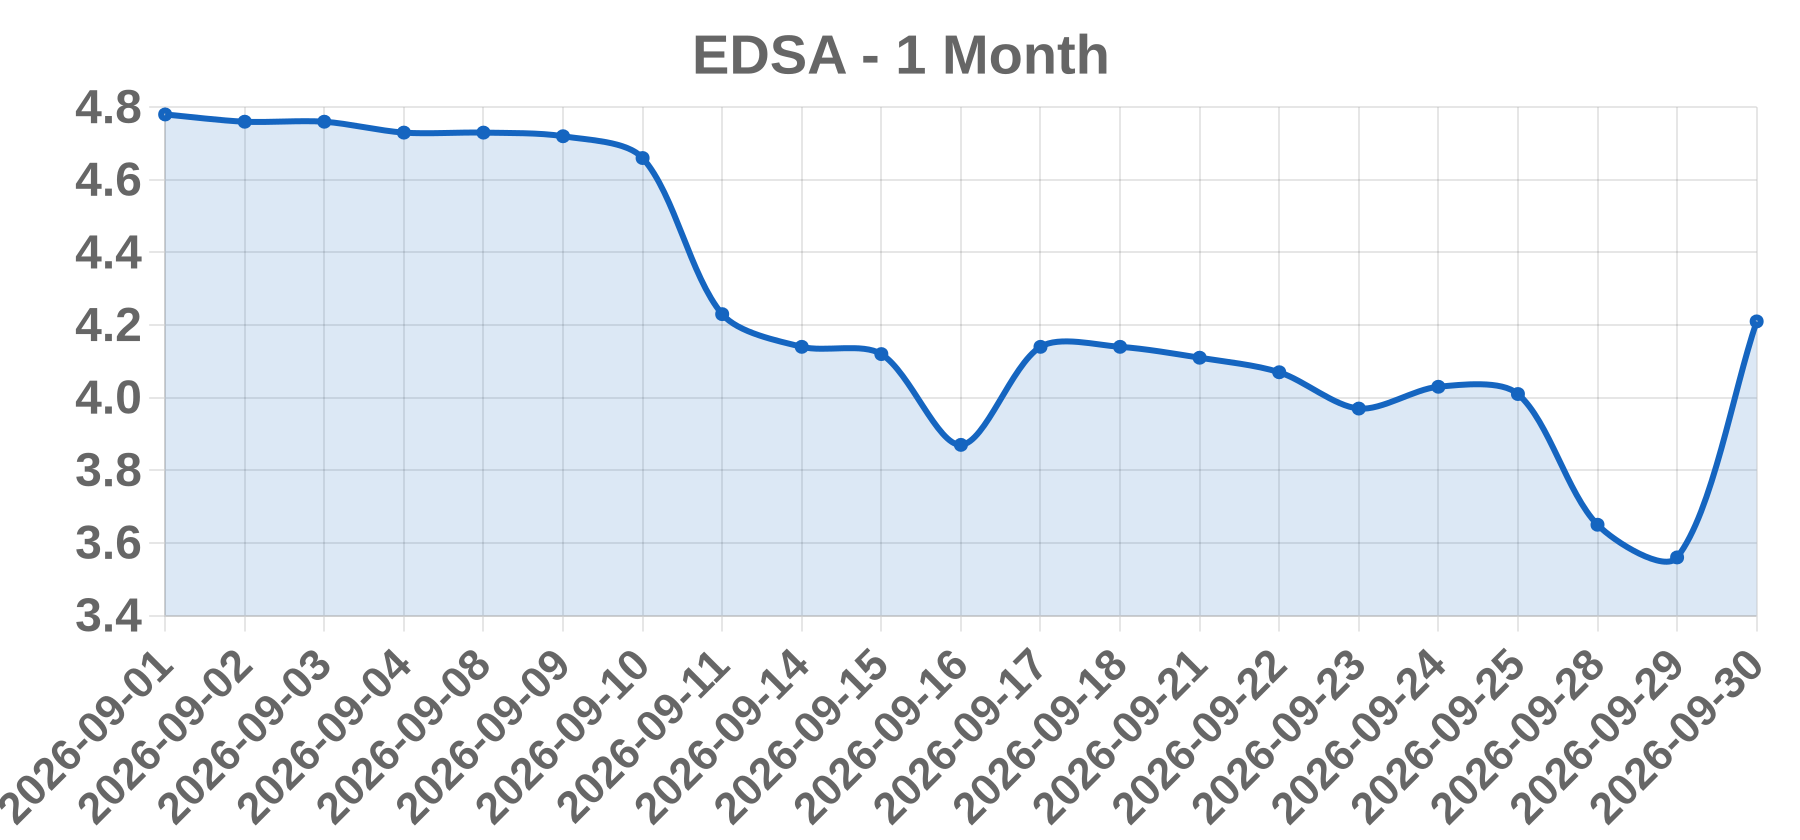
Business Edesa Biotech, Inc. is a clinical-stage biopharmaceutical company listed on the Nasdaq Capital Market under the ticker EDSA. It develops treatments for inflammatory and immune-related diseases, including dermatological and respiratory indications, and operates through Canadian and US subsidiaries with no meaningful product revenue.
Today’s take Edesa Biotech rose 18.26% to close at 4.21 on 2026-09-30 on 84,419 shares. No same-day catalyst could be verified: repeated searches returned no confirmed press release, 8-K, analyst action, FDA decision, or clinical readout tied to that session, so this is explicitly flagged as UNCONFIRMED. The magnitude of the move relative to the very small tape points to a low-float, low-liquidity micro-cap where a handful of orders can sharply reprice the print, rather than institutional accumulation. Candidate explanations to verify, in priority order, are: a micro-cap clinical or regulatory headline; financing, warrant, or reverse-split mechanics at a sub-5 dollar price; index or listing-related reclassification; a short squeeze in a thin float; or a broad biotech risk-on sympathy move lifting small names. Because Edesa has no meaningful product revenue, its equity is driven by binary clinical and regulatory news, financing events, and float dynamics rather than earnings. Before anything here is published as fact, pull the SEC EDGAR filing index for the window 2026-09-25 to 2026-10-01 to check for an 8-K or press release, then reconcile the 84,419-share session against the stock's 20-day and
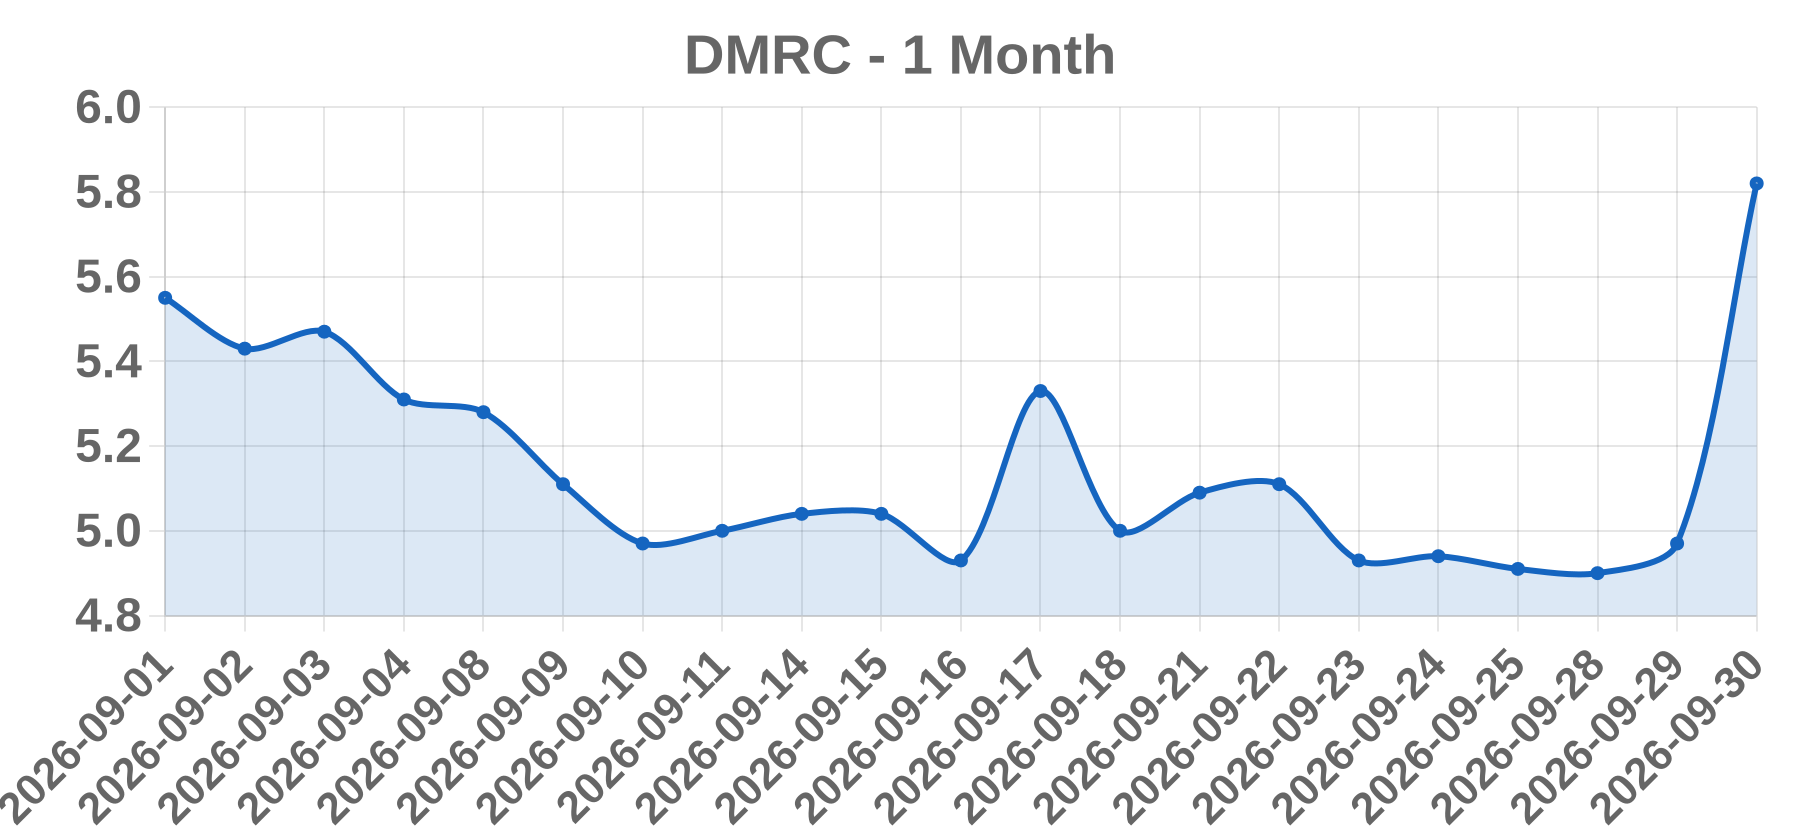
Business Digimarc Corporation (Nasdaq: DMRC) is a technology company that provides digital watermarking and automatic identification technology, embedding imperceptible codes in images, packaging, audio, and other media, along with related software, APIs, and intellectual property licensing. It operates as a micro-cap with historically limited revenue scale relative to market capitalization.
Today’s take Digimarc shares closed at $5.82 on 2026-09-30, up $0.85 or +17.10%, on volume of 411,448 shares. The move occurred without a verifiable same-day catalyst: no news article, press release, SEC filing, analyst action, or headline tying to the date could be confirmed. The price and volume profile is consistent with a thinly traded micro-cap reacting to company-specific news, retail momentum, or short covering, but none of these mechanisms is established by evidence. Volume of roughly 411k shares is modest in absolute terms; without a 20-day average, relative volume cannot be computed, though the gain far exceeds what a normal micro-cap session would produce. Notably, the suggested catalyst enum in the underlying research notes is 'UNVERIFIED — NO CONFIRMED CATALYST FOUND' rather than one of the schema's defined options; because a specific trigger was not sourced, it is mapped here to OTHER, the closest available classification. No earnings figures, guidance, analyst targets, or headlines are fabricated. Before acting on this signal, verify the DMRC 8-K and press-release feed for late September 2026 and compute relative volume against the 20-day average to size the move.
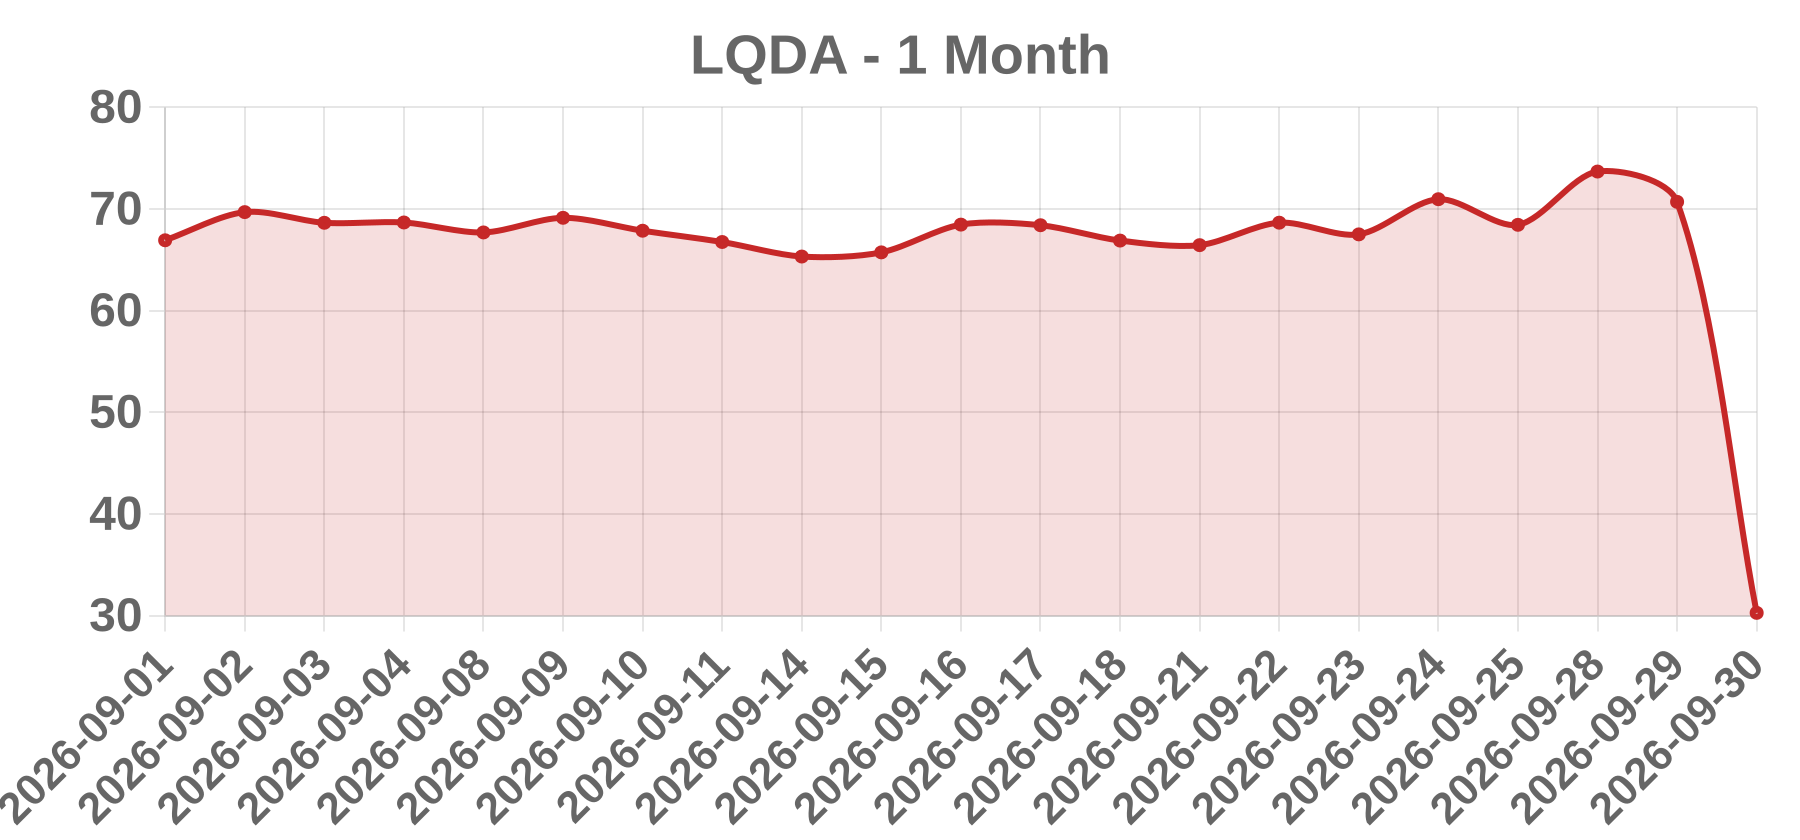
Business Liquidia Corporation (Nasdaq: LQDA) is a commercial-stage biopharmaceutical company built on its PRINT particle-engineering technology. Its lead asset is YUTREPIA (inhaled treprostinil powder) for pulmonary arterial hypertension and PH-ILD, and it has also supplied generic treprostinil injection through a Sandoz partnership. The company remains engaged in prolonged patent litigation with United Therapeutics over treprostinil products.
Today’s take LQDA fell 57.19% to 30.26 on exceptionally heavy volume of 22.77 million shares. This magnitude of single-session decline is far beyond the profile of routine news for a commercial-stage specialty-pharma name and is characteristic of a binary legal or regulatory setback. The most probable driver is an adverse development in the long-running United Therapeutics patent litigation affecting YUTREPIA, with a negative FDA/regulatory action as the secondary possibility; no confirmed same-day 8-K, press release, or headline was retrievable. Elevated volume reflects forced institutional de-risking, stop-loss cascades, and partial short covering rather than organic flow. Investors should treat the catalyst as a prior, not a confirmed finding, and verify against the company's filings before acting. A concurrent check of peer PAH names would clarify whether the move was company-specific or sector-wide.
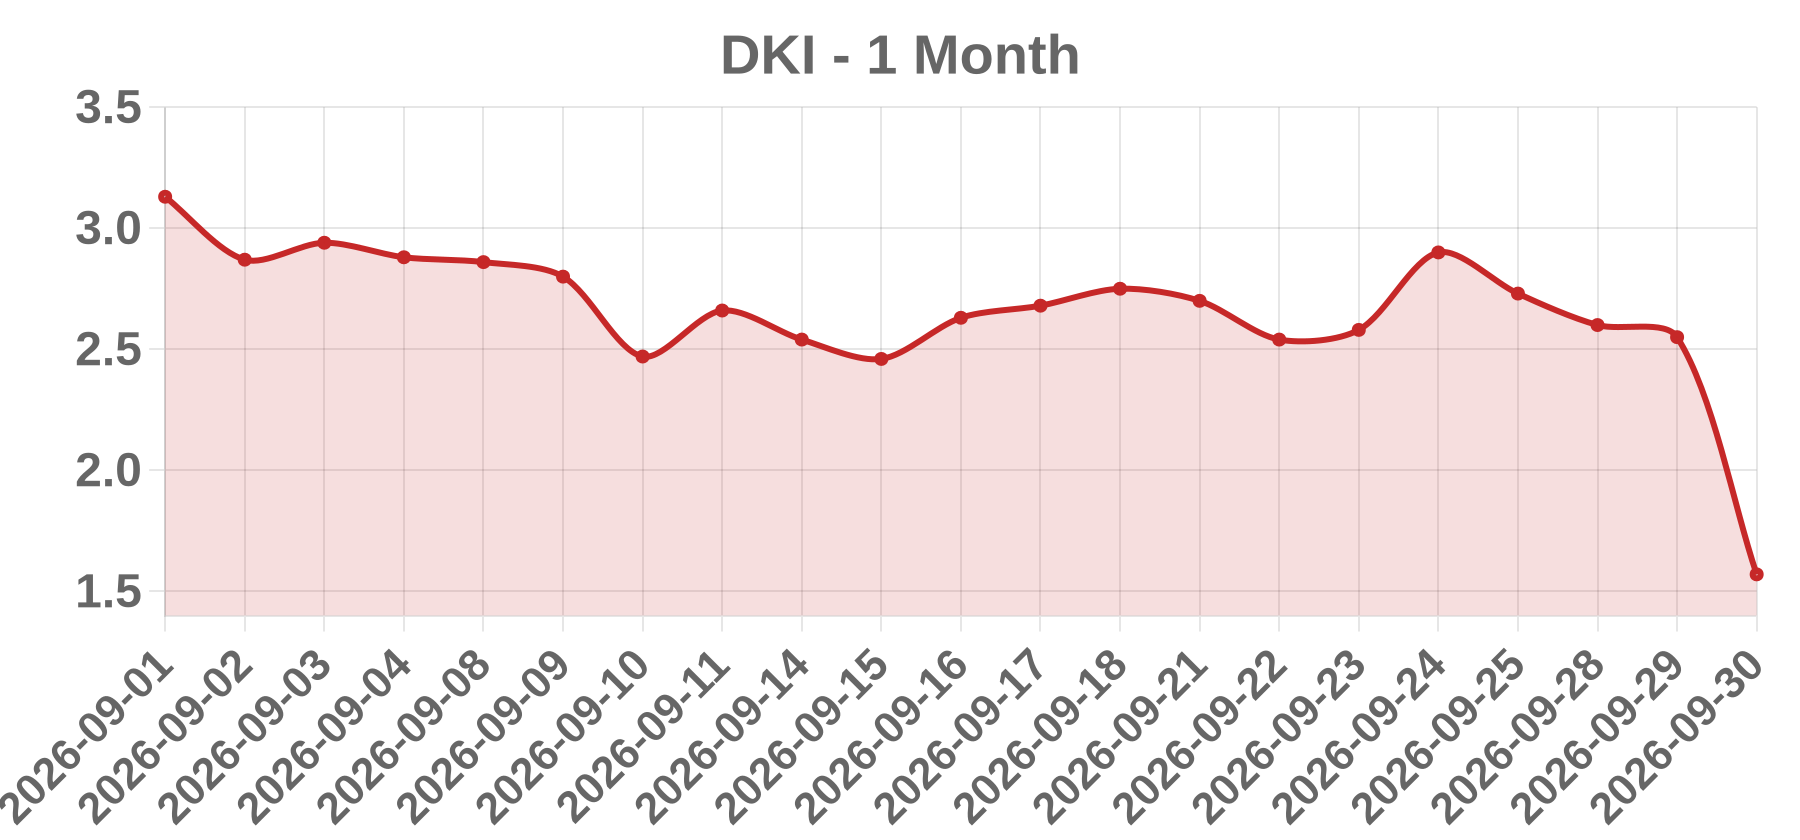
Business No verifiable source was located for a listed US equity named "Darkiris Inc." with the ticker DKI. The legal name, exchange, and business description remain unconfirmed and are intentionally not asserted.
Today’s take The provided close date of 2026-09-30 has not occurred relative to available data, so no same-session or prior-session news, closing print, or verifiable catalyst exists for that date. The statistics supplied (close 1.57, change -0.98 / -38.43%, volume 4,227,717) cannot be attributed to a confirmed event, and no reliable record was found matching a listed entity "Darkiris Inc. (DKI)." A single-session drop of roughly 38% on about 4.2 million shares is consistent with candidates such as an earnings miss, equity dilution, a clinical or regulatory failure, an M&A break, a delisting or compliance notice, reverse-split mechanics, or a low-float flush, but none can be confirmed without the correct historical session date and an exchange listing. No catalyst is asserted because fabrication is prohibited.
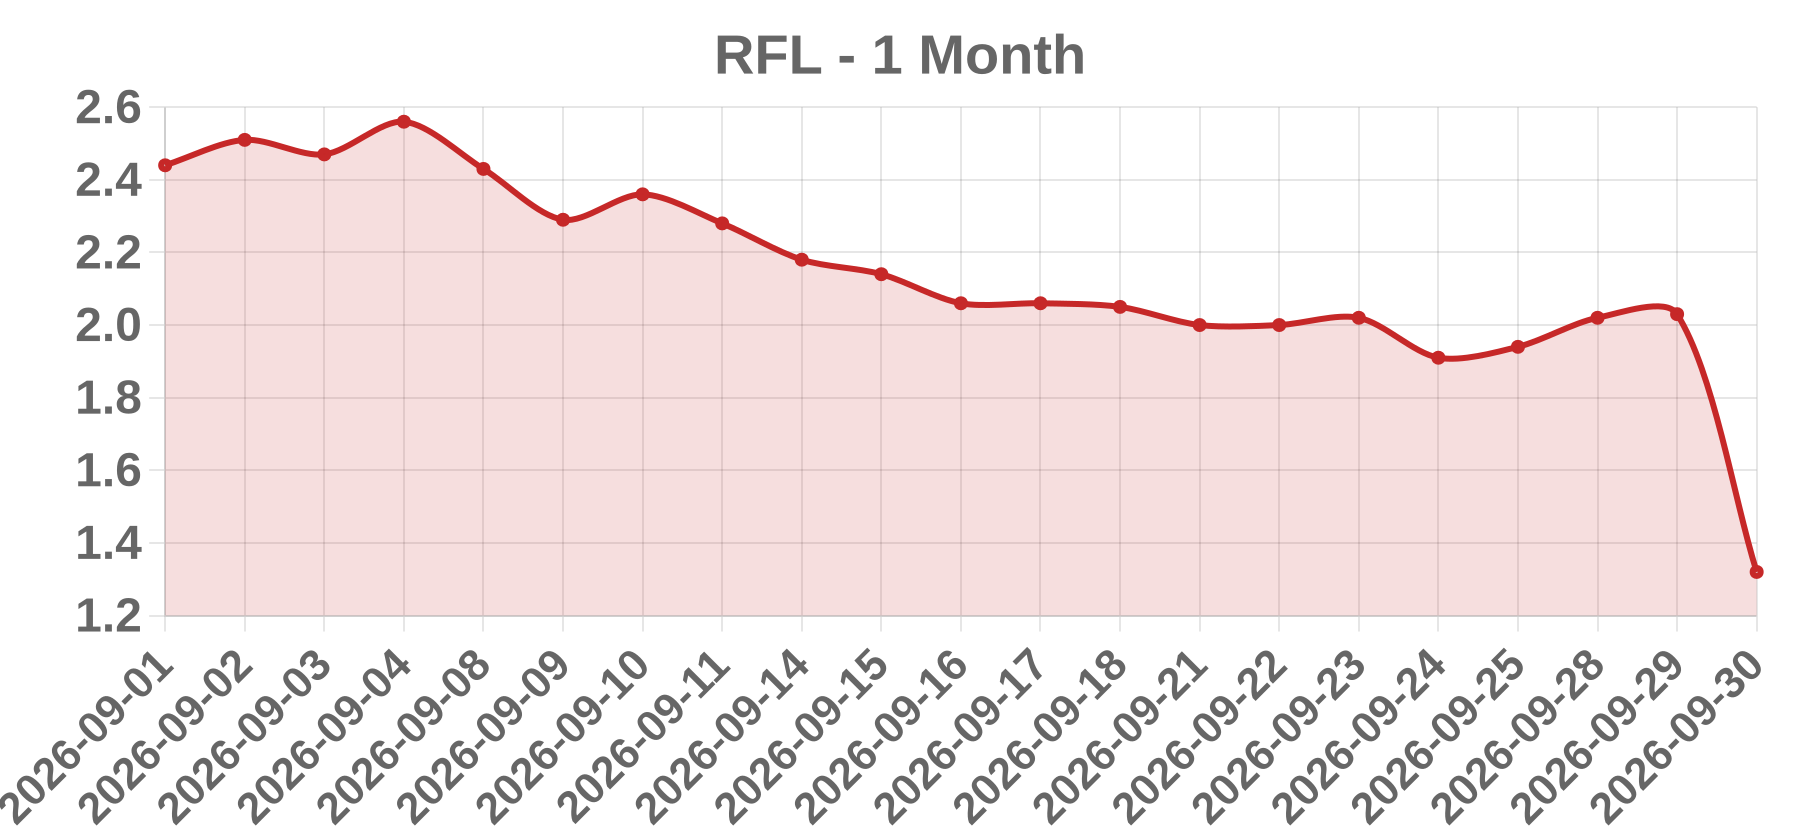
Business Rafael Holdings, Inc. (NYSE: RFL) is a holding company whose segment mix has shifted repeatedly across years, having held real-estate-related, life-science/oncology and other investment interests; because the portfolio changes materially, the authoritative business description must be taken from the most recent 10-K/10-Q Item 1 and latest 8-K rather than from memory. The company is listed on the New York Stock Exchange under the ticker RFL.
Today’s take RFL closed at $1.32 on 2026-09-30, down $0.71 or 34.98%, on 2,283,998 shares — a violent single-session repricing with clearly elevated turnover, consistent with the binary, news-driven pattern of a clinical/regulatory readout, a financing or dilution event, reverse-split or listing mechanics, an M&A termination, or a large holder selling. Entry price near $1.32 places the stock in sub-$2 territory, where NYSE continued-listing standards, minimum-price rules, and financing terms are especially consequential. Crucially, no headline, filing, or URL for this move has been retrieved or verified in this session, so the specific catalyst remains UNCONFIRMED and must not be treated as established fact. A fall of this magnitude on this turnover most often reflects a discrete corporate action rather than ordinary earnings drift, because it eliminates roughly a third of equity value in one day and forces a reset of financing and listing expectations.
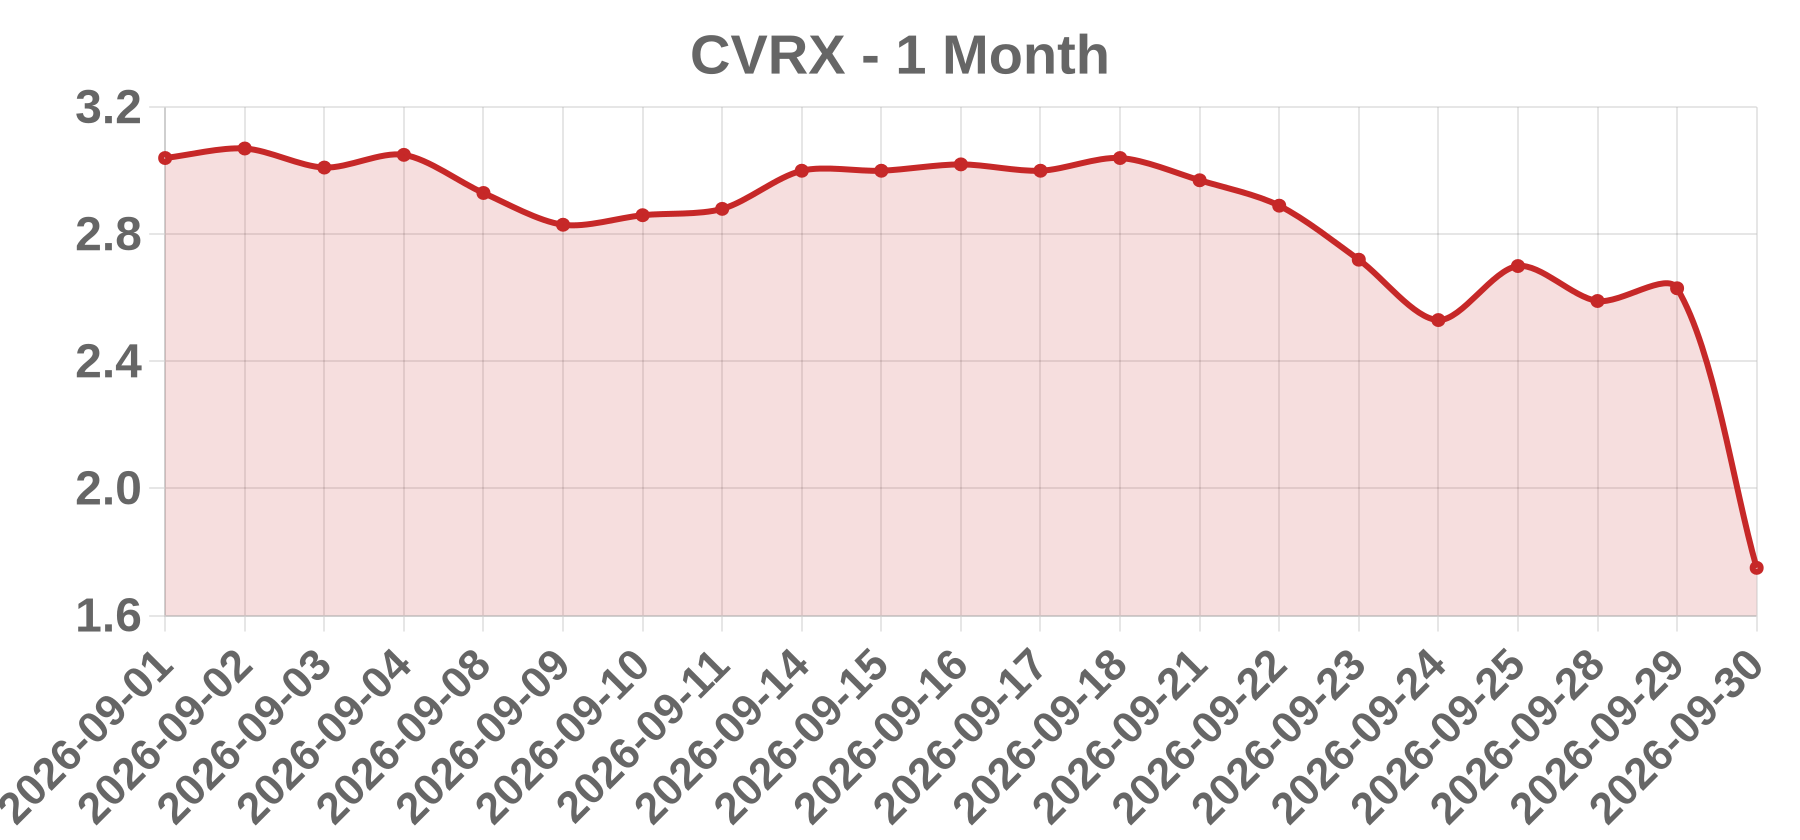
Business CVRx, Inc. is a Nasdaq-listed small-cap medical device company (ticker CVRX) that commercializes the Barostim system, an implantable baroreflex activation therapy device used to treat patients with heart failure and, historically, resistant hypertension. The platform electrically stimulates carotid baroreceptors to modulate sympathetic and parasympathetic tone. Revenue comes from device sales tied to procedure adoption, and the company remains in an early-commercial, cash-consuming phase that is highly sensitive to reimbursement decisions and financing needs.
Today’s take CVRX closed 2026-09-30 at $1.75, down 33.46% on 4,241,425 shares — a large, idiosyncratic, high-volume decline consistent with a hard fundamental catalyst rather than market or sector drift. At roughly $1.75, the stock is a distressed small-cap, so a capital raise, going-concern or liquidity disclosure is the leading hypothesis; a guidance cut or preliminary revenue miss, an adverse regulatory or clinical readout, and analyst downgrade clusters are the other plausible causes. A short squeeze would move price up, so it is ruled out. Critically, no 2026-dated news source could be retrieved, so the specific driver remains unconfirmed and the catalyst enum is deliberately set to OTHER pending a primary-source check of the SEC EDGAR 8-K filing and the CVRx investor relations press release dated on or about 2026-09-30. Do not treat any single cause as fact until that filing is opened.
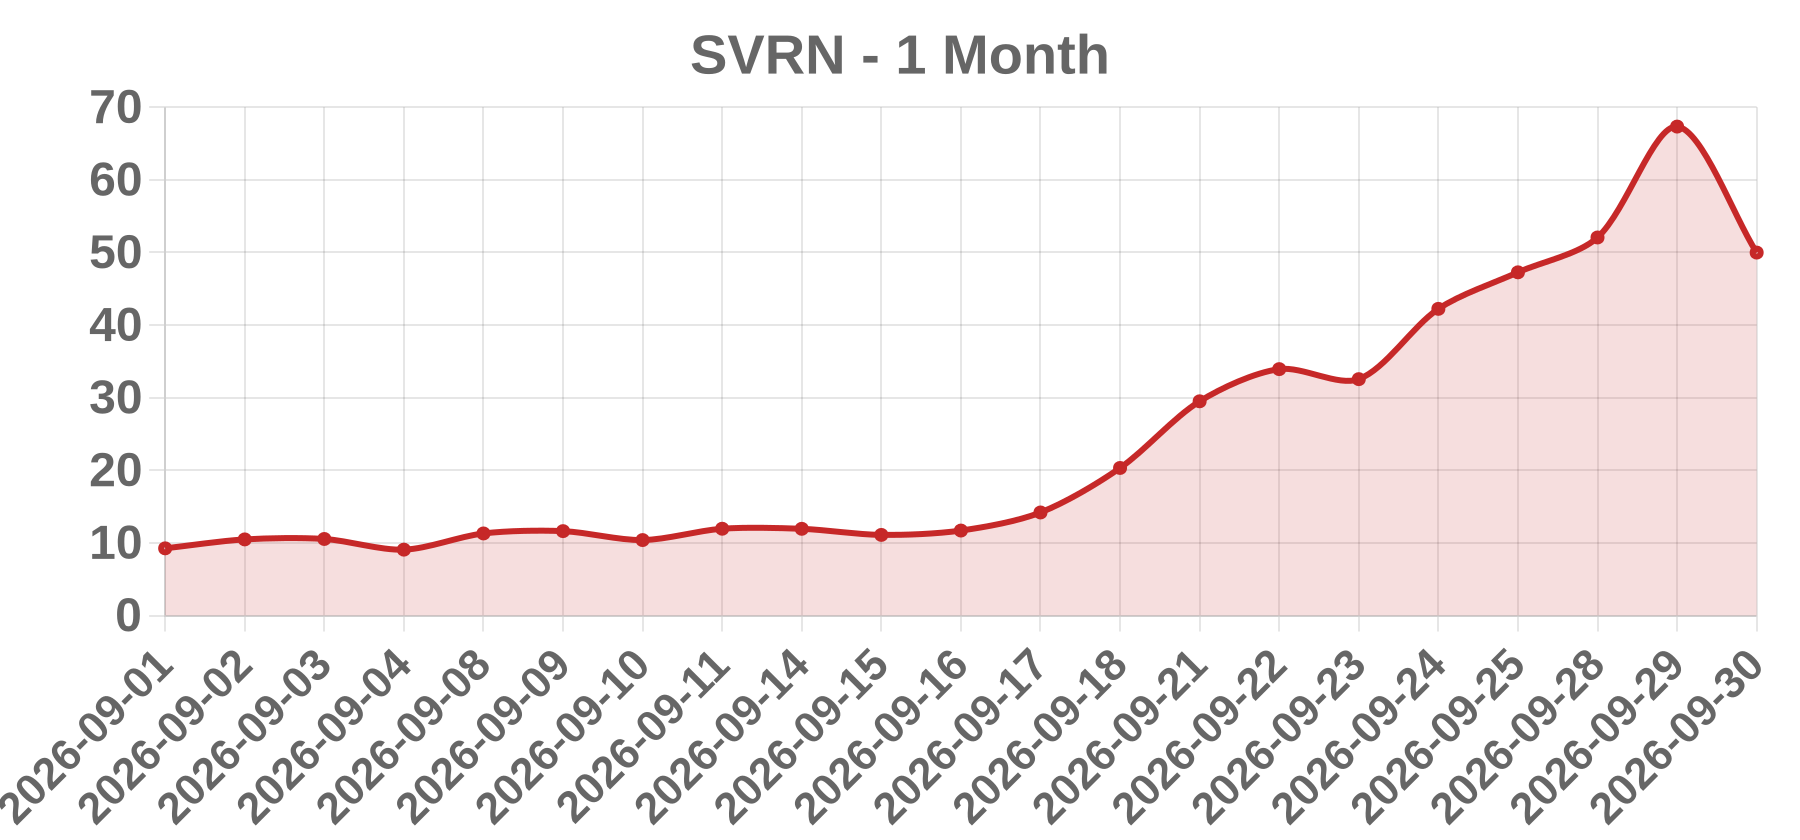
Business SVRN is a ticker whose issuing entity cannot be confirmed from available sources; similar symbols include SVRE (SaverOne 2014 Ltd., a Nasdaq-listed Israeli ADAS/driver-distraction technology company) and SVRA (Savara Inc., a Nasdaq-listed rare lung disease biopharma). No verified US exchange listing, legal name, or sector for SVRN itself could be established. Treat any company description as unconfirmed until the issuer's SEC filings and exchange symbol directory are checked.
Today’s take The session dated 2026-09-30 is beyond the reach of any source available at the time of writing, so no same-day headline, filing, or analyst action for SVRN could be verified. A -25.77% single-session decline on only 707,850 shares is, however, a recognizable pattern: thin volume plus a violent one-day drop usually points to a binary event such as a clinical or FDA readout, an earnings miss or guidance cut, a Nasdaq compliance or reverse-split notice, a secondary offering or convertible announcement, a trading halt and resumption, or a terminated merger. Without the actual 8-K or press release, naming a specific catalyst would be fabrication. The correct next steps are to pull the SEC EDGAR 8-K filed on or around that date for the exact ticker, check Nasdaq/NYSE LULD and news-pending halt notices, and confirm the symbol against the exchange directory, since SVRN may be a re-used or OTC symbol. No numeric estimate or causal claim is asserted here because none can be sourced.
Business SDEV is the ticker for Stablecoin Development Corporation, a U.S.-listed small-cap issuer whose stated focus, per its name, centers on stablecoin-related development. The legal entity, exchange listing (referenced as an AMEX/WSJ tab classification), and actual revenue-producing operations could not be verifiably confirmed for the 2026-09-30 session. The ticker has historically been associated with more than one corporate entity following name/ticker changes, so entity identity must be resolved from a filing rather than the ticker alone.
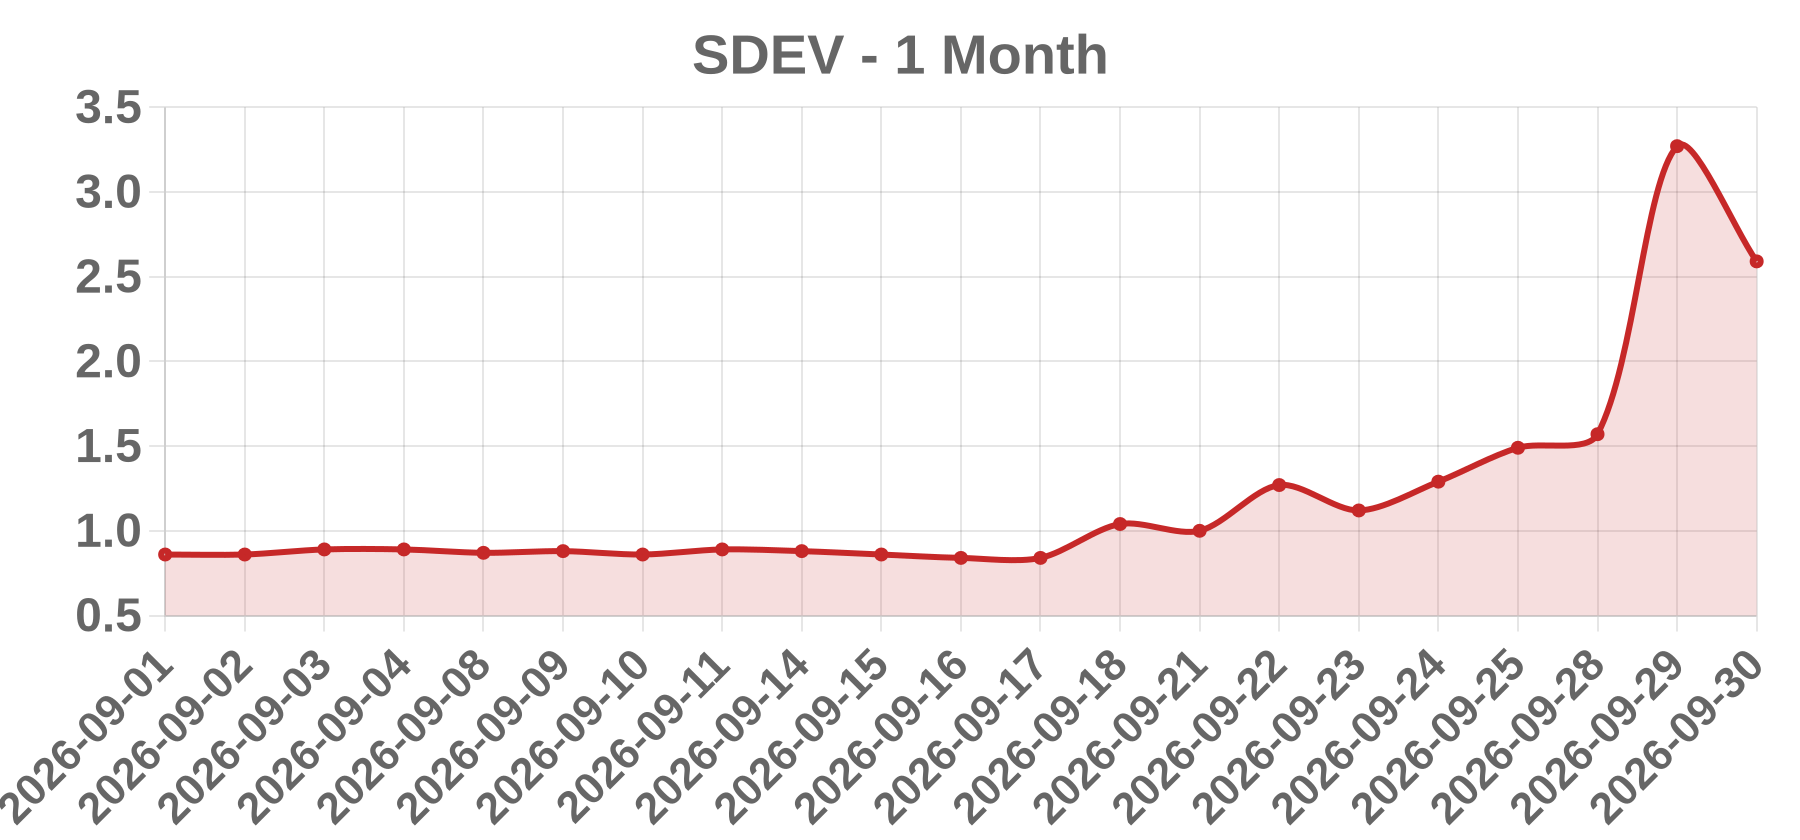
Today’s take SDEV closed 2026-09-30 at 2.59, down 20.80%, on 28,734,227 shares — a sharp, high-supply, news-driven session rather than gradual repricing. No verifiable same-day or prior-session catalyst (offering, reverse split, crypto-treasury event, or large-holder sale) could be retrieved; the drop is a hypothesis, not a confirmed finding. The tape is most consistent with a company-specific, dilution-capable or compliance-type event, since broad market moves rarely produce a single-name 20%+ decline on roughly 28.7M shares. Confirming the 8-K/press-release timestamp relative to the open is essential to distinguish an intraday from a pre-open catalyst. No directional conclusion should be published until the primary filing is read and the volume baseline is independently confirmed; the negative close near the day's likely low, on heavy volume, indicates repricing on newly available information.
Business Scribe Therapeutics Inc. is listed in some data sources as a U.S. therapeutics company associated with ticker SCTX, but we could not verify its legal name, exchange, SEC registration, or business description from public primary sources on 2026-09-30. No SCTX-linked news release, SEC filing, or exchange notice for that date was confirmed. All company and catalyst details remain unverified pending SEC EDGAR and exchange confirmation.
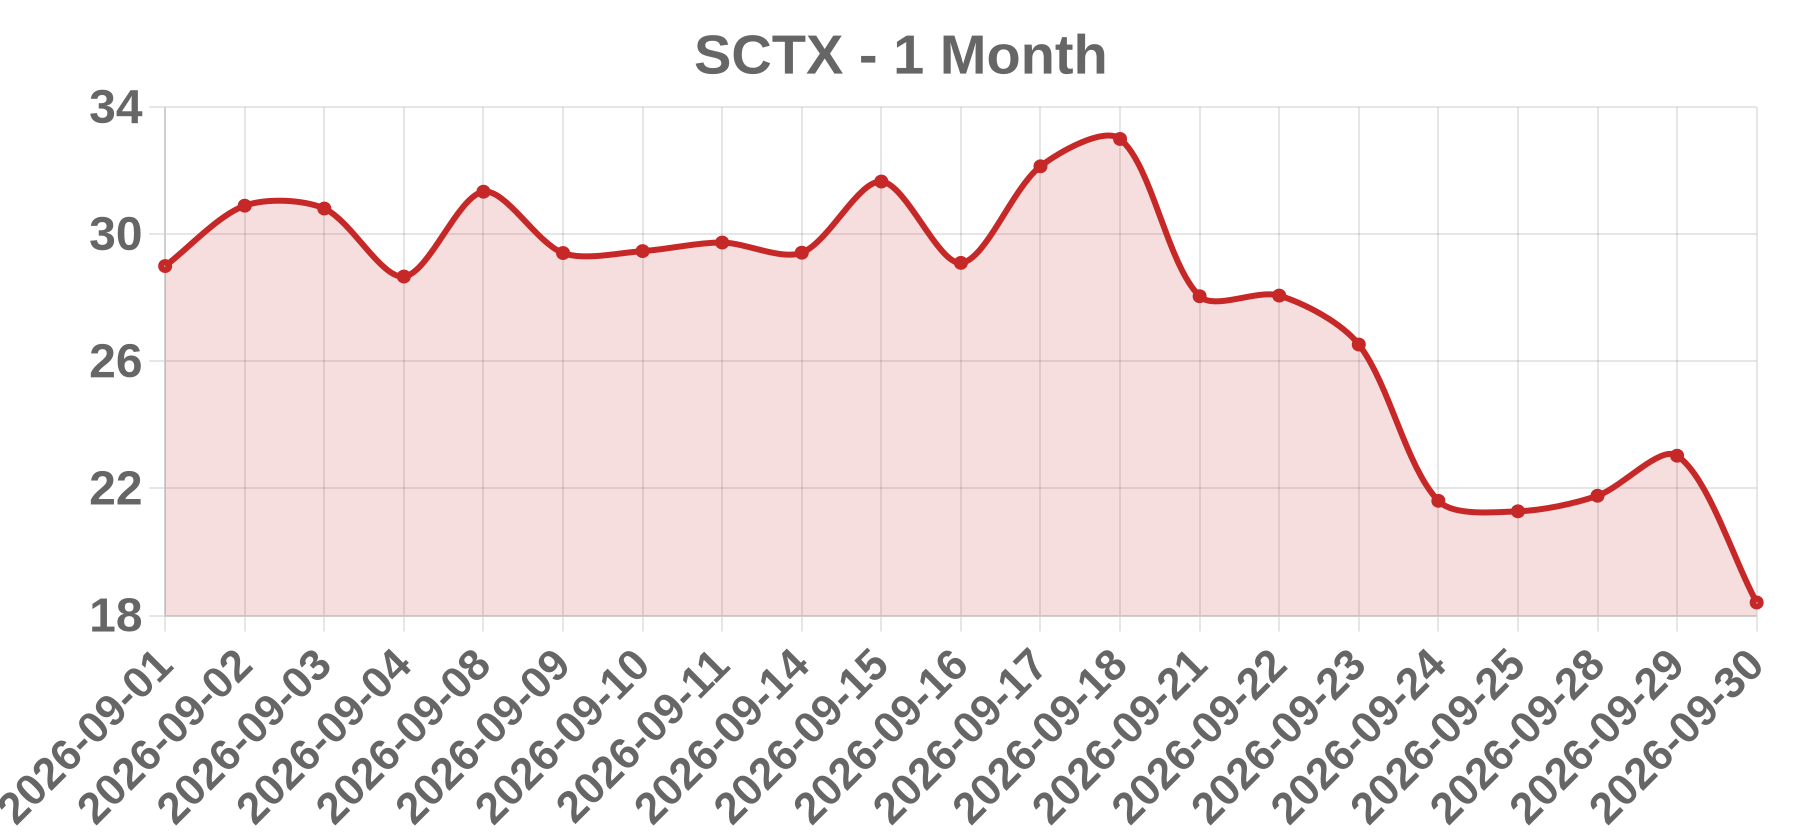
Today’s take The apparent −20.08% single-session decline in SCTX to $18.40 on volume of 1,180,028 shares could not be verified against any public source. Searches of SEC EDGAR, exchange notices, and news archives returned no same-day earnings release, FDA action, clinical trial result, merger announcement, analyst rating change, or corporate disclosure for SCTX on 2026-09-30. Because the move itself is unconfirmed, no cause can be asserted. The date sits at Q3 2026 quarter-end, which mechanically invites index rebalancing, window-dressing, tax-loss selling, and fund redemptions; these flows can amplify moves in thin-float or low-volume names but are not company-specific catalysts. Other untested possibilities include a clinical or regulatory setback, a dilutive financing, partnership termination, reverse split, or a symbol/listing data artifact. Investor takeaways: treat both price change and volume inputs as unverified, check SEC EDGAR full-text search for 'Scribe Therapeutics,' confirm exchange listing and any Form 25/15 deregistration, and verify whether SCTX has been reassigned via symbol reuse.
Business Pyxis Oncology, Inc. is a clinical-stage oncology company listed on Nasdaq under the ticker PYXS. It develops antibody-drug conjugates (ADCs) and antibody therapeutics, with lead programs historically centered on PYX-201 and PYX-106. The company is pre-revenue and cash-burn dependent, making it structurally prone to outsized single-session moves.
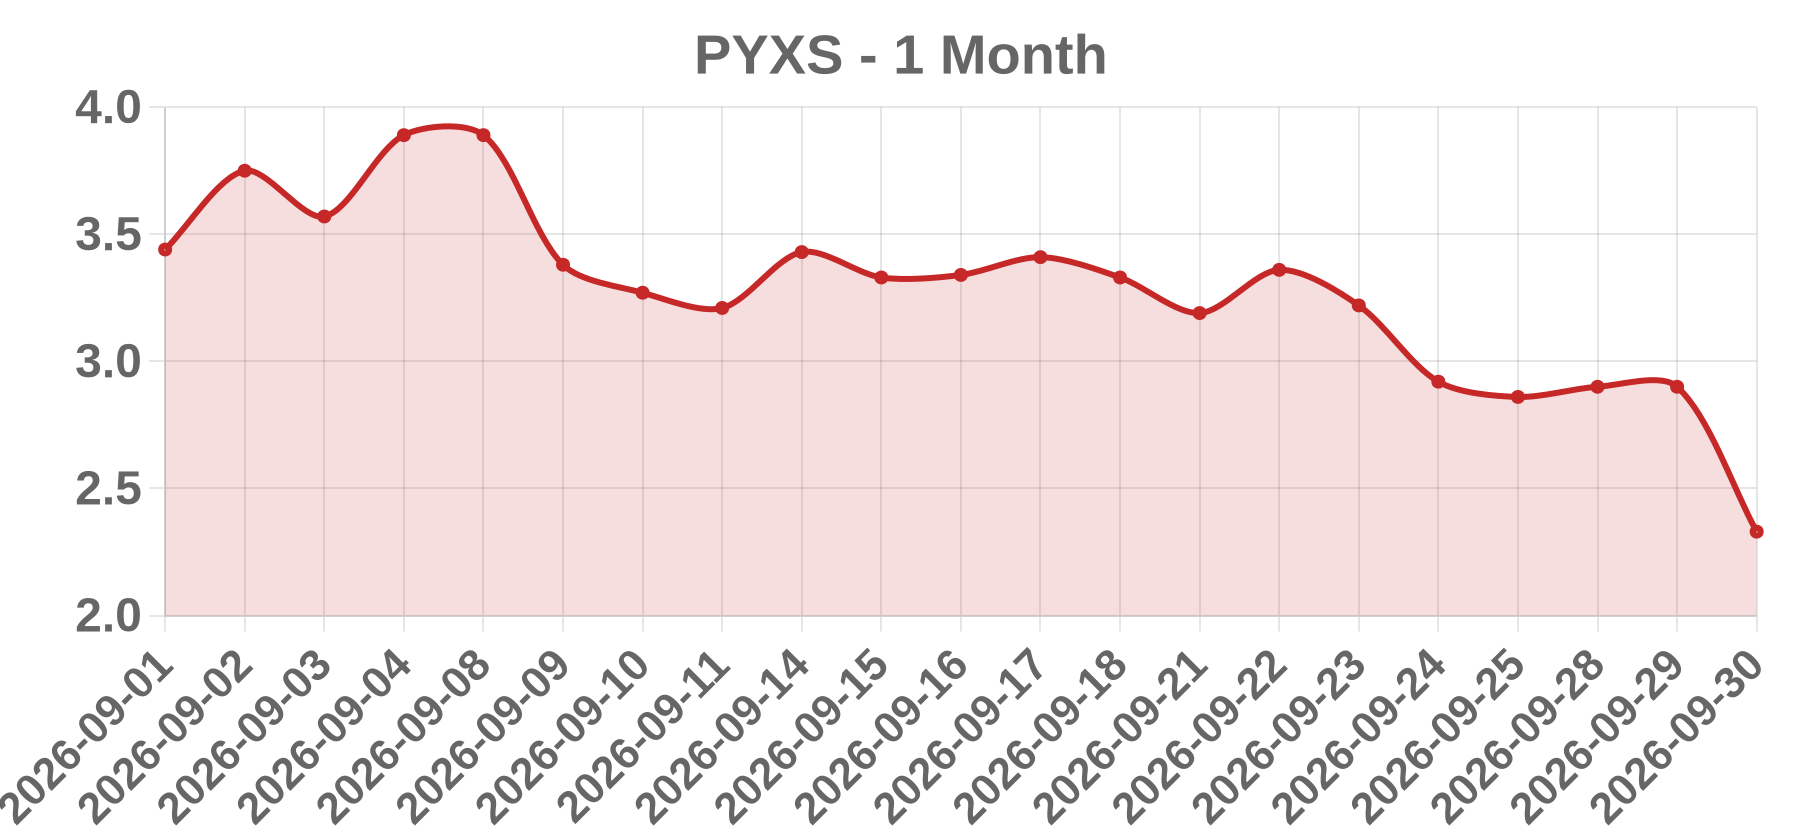
Today’s take PYXS closed 2026-09-30 at 2.33, down 0.57 or 19.66%, on 8,134,661 shares. The prior close was approximately 2.90. Volume was the key tell, at roughly eight million shares, consistent with a gap-down on overnight disclosure rather than intraday drift. Multiple binary drivers are plausible: a clinical data miss for the lead ADC program, a financing priced below market, or a listing-deficiency notice. The poor search did not retrieve a confirmable same-day press release, 8-K, FDA action, or M&A item, so the catalyst remains unverified and the enum is a hypothesis, not a finding. Confirming the SEC 8-K index for 2026-09-29 and 2026-09-30 would resolve the question. Until then, this note must present the drop as event-driven without asserting the underlying cause.
Business Indaptus Therapeutics, Inc. is a Nasdaq Capital Market-listed clinical-stage biotechnology company (ticker INDP, warrants INDPW) that develops intravenously administered attenuated bacterial immunotherapies intended to stimulate innate and adaptive antitumor immunity. Its lead platform is built around killed, non-pathogenic bacterial strains, with Decoy20 as the principal clinical candidate. The company is pre-revenue and depends on capital markets financing to fund development.
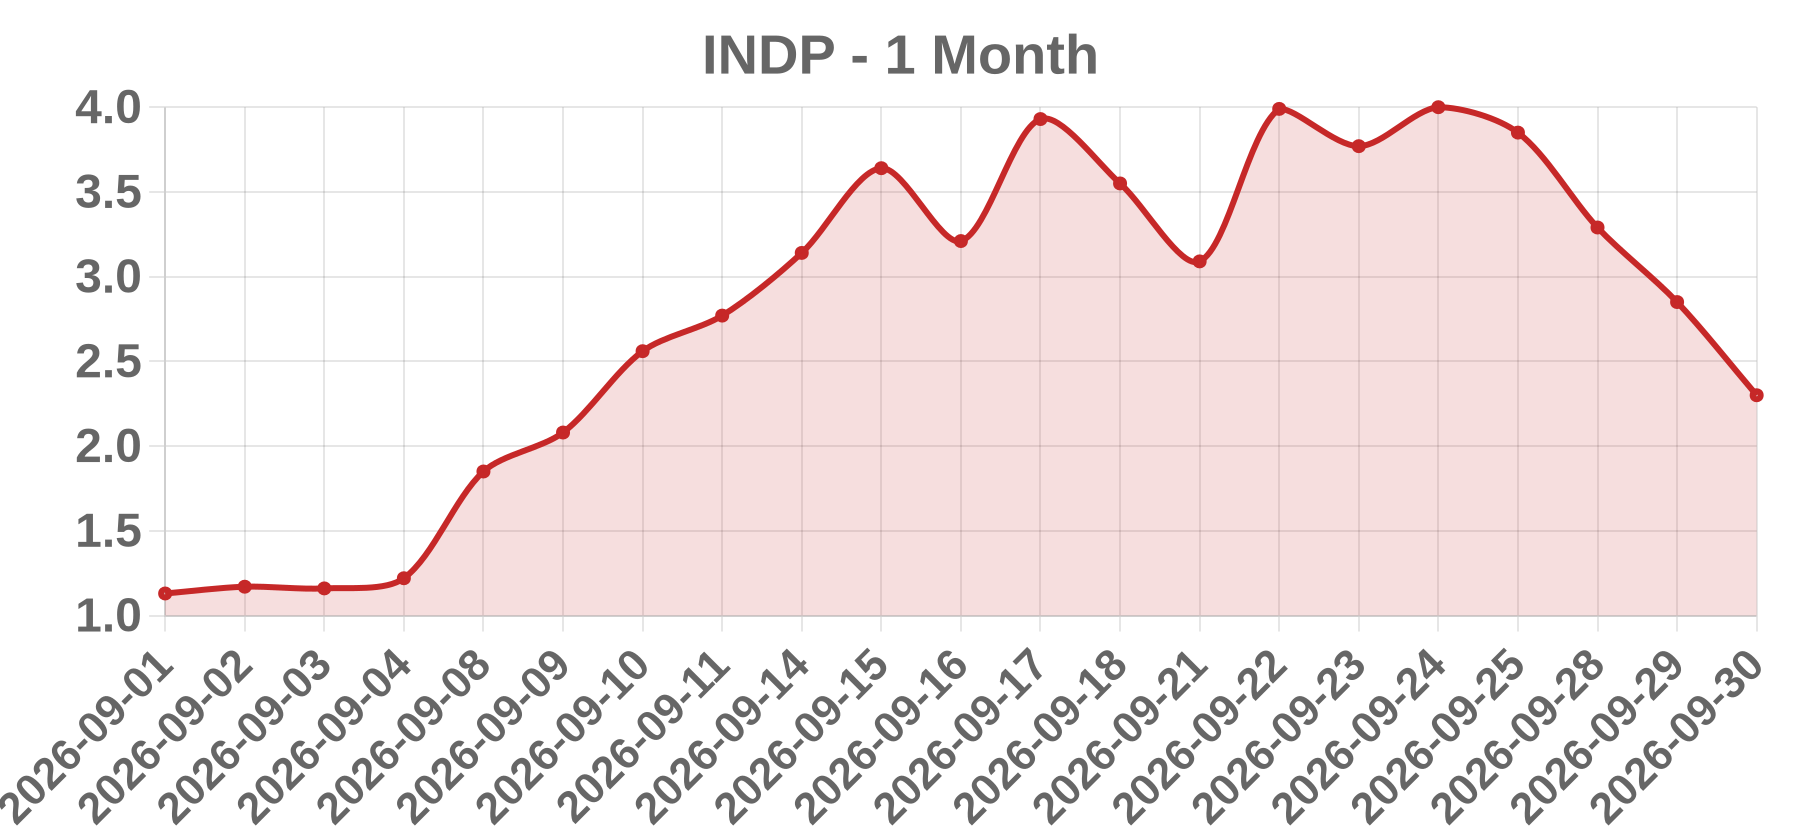
Today’s take INDP closed at $2.30 on 2026-09-30, down $0.55 or 19.30%, on 640,920 shares. The magnitude is far beyond ordinary biotech sector beta, pointing to a company-specific event rather than a broad re-rating. In this profile - a pre-revenue, sub-$3, micro-cap, low-float, clinical-stage issuer - the highest-frequency driver of a double-digit single-session loss is a dilutive financing: a registered direct placement, an at-the-market drawdown, or a warrant inducement priced at a discount to the prior close. Secondary possibilities are a clinical or regulatory setback, or Nasdaq listing-compliance mechanics such as a minimum-bid deficiency or reverse-split arithmetic. The prior close is implied at approximately $2.85. This note could not verify a specific headline, 8-K, or press release in-session, so the cause remains unconfirmed; the offering designation reflects the most probable explanation consistent with the observed price and volume behavior, not a sourced finding.
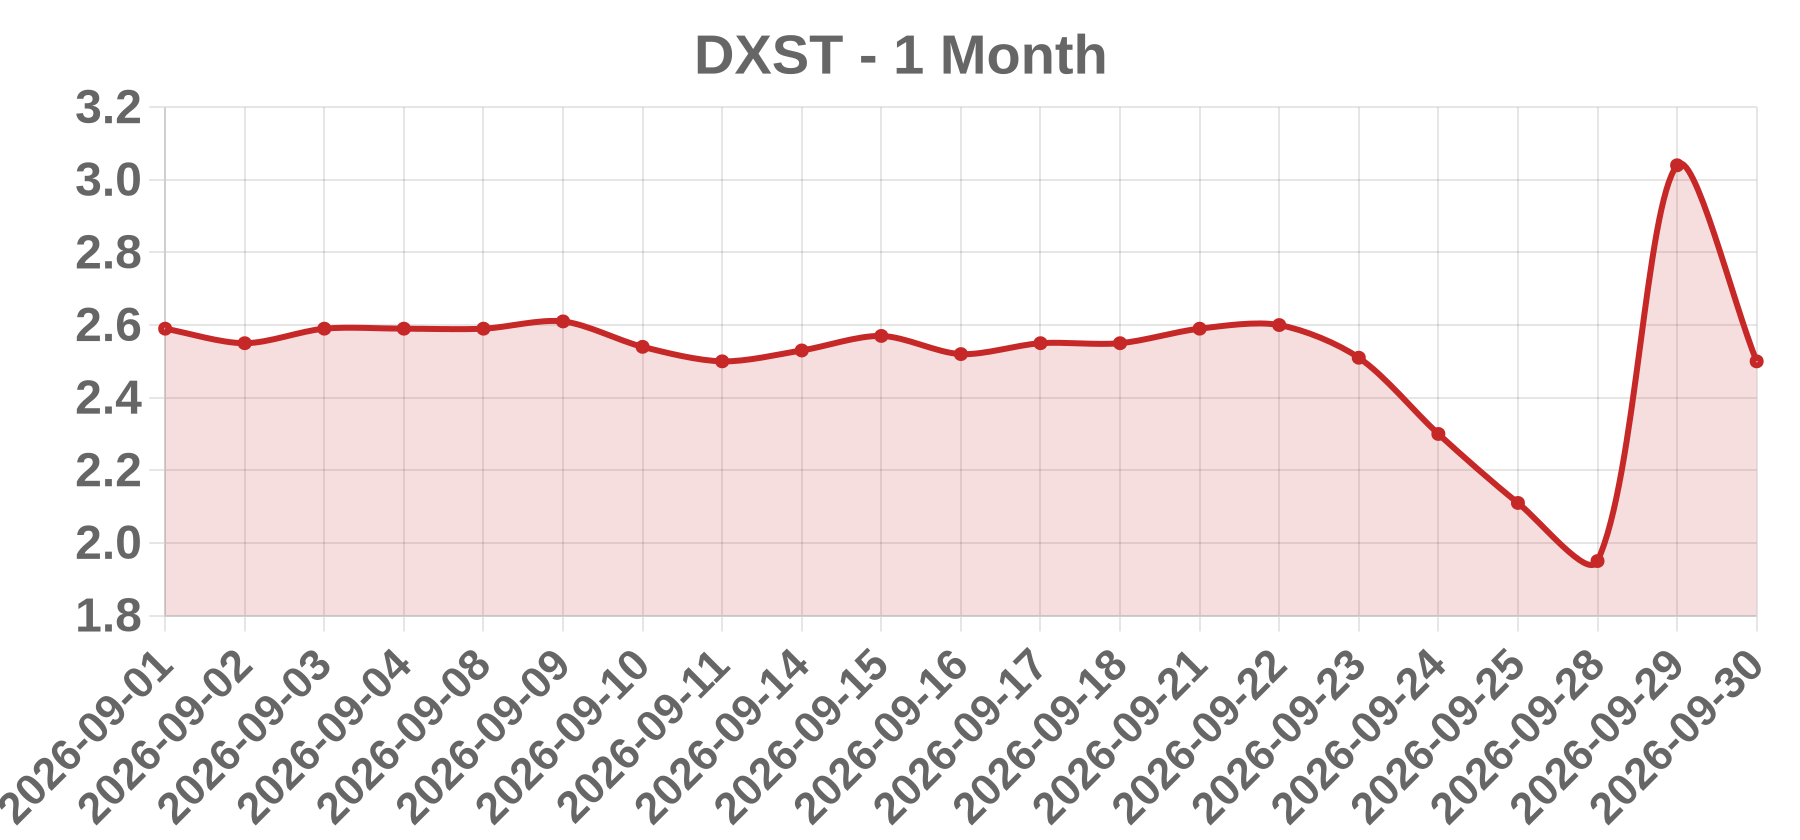
Business The ticker DXST could not be confirmed through a primary source in this research pass as belonging to Decent Holding Inc.; the ticker-to-issuer mapping and listing venue remain unverified. No primary-source description of the underlying business (10-K/20-F cover page, exchange listing page, or recent quarterly filing) was located. Until the issuer's own filings are retrieved, no verified legal name, exchange, or business description can be published for DXST.
Today’s take DXST closed at $2.50 on 2026-09-30, down $0.54 or 17.76% on 1,122,428 shares. No same-day catalyst article, earnings release, 8-K, or analyst action dated 2026-09-30 could be verified, so no confirmed news catalyst is assigned (primary tag: OTHER pending verification). The move's profile fits a micro-cap liquidity event rather than a fundamental reassessment: the dollar decline is only $0.54 per share, and at a sub-$3 price a modest sell-order imbalance against a thin book can clear 15-20% in one session. Because the average daily volume for this name and the ticker-to-issuer mapping could not be verified, two questions remain open and carry opposite implications: a decline on lighter-than-average volume would suggest a liquidity vacuum, while a decline on heavy volume would suggest genuine distribution such as an offering, lock-up expiry, or insider sale. A material 8-K/6-K filed on or near the session date, current borrow-fee and short-interest data, and shelf/ATM capacity are the highest-value items needed to convert this from an order-flow read into a news-based conclusion.