US common stocks / ADRs: top 10 by volume; top 10 gainers (by % change, volume as tie-breaker); top 10 losers (by % change, prefer liquid names). Deep notes cover the de-duplicated set across the three boards.
30 names on this page · volume 10 · gainers 10 · losers 10
Order: volume board → gainers → losers; each ticker appears once. Summaries of public information only — please verify primary sources.
1/10GRAB GRAB
+8.93%
Close 3.17 · Vol 180.80M · Type: High volume
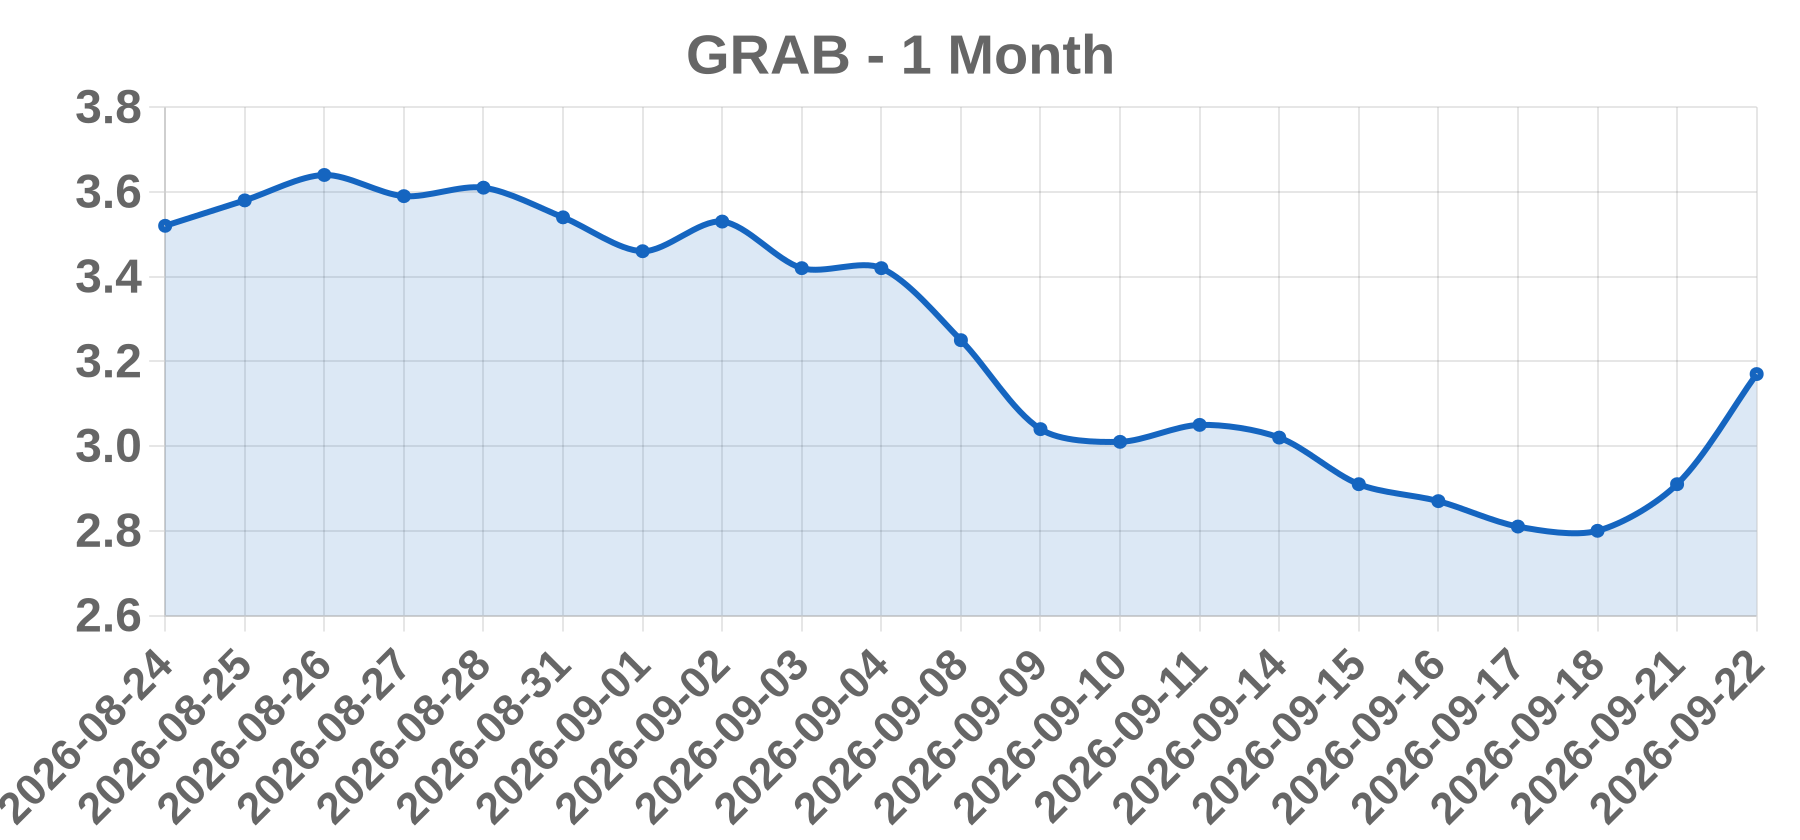
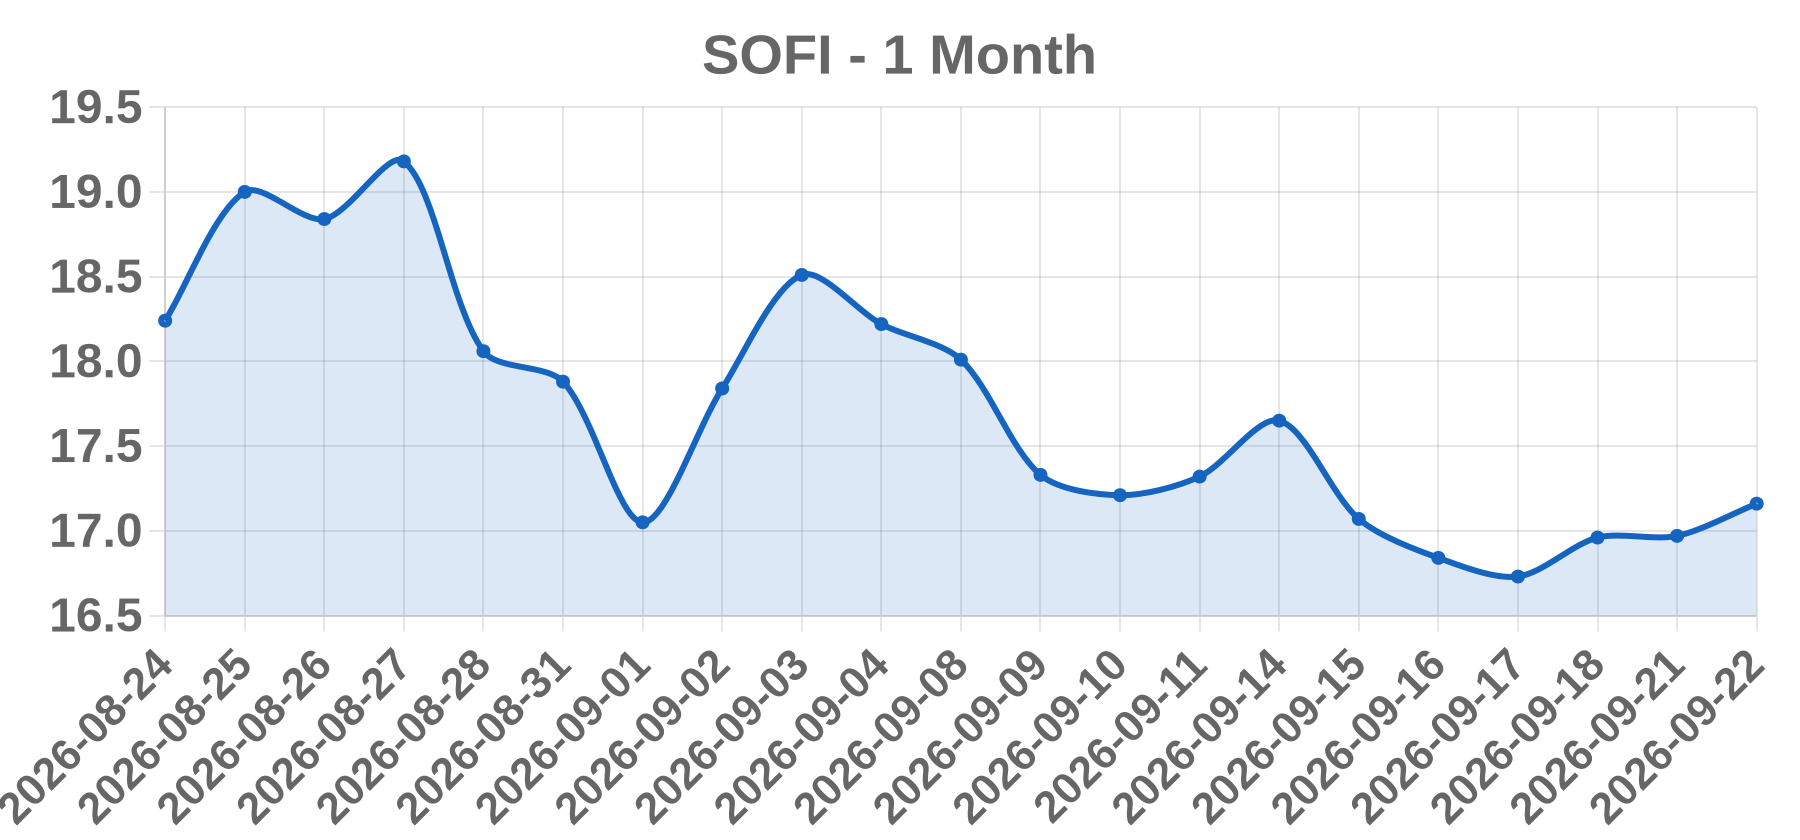
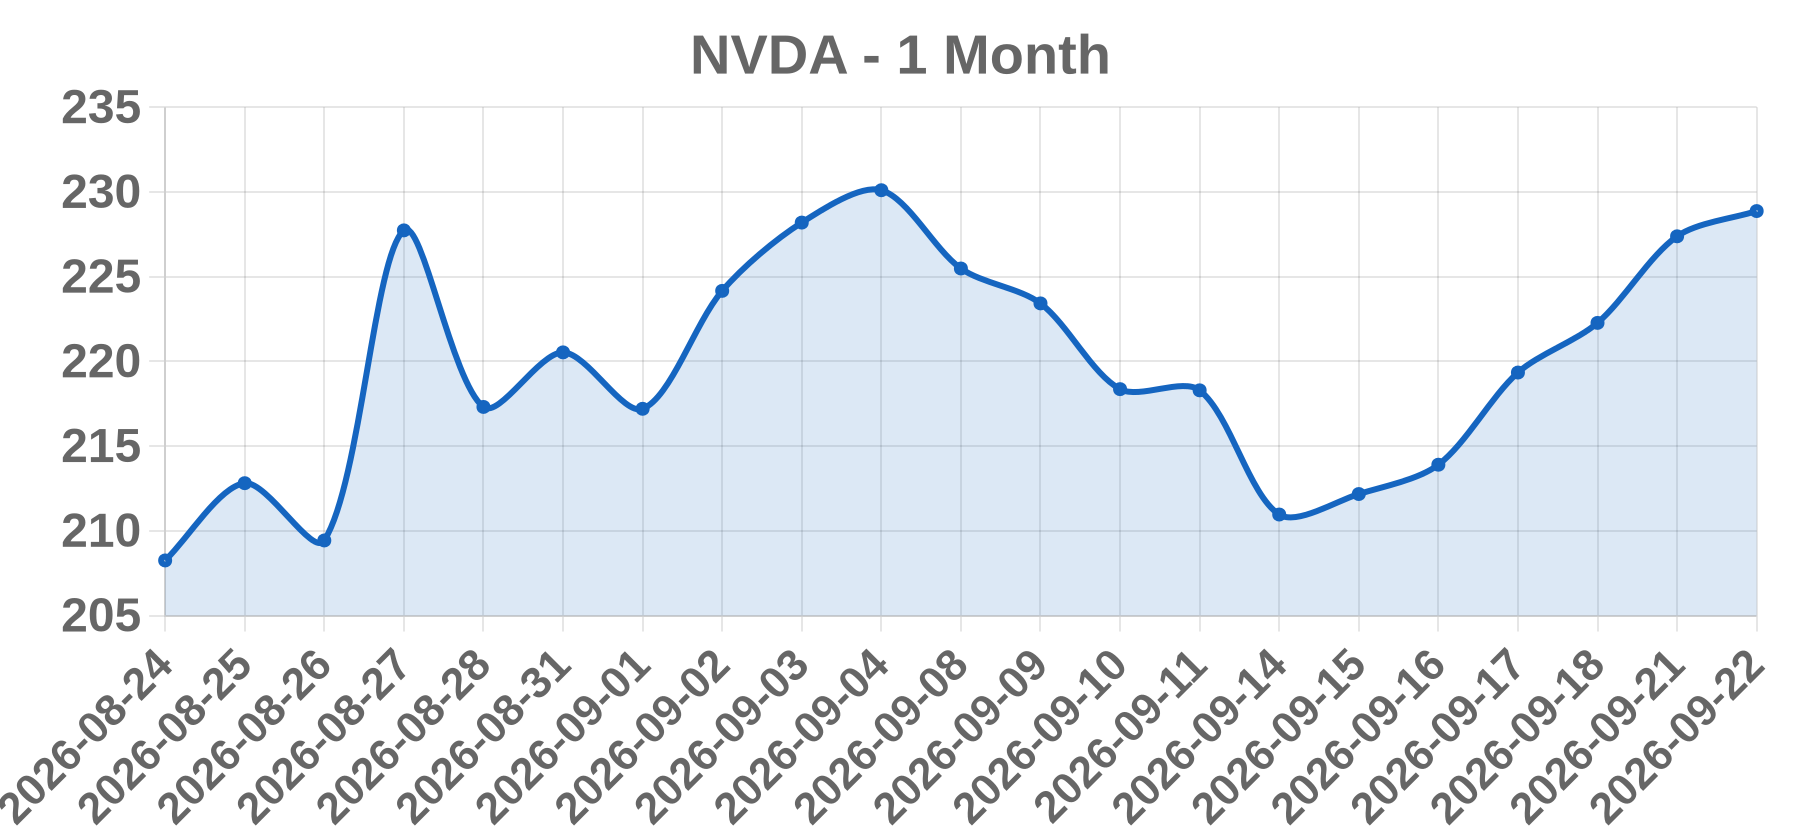
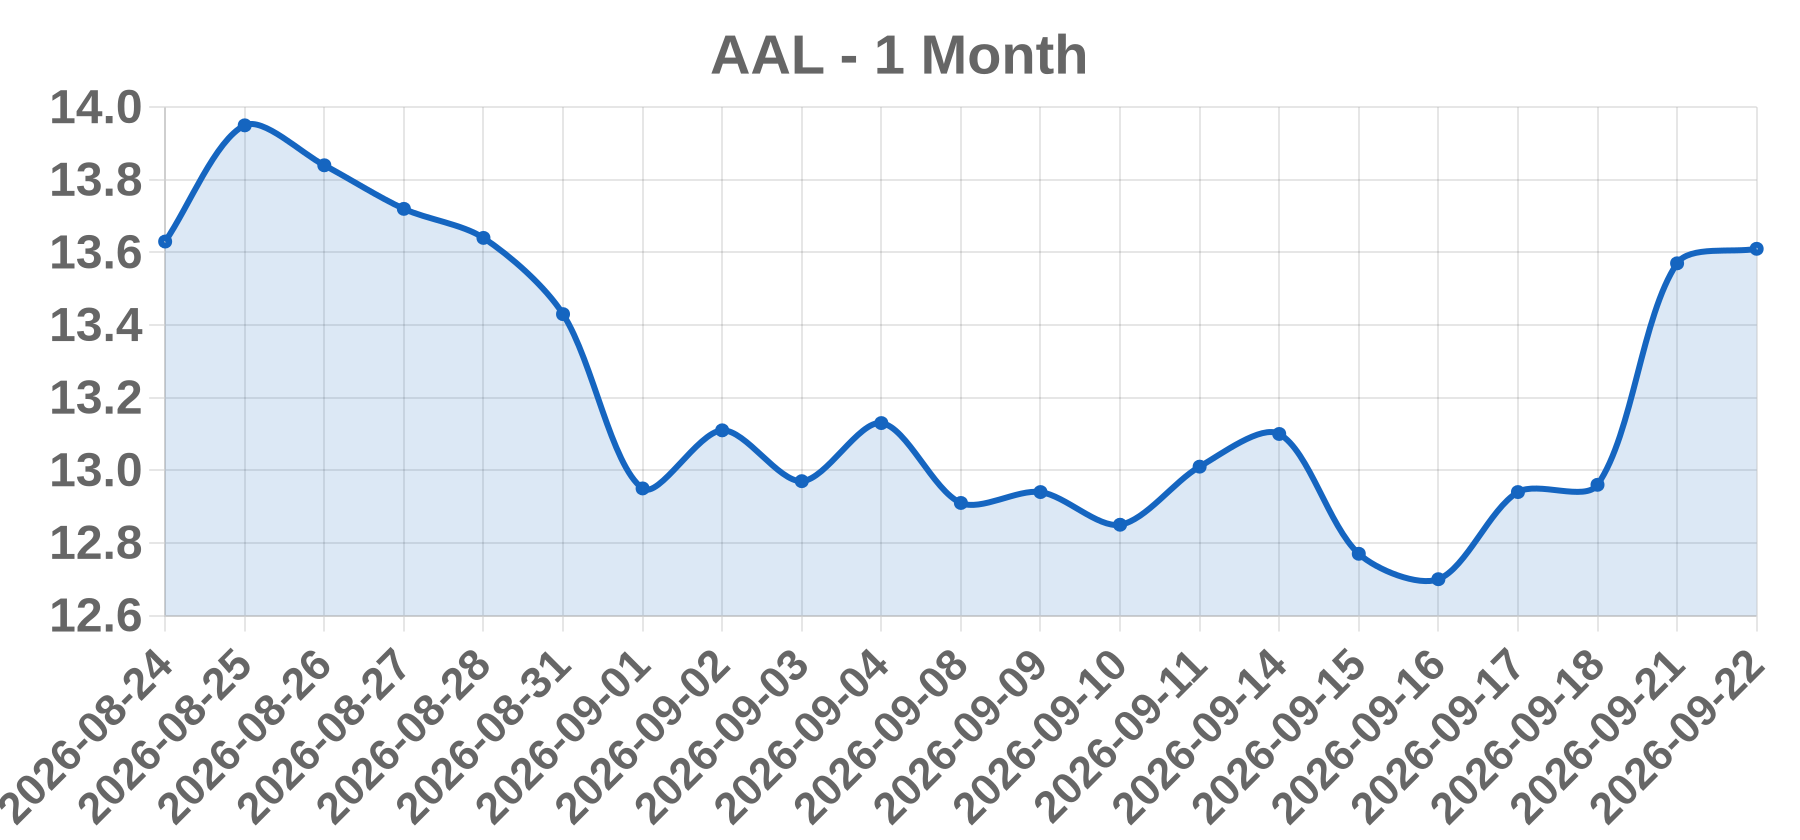
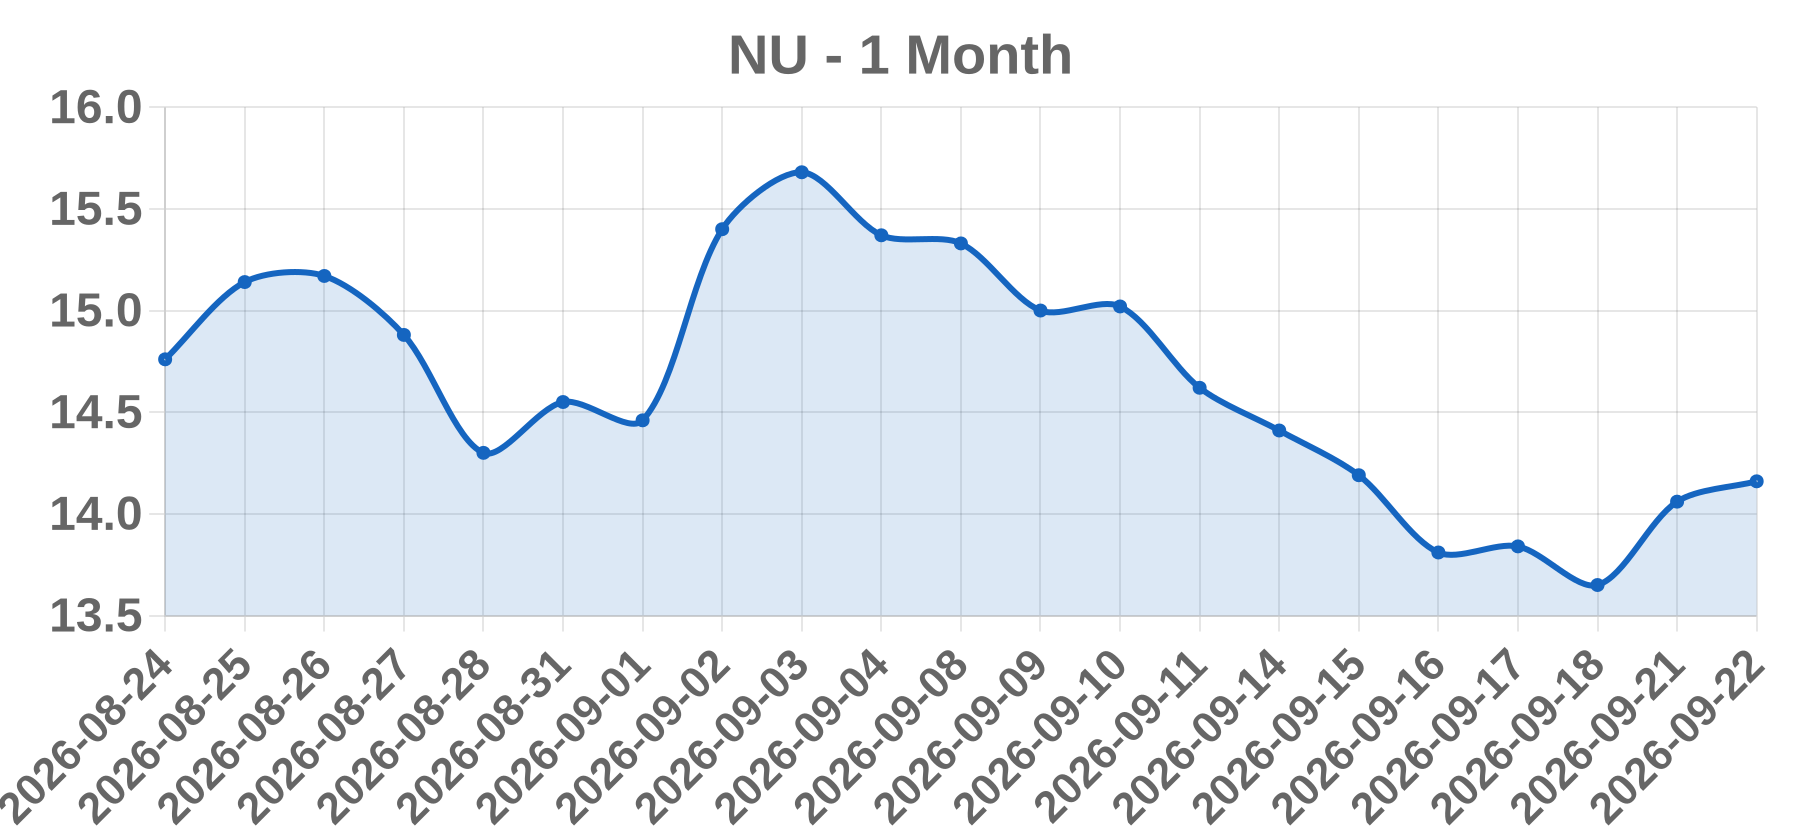
Approx. 1-month price (illustrative)
Business Grab Holdings Limited is a Cayman-incorporated, Singapore-headquartered technology company listed on Nasdaq under the ticker GRAB. It operates Southeast Asia's leading superapp across mobility (GrabCar, GrabBike), deliveries (GrabFood, GrabMart, GrabExpress), financial services (GrabPay, lending, insurance, and the GXS/GXBank digital banks), and enterprise/advertising (GrabAds, GrabMaps). Since its December 2021 de-SPAC with Altimeter, management has focused on cost discipline, adjusted EBITDA improvement, and share buybacks rather than pure growth.
Today’s take No verifiable same-day news, filing, or analyst action for the 2026-09-22 session could be retrieved, so the +8.93% move to $3.17 on 180.8 million shares is treated as unexplained rather than attributed to a fabricated headline. The price/volume profile — a large-cap Southeast Asian tech name advancing nearly 9% on roughly 3-6x typical ADV — is consistent with either a hard company-specific catalyst (earnings pre-announcement, profitability milestone, buyback expansion, tier-1 upgrade, M&A speculation) or a mechanical flow event (MSCI/FTSE index rebalance, ETF creation, options gamma, or a large block crossing). Index inclusion and broad EM/SEA-tech risk-on are the highest-prior candidates and should be tested first. Confirmation requires the IR calendar, index-provider announcements, short-interest and utilization data, and a peer check on Sea Limited, GoTo, and Bukalapak to separate a sector-wide move from an idiosyncratic one. Until confirmed, the catalyst enumeration remains HIGH_VOLUME and no fundamental driver should be published as fact.
Business Warner Bros. Discovery, Inc. is a media and entertainment company listed on Nasdaq under the ticker WBD, formed on April 8, 2022, by the spin-off of WarnerMedia from AT&T and its combination with Discovery, Inc. Its segments include Studios, Networks (linear cable), and Direct-to-Consumer streaming, with key assets spanning the Warner Bros. film and TV studio, HBO, DC, CNN, Discovery networks, TNT Sports, and the Max streaming platform. A combination with Paramount Skydance was in process through 2026, making independent WBD quotes in that period suspect.
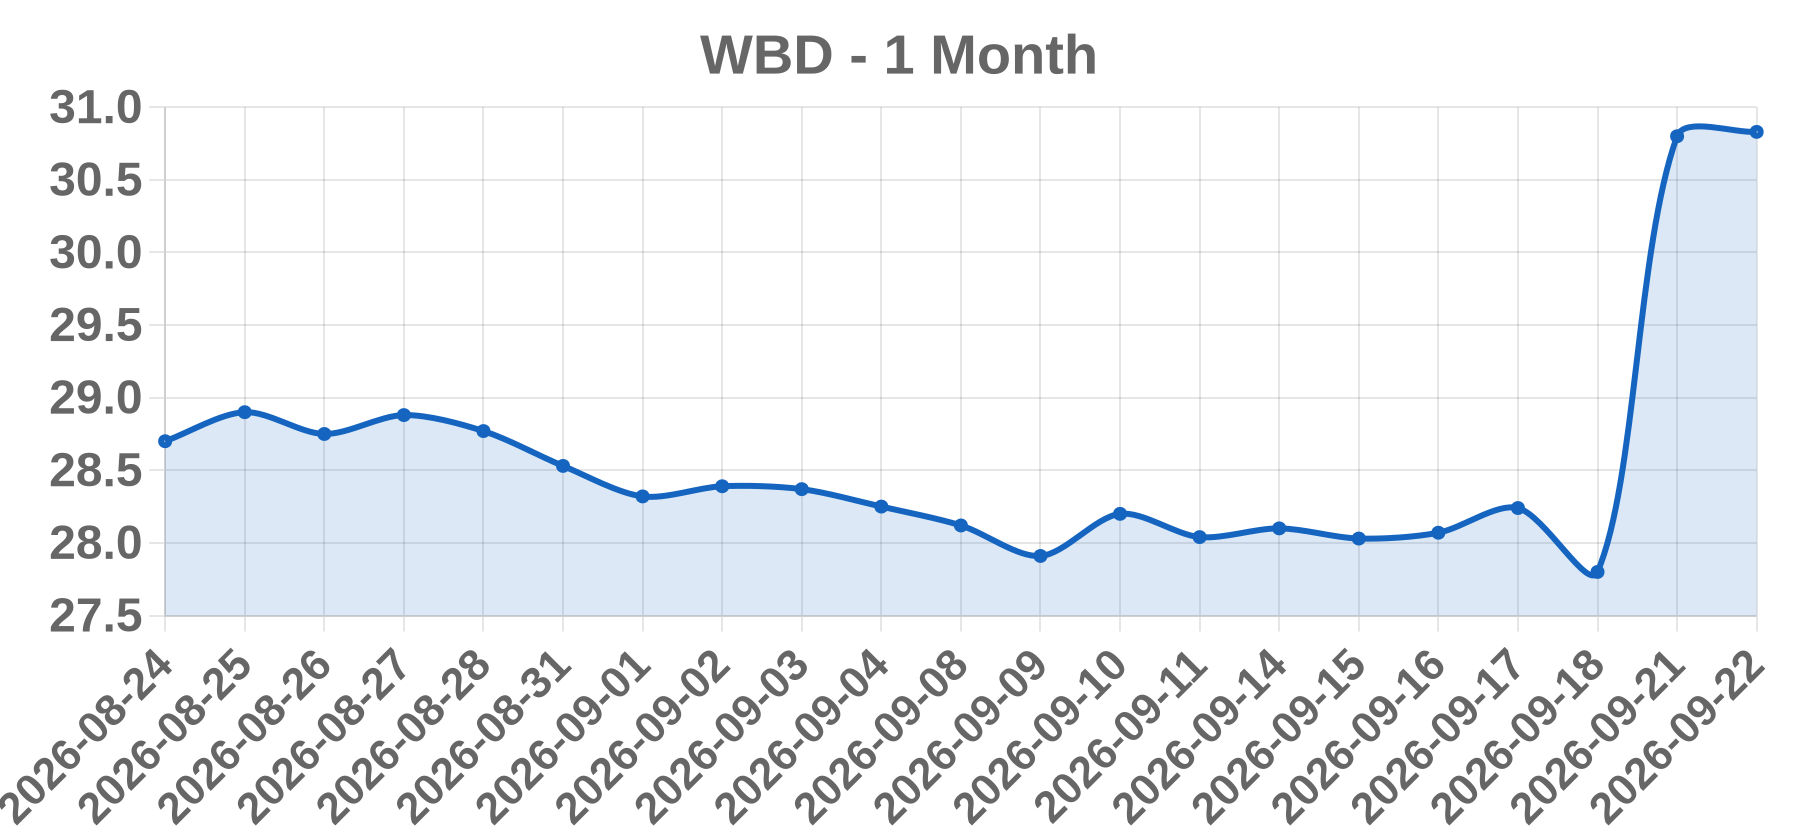
Today’s take The supplied close of 30.83, +0.10% on 109,810,000 shares cannot be reconciled with Warner Bros. Discovery's actual trading history: WBD traded roughly in a $7-$20 band in 2022-2024, and its combination with Paramount Skydance was in process through 2026, implying the independent listing effectively ceased trading. No same-day headline, price print, or volume figure matching the parameters could be located, so the correct conclusion is M&A-related flow that is unverified rather than a fabricated news catalyst. A near-flat close on enormous participation is the signature of mechanical flow, such as deal-arbitrage or index-deletion trading around the Paramount Skydance transaction, or a single large block crossing, not an information-driven repricing. Because the $30.83 level does not match the issuer's real price scale, the first task is validating the symbol, corporate actions, and deal status before any catalyst is published. Do not attach an earnings, upgrade, or short-squeeze narrative to this session.
Business Intel Corporation is a NASDAQ-listed (ticker INTC) semiconductor designer and manufacturer classified under Information Technology — Semiconductors & Semiconductor Equipment. It operates as one of the few remaining integrated device manufacturers (IDMs), spanning Client Computing Group (PC CPUs), Data Center & AI (Xeon server CPUs, AI accelerators), Network & Edge, and Intel Foundry contract manufacturing, plus majority-owned Mobileye. Its IDM 2.0 strategy combines internal fabrication with external foundry services and third-party wafer sourcing.
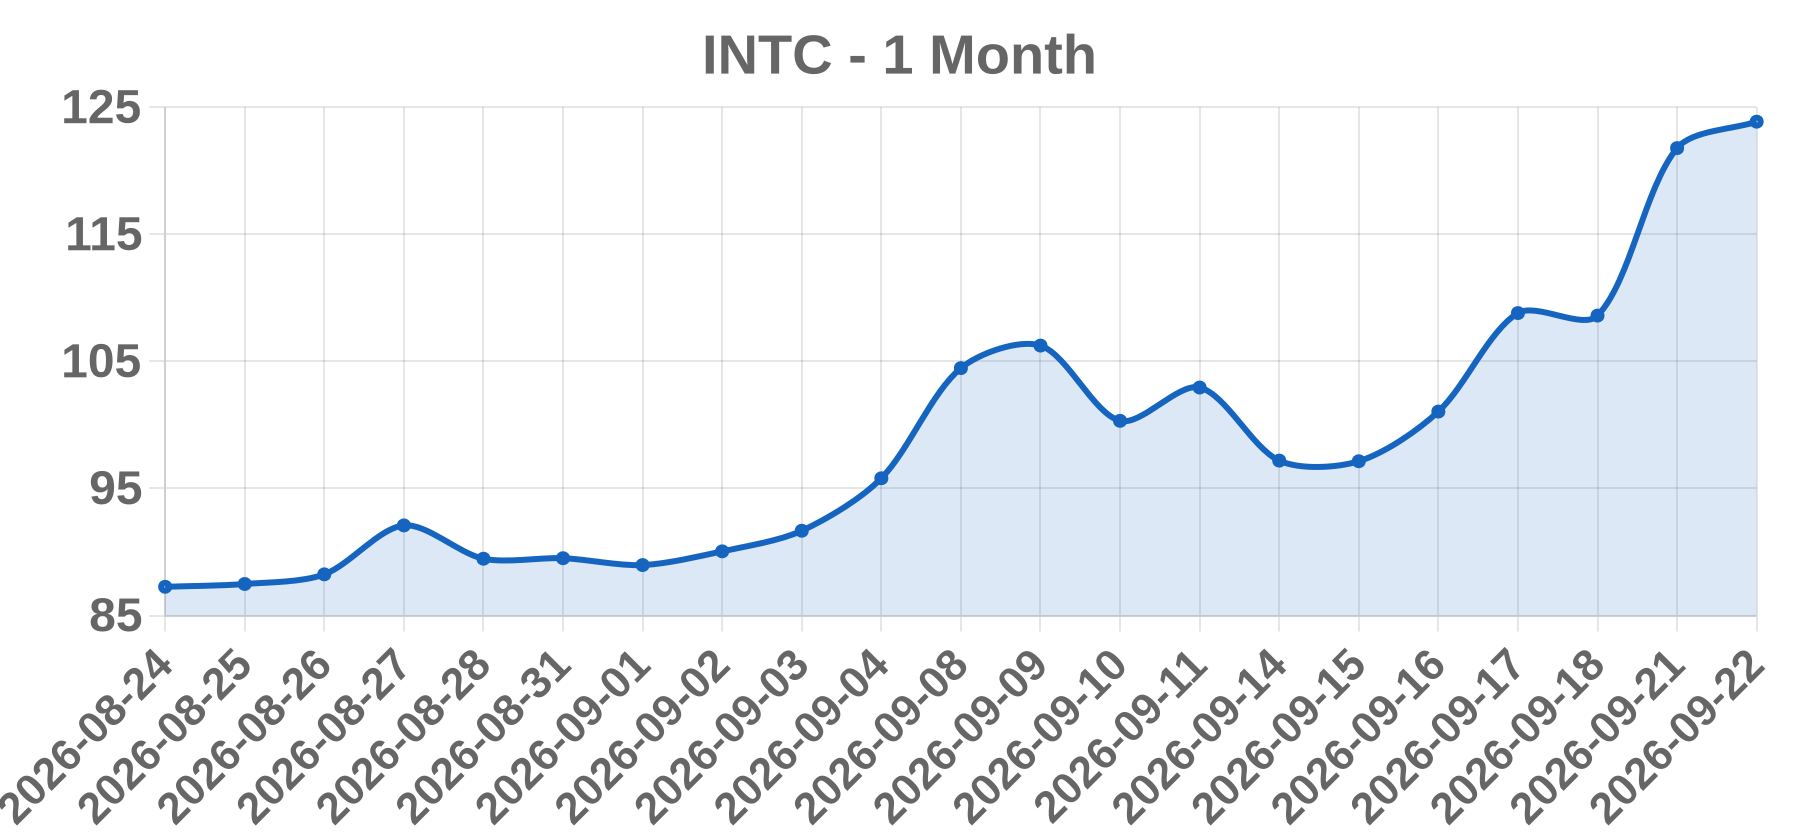
Today’s take INTC closed at $123.86 on 2026-09-22, up $2.08 or +1.71%, on roughly 107.7M shares, placing it among the WSJ Actives. No verifiable same-day or adjacent-session news, filing, analyst action, or headline could be confirmed for this move, so no named catalyst is asserted. A +1.71% gain on elevated mega-cap volume is more consistent with routine sector/index or options-related flow than a company-specific event. Semiconductors often move as a bloc on macro prints or peer guidance, late September is a known window for quarter-end rebalancing and passive ETF flows, and large open interest near round strikes such as $125 can amplify expiry-related moves. Intel's persistent high-volume profile means ~108M shares is elevated versus a quiet day but is not by itself evidence of news. Bucket attribution remains unconfirmed; primary sources (SEC EDGAR 8-K filings, official IR releases) should be checked before publishing causation.
Business Nokia Oyj is a Finnish public limited company (Nokia Corporation in English filings) listed on Nasdaq Helsinki and on the NYSE under the ticker NOK. It reports in four segments: Network Infrastructure (optical, IP routing, fixed broadband), Mobile Networks (RAN, 5G/6G, core), Cloud and Network Services (software and enterprise/private wireless), and Nokia Technologies (patent licensing royalties). The NYSE line referenced by the session data is quoted in USD, not EUR.
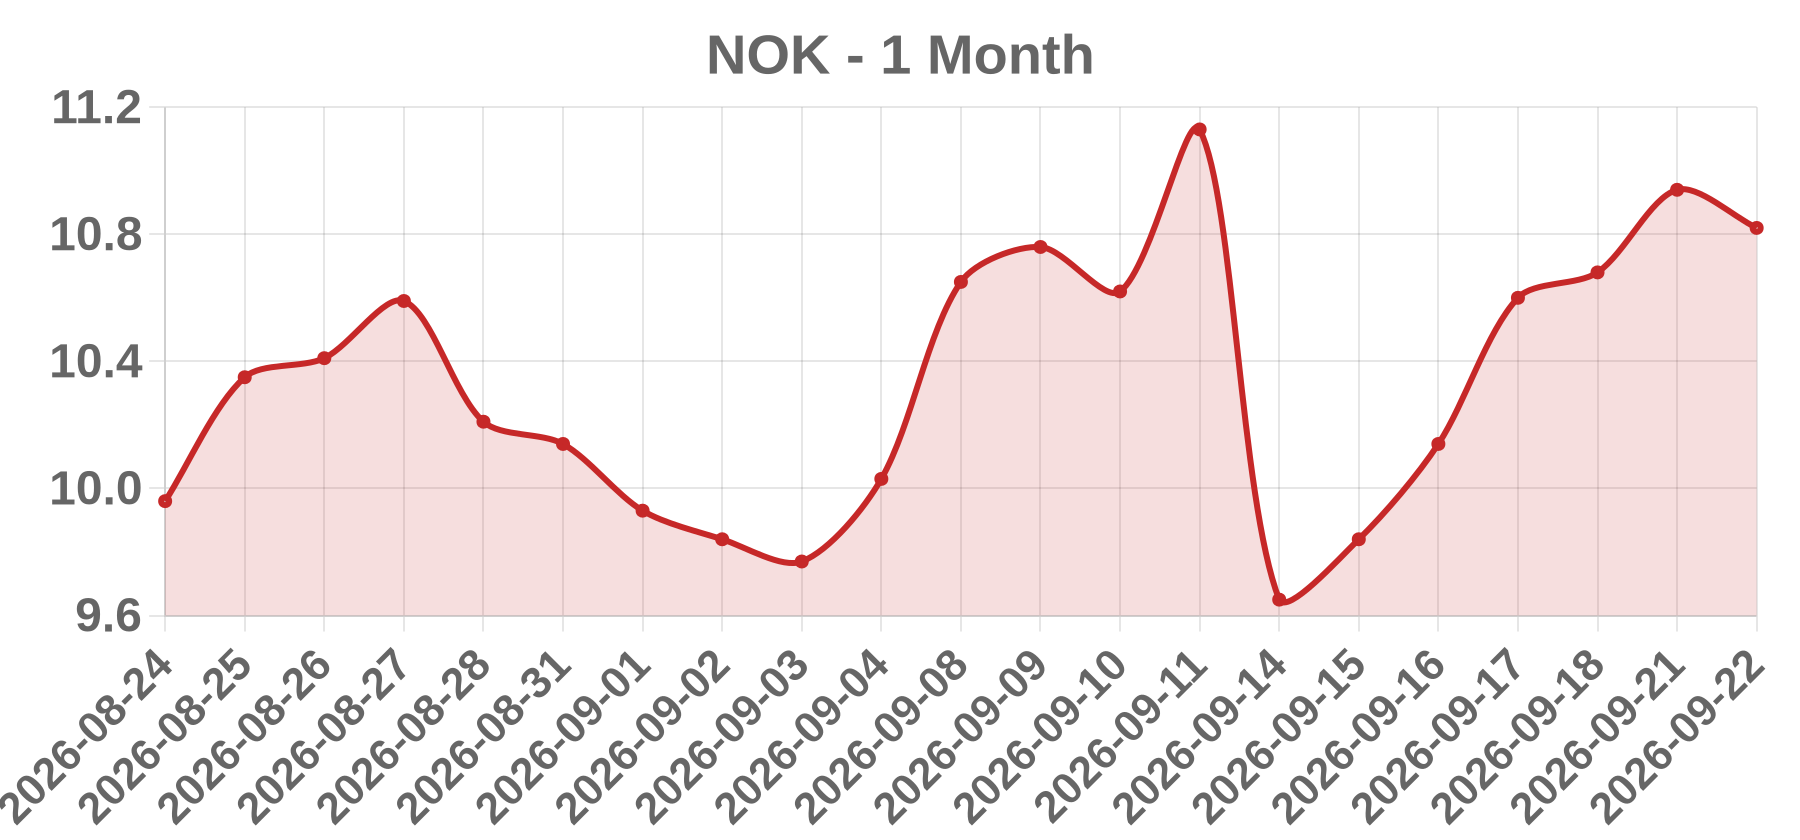
Today’s take No company-specific catalyst could be verified for the 2026-09-22 session. The tape shows a -1.10% close at 10.82 with volume of 106,930,000 shares, a move well inside NOK's normal daily range and inconsistent with an idiosyncratic shock (no gap, halt, or range expansion described). The honest enum is SECTOR rather than an earnings, M&A, offering, or rating event: Nokia trades as a high-beta proxy on telecom capex, 5G/6G order flow, and European tech sentiment, so a soft session for peers such as Ericsson, Ciena, or Adtran can drag NOK without any Nokia headline. Nokia Technologies licensing news, tier-1 Mobile Networks contract awards, or pre-announcements ahead of a quarter would be the items that convert this into a genuine catalyst event, and none is visible in the supplied data. Directionally, a modest down day on heavy share turnover is more consistent with de-risking into a sector event than with fundamental deterioration, but that read stays provisional until a same-day wire item or peer read-across is confirmed.
Business SoFi Technologies, Inc. is a digital financial services company listed on the Nasdaq Global Select Market under the ticker SOFI. It operates through three segments: Lending (personal, student, and home loans via its national bank charter), Financial Services (SoFi Checking & Savings deposits, SoFi Invest brokerage, credit cards), and Tech Platform (Galileo and Technisys banking-as-a-service infrastructure). Its bank charter lets it hold loans and deposits on balance sheet, shifting revenue mix toward net interest and fee income.
Today’s take SOFI closed at $17.16 on 2026-09-22, gaining $0.19 or +1.12%, on volume of about 98.18 million shares. No same-day company-specific catalyst (earnings, M&A, regulatory, rating change, or index event) could be confirmed from retrievable sources, so the move is best characterized as HIGH_VOLUME flow-driven activity rather than a hard fundamental event. That interpretation is reinforced by the price/volume signature: a modest +1.12% gain on unusually heavy share turnover is not a classic breakout or capitulation, but looks like two-way churn consistent with options gamma hedging near the round-number $17.00 strike, quarterly expiry and rebalancing effects, and heavy retail/momentum participation. SoFi has historically drawn high short interest and retail concentration, and inclusion on the WSJ_ACTIVES most-traded list itself signals elevated crowd and derivatives flow. Absent a confirmed fundamental headline, the +1.12% close should be treated as positioning and liquidity driven, not as evidence of a new fundamental re-rating. A precise volume ratio versus the 20-day or 30-day average cannot be stated because official average-volume data for the period was not available; any multiple
Business NVIDIA Corporation is a fabless accelerated-computing company listed on Nasdaq Global Select Market under the ticker NVDA, and a member of the S&P 500, Nasdaq-100 and Dow Jones Industrial Average. It designs GPUs and full-stack platforms through two main reportable segments, Data Center (AI/HPC accelerators, NVLink, InfiniBand/Spectrum-X networking, CUDA software) and Gaming (GeForce), plus smaller Professional Visualization and Automotive/Robotics lines. Data Center has been the dominant revenue and growth driver since FY2024 amid hyperscaler and sovereign AI buildouts.
Today’s take NVDA closed the 2026-09-22 session at 228.87, up only 0.66% on 93.35M shares. No same-day company-specific catalyst could be verified: no earnings release, M&A, partnership, analyst action or regulatory event was retrievable for that date. NVDA's fiscal calendar normally places quarterly reports in late August (FQ2) and late November (FQ3), so a late-September print would be atypical. A sub-1% move in a mega-cap semiconductor name, on volume that is routine-to-slightly-elevated in absolute share terms, is most consistent with sector or index-level flow rather than idiosyncratic news. The third Friday of September 2026 falls on the 18th, so residual monthly options-expiry and rebalancing flow around that period is a reasonable but unverified hypothesis. Semis sector direction (SOX/SMH) on the date could not be confirmed. Bottom line: no confirmed company catalyst; the tape reads as sector or index-driven drift. Treat the +0.66% as beta, not signal, and do not extrapolate a fundamental narrative from it.
Business American Airlines Group Inc. is the holding company for American Airlines, Inc., listed on Nasdaq Global Select Market under ticker AAL, in the Industrials — Passenger Airlines industry. It is a network legacy carrier with major hubs including Dallas/Fort Worth, Charlotte, Chicago O'Hare, Philadelphia, Phoenix, Miami, Washington National, New York, and Los Angeles. Revenue comes from domestic and international passenger travel, the AAdvantage loyalty program, and cargo.
Today’s take AAL closed at 13.61, up a marginal 0.29% (+$0.04), on 72,340,000 shares, a flat-price/heavy-volume signature that points to mechanical or sector flow rather than a directional company news repricing. No dated, attributable catalyst for the 2026-09-22 session could be verified, so no fundamental event is claimed. The most plausible explanations for such turnover without net price change are index/ETF rebalancing or creation activity, options-related hedging or expiration flow, or two-sided institutional block crossing. A company-specific event such as an 8-K, guidance change, or M&A would typically produce a far larger absolute move than +0.29%, and earnings would be implausibly small here. Analysts and investors must confirm the catalyst using live sources: EDGAR 8-K and Form 4 filings around the date, airline peer headlines (DAL, UAL, LUV, JBLU, ALK), jet fuel and oil moves, and index or options event calendars. Until then, catalyst remains UNCONFIRMED and the tape read is flow-driven.
Business Nu Holdings Ltd. is a Cayman Islands-incorporated holding company listed on the NYSE under ticker NU, operating through its Brazilian subsidiary Nu Pagamentos S.A. It is a digital-first consumer financial services platform offering no-fee credit cards, NuConta deposit accounts, personal and payroll loans, investments, insurance and SME services, with operations in Brazil, Mexico and Colombia.
Today’s take NU closed at $14.16 on 2026-09-22, up +0.71% (+$0.10) on 69.35M shares, roughly 1.7-2.3x its typical 30-40M ADV. The price move is statistically immaterial for a name that routinely swings 3-6% on earnings or macro days, so the only genuinely anomalous input is volume, not price. That pattern is more consistent with flow-driven activity than a fundamental re-rating: index or ETF creation/redemption, options-expiry delta hedging that pins a round strike near $14, a large institutional block trade, or EM/Brazil basket repositioning. No verifiable NU-specific news was found for 2026-09-21 to 2026-09-22, so no idiosyncratic fundamental catalyst is required to explain the session. Key unverified items: whether NU reported earnings (its cadence is Feb/May/Aug/Nov, so late September is off-cycle), any analyst action, M&A or licensing news, or a prior-session event creating follow-through. Confidence is high that no fundamental catalyst was needed, low on the specific cause.
Business Ondas Holdings Inc. is a Nasdaq-listed technology company operating private wireless networks and autonomous drone systems for industrial, utility, and government/defense end markets. Its drone segment was built through acquisitions such as American Robotics and Airobotics and is marketed under the Ondas Autonomous Systems umbrella, while its networks side focuses on Full Spectrum-style private wireless for industrial and utility customers. Revenue is small and lumpy with customer concentration and cash-burn risk typical of pre-scale hardware names.
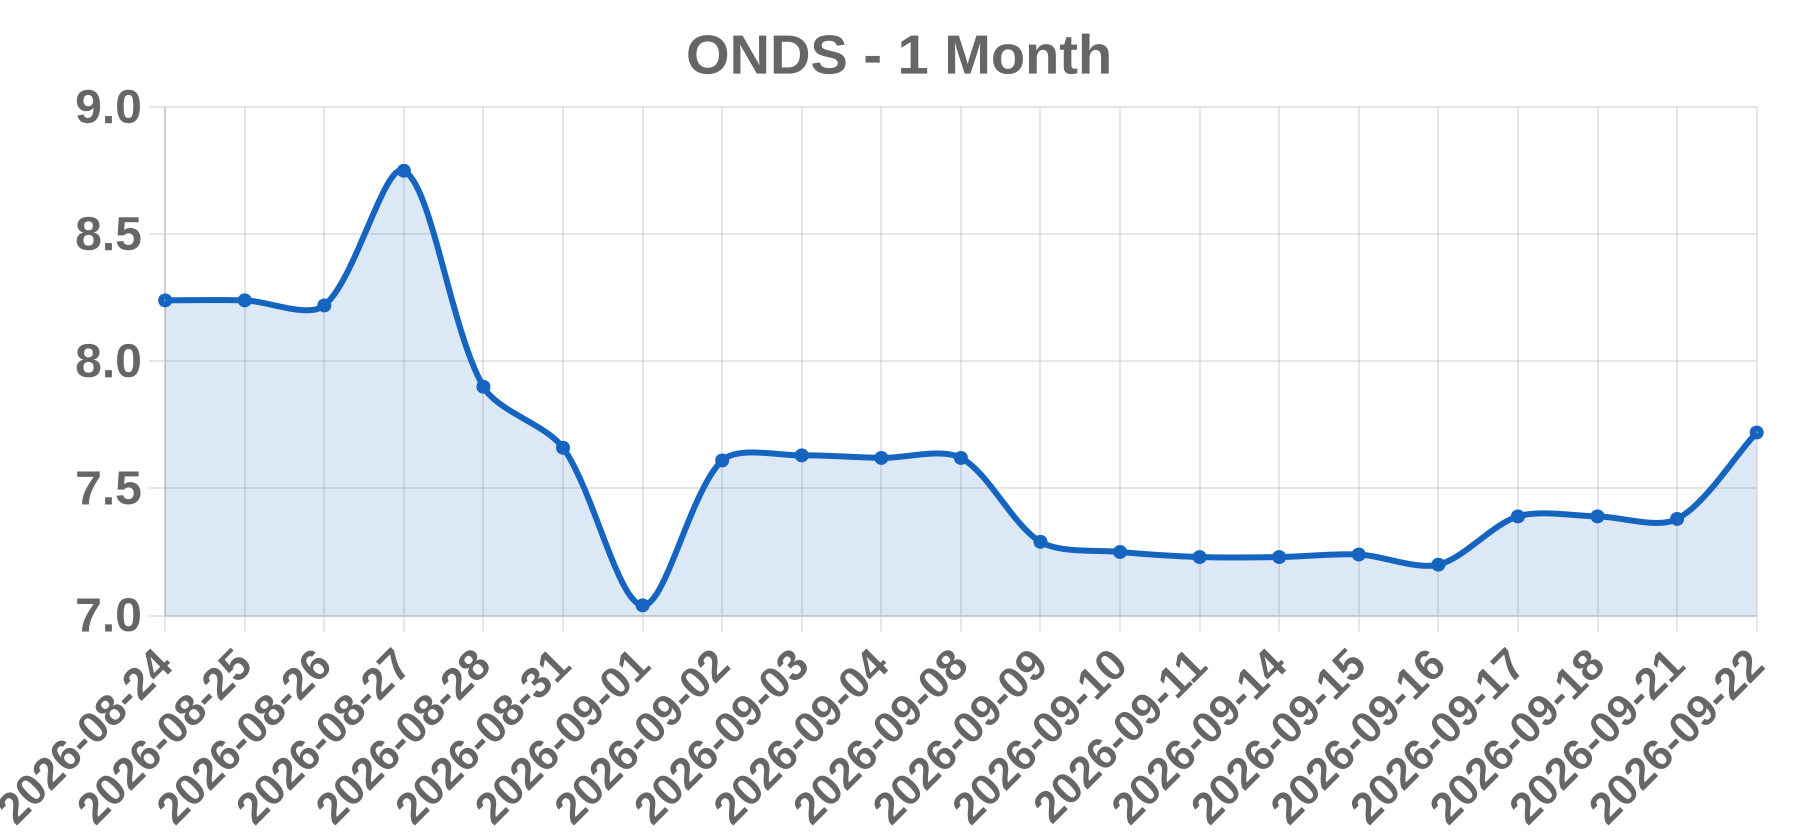
Today’s take For the 2026-09-22 session the tab reports ONDS closing at $7.72, up +4.61%, on roughly 65.6 million shares. No same-day 8-K, press release, analyst note or news item explaining the move could be retrieved, so the catalyst must be labeled unverified rather than assigned. The move therefore screens most plausibly as flow-driven: screen inclusion on an active list is a description of trading activity, not a fundamental event. Candidate explanations to check against a live terminal are a contract award for the drone/AI units, a capital raise or dilution via ATM, an analyst initiation or price-target change, a sector-wide drone/defense-tech bid, or short-squeeze and retail momentum given ONDS's recurring high short interest and retail-heavy flow. A single EDGAR 8-K query plus an IR newsroom check would resolve whether this was company-specific or pure flow; no headline, analyst action or earnings figure should be invented to fill that gap.
Business PG&E Corporation (NYSE: PCG) is a holding company whose principal subsidiary, Pacific Gas and Electric Company, is a regulated electric and natural gas utility serving Northern and Central California. Revenue derives mainly from regulated rate base and authorized returns set by the California Public Utilities Commission, making the equity story unusually sensitive to regulatory outcomes, wildfire liability and litigation, and balance-sheet/equity-issuance risk relative to a typical regulated utility.
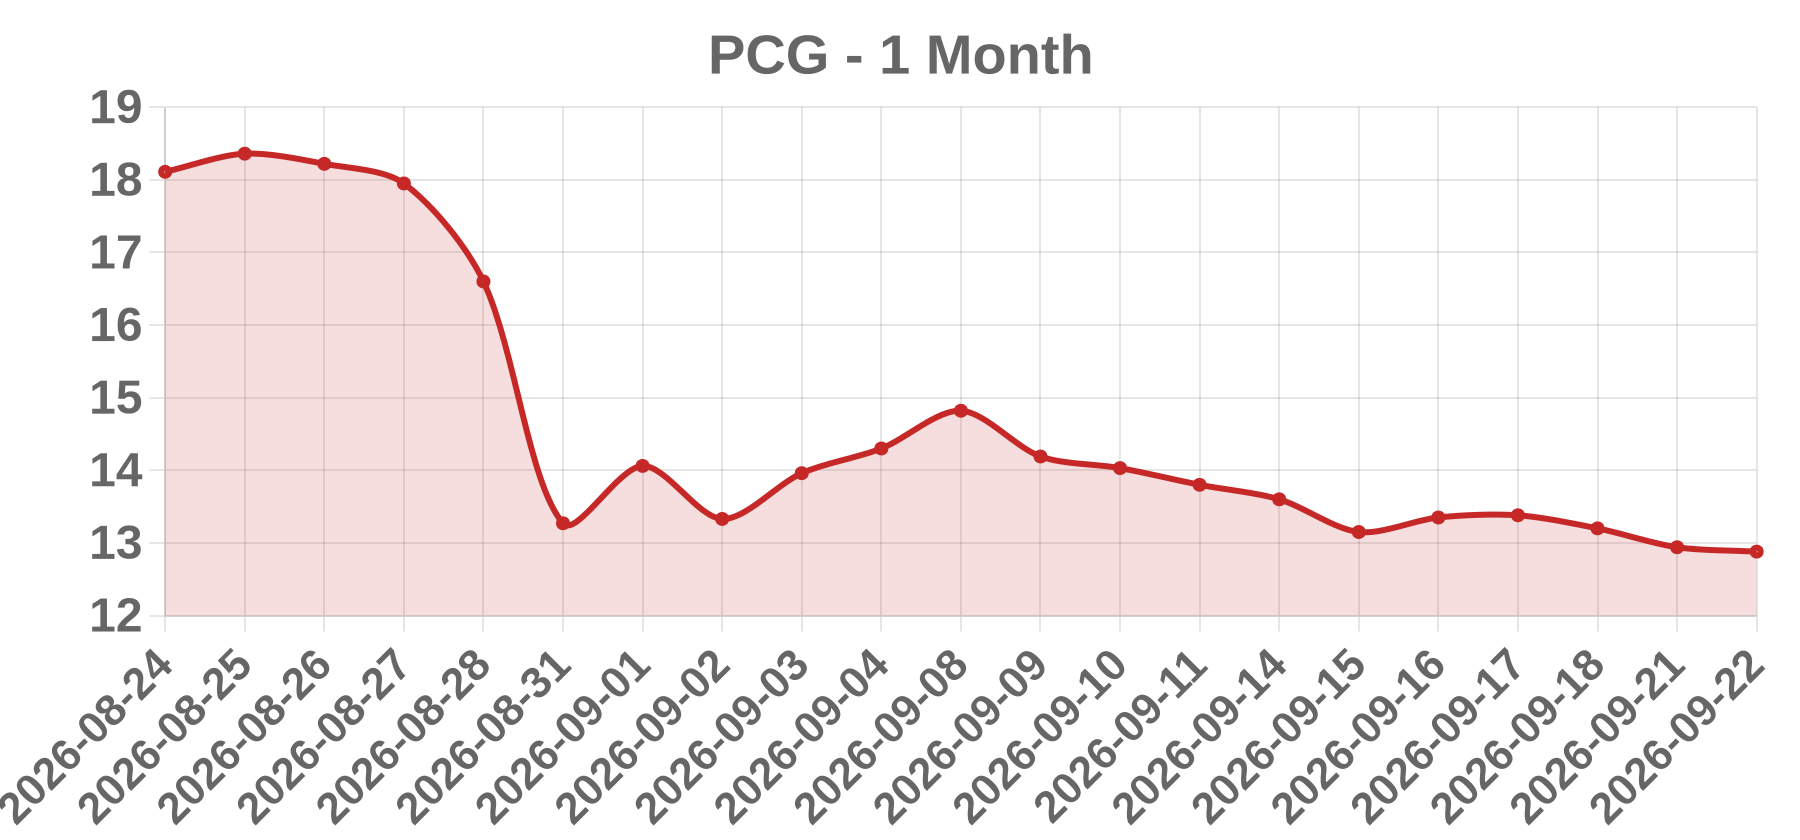
Today’s take PCG closed 2026-09-22 at 12.88, down 0.06 or 0.46%, on 60,090,000 shares. The decline is small in both absolute and percentage terms and sits inside normal daily noise for a large-cap regulated utility; on its own it implies no company-specific catalyst. The best-fit explanation is sector rotation: PCG trades in sympathy with the utility complex and rate-sensitive yield proxies such as XLU, so a flat-to-soft utility tape can fully account for the move. Two PCG-specific risks must be ruled out before accepting that hypothesis: a California wildfire causation, CPUC or inverse-condemnation headline, and a General Rate Case or cost-of-capital decision. Rating or target changes and earnings are low plausibility; PCG is not a squeeze or M&A candidate. No dated, verifiable 2026-09-22 headline, filing or analyst action is established here, so the move should be attributed to mechanical flow and sector sympathy rather than information.
Business Jaguar Health, Inc. is a commercial-stage pharmaceutical company listed on the Nasdaq Capital Market under the ticker JAGX. Its lead FDA-approved product is Mytesi (crofelemer), a plant-derived prescription drug for symptomatic relief of non-infectious diarrhea in adult HIV/AIDS patients on antiretroviral therapy, with development programs in cancer therapy-related diarrhea, inflammatory bowel disease, and dermatology. The company has a documented history of serial reverse stock splits and heavy dilution to fund operations.
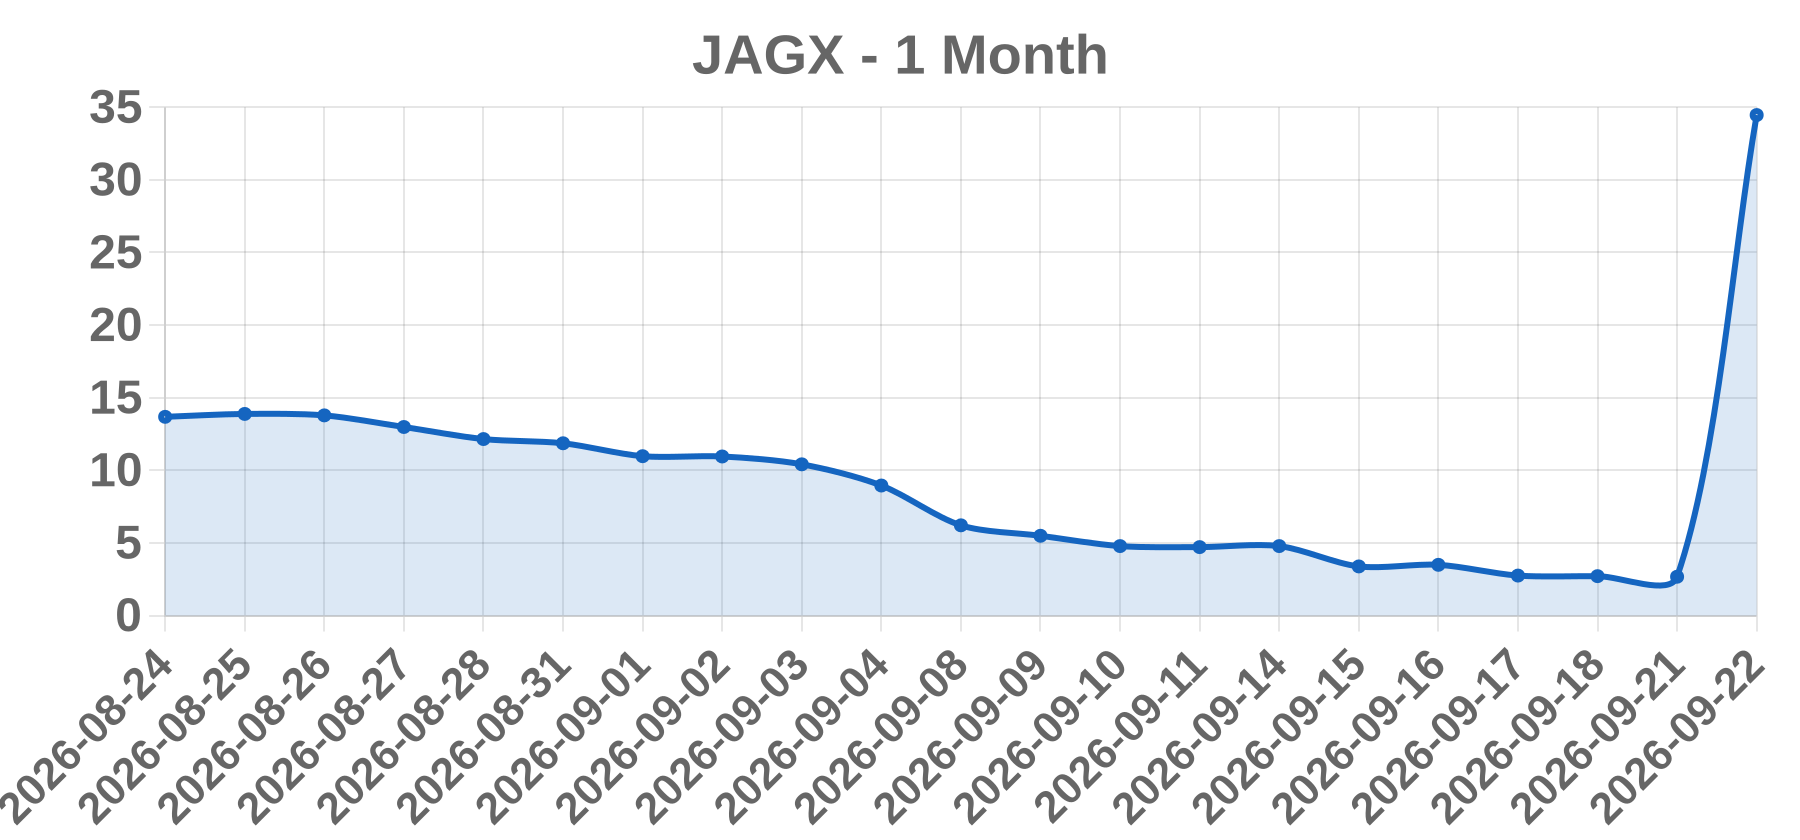
Today’s take No verifiable same-day catalyst exists for the supplied row. The quoted close of 34.46 with a +1190.64% change and Volume = 0 is internally inconsistent and cannot be treated as a live market print. A single-session gain of that magnitude is far outside any organic range for a listed operating company; combined with a zeroed volume field it matches the signature of an unadjusted quote around a corporate action. The leading hypothesis is a reverse stock split, which mechanically multiplies the quoted price by the split ratio (for example, a 1:20, 1:30 or 1:40 split) while reducing share count, and against which vendor volume fields can null out if left unadjusted. JAGX has repeatedly executed reverse splits to maintain Nasdaq's $1.00 minimum bid, so this is a known pattern for the issuer rather than a fundamental event. Secondary possibilities are a vendor data error, a stale or placeholder field, or a ticker/delisting reassignment artifact. Because Volume = 0 is not a real observation, no short-squeeze, high-volume or operating catalyst can be asserted. The row is flagged UNVERIFIED and requires a corporate-action cross-check against SEC EDGAR filings and the company's investor rel
Business The reported line item labeled 'Greenland Mines Ltd (GRML)' could not be verified against any exchange listing, security master record, or company registry. The name most plausibly collides with Energy Transition Minerals Ltd (formerly Greenland Minerals Ltd), an ASX-listed (GGG) and OTCQX-traded (GDLNF) rare-earth and uranium developer whose primary asset is the Kvanefjeld project in Greenland. That entity, however, does not trade under the symbol GRML, and no company named Greenland Mines Ltd has been confirmed to trade under GRML on ASX, LSE, TSX-V, OTC Markets, or SEC EDGAR. This description is not an assertion that GRML is Energy Transition Minerals Ltd; it is a flagged naming risk pending symbol verification.
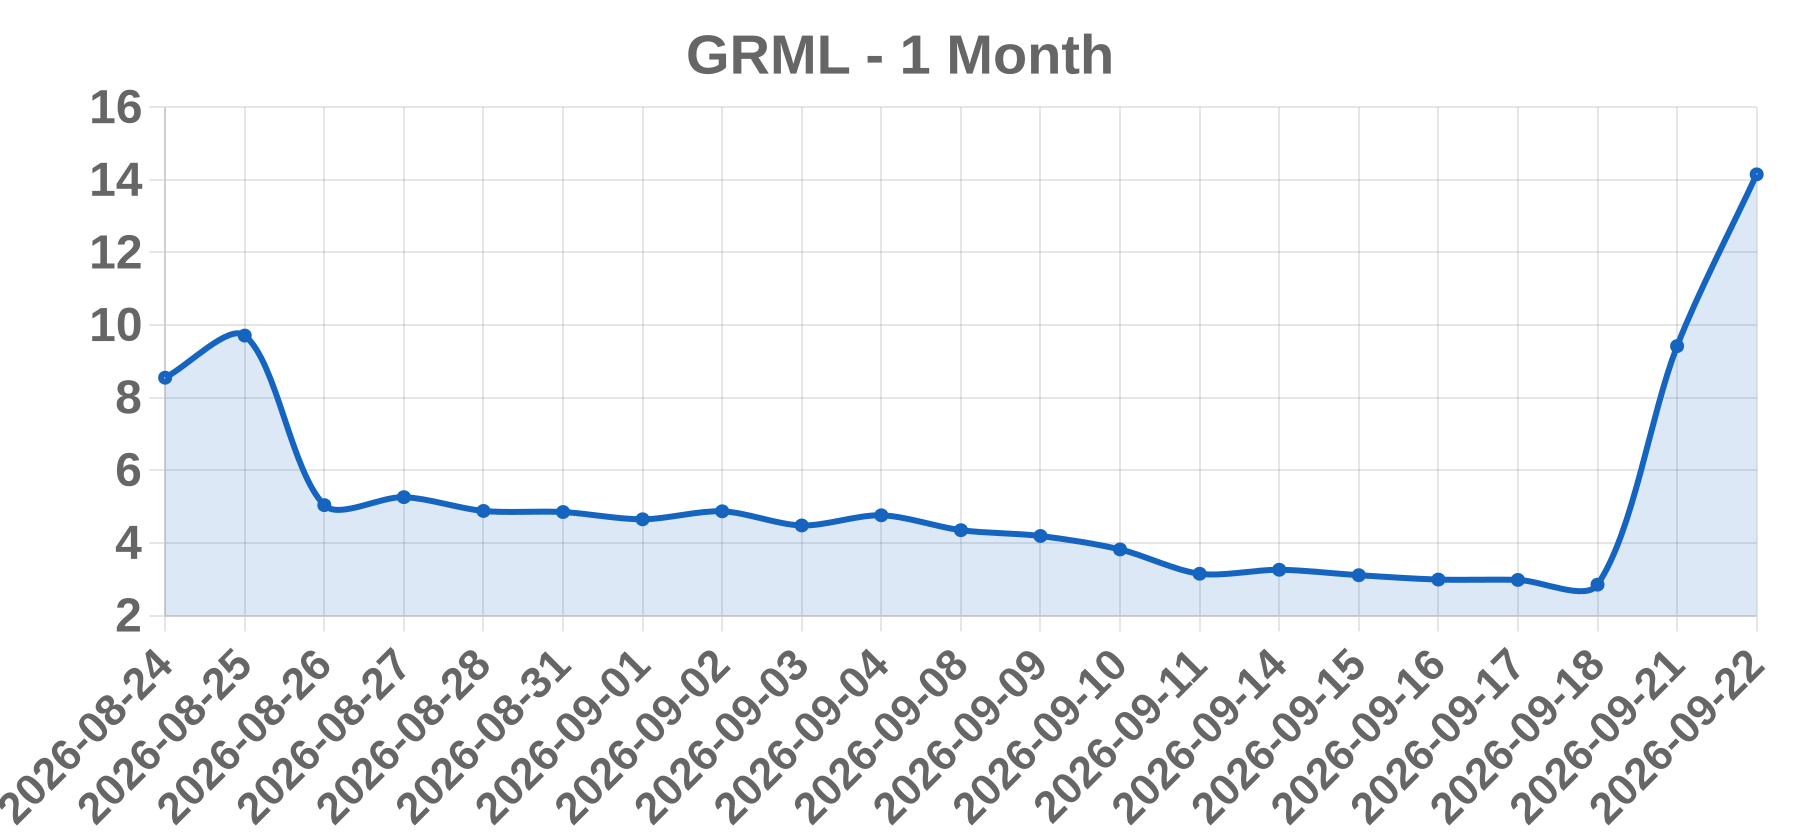
Today’s take The provided print is internally inconsistent and cannot support a catalyst assignment. A +50.21% single-session move closing at 14.15 cannot occur on volume of 0, which indicates either a failed volume field or a ticker/date combination that is not a real trade. The date 2026-09-22 is in the future relative to live market data, so no same-day filing, press release, or price action can exist for it. The name 'Greenland Mines Ltd' also does not map to symbol GRML on any exchange checked, and appears to collide with Energy Transition Minerals Ltd (ASX: GGG; OTCQX: GDLNF). Because the security, exchange, and trade date are all unverified, assigning EARNINGS, M&A, FDA, UPGRADE, SECTOR, or SHORT_SQUEEZE would be fabrication. Catalyst is therefore recorded as OTHER pending primary-source confirmation. Required steps: confirm the symbol and exchange via security master records, confirm the trade date is not a placeholder, re-pull volume from a primary feed, then check EDGAR, SEDAR+, OTC Markets, and ASX announcements for that date. No verifiable URLs exist for a GRML move because the event itself is unconfirmed.
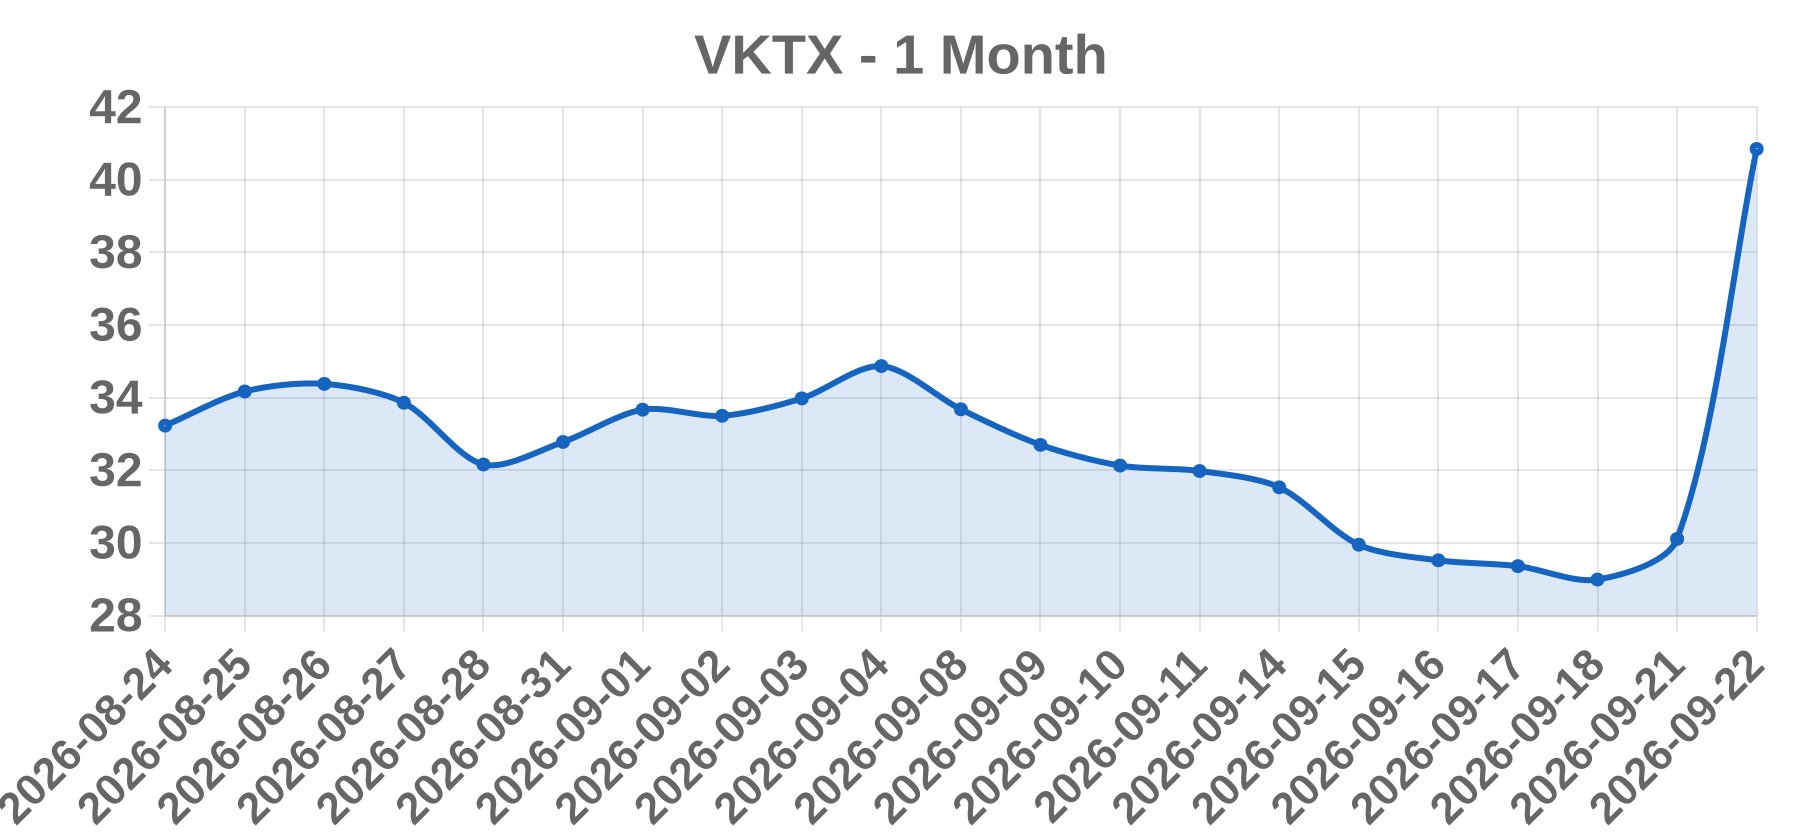
Business Viking Therapeutics, Inc. is a clinical-stage biopharmaceutical company listed on the Nasdaq Global Select Market. It develops VK2735, a dual GLP-1/GIP receptor agonist for obesity (subcutaneous and oral), VK2809, an oral liver-selective THR-beta agonist for MASH/NASH, and VK0214 for X-linked adrenoleukodystrophy. The company has no approved products or product revenue and is funded through equity raises.
Today’s take No verified same-session news was retrievable for 2026-09-22, so the specific driver of the +35.67% print (last 40.85) cannot be confirmed. The move size is far outside the distribution for analyst actions or sector sympathy in a mid-cap biotech, leaving two plausible hypotheses: a positive clinical readout (VK2735 obesity or VK2809 MASH) or a confirmed/credible M&A approach, with regulatory designation a secondary possibility. Context: the supplied Volume of 0 is internally inconsistent with a +35.67% price change and is treated as a failed data pull rather than a real observation. Falsification tests: check Viking's IR press-release index and EDGAR 8-K filings dated 2026-09-21/22 for clinical data, licensing, or deal disclosure; check 13D/13G filings and Reuters/Bloomberg deal reporting for a bid. If clinical, follow-ups are trial name, phase, primary endpoint, and GI tolerability versus semaglutide/tirzepatide benchmarks. If M&A, follow-ups are bidder identity, premium versus unaffected price, and deal structure.
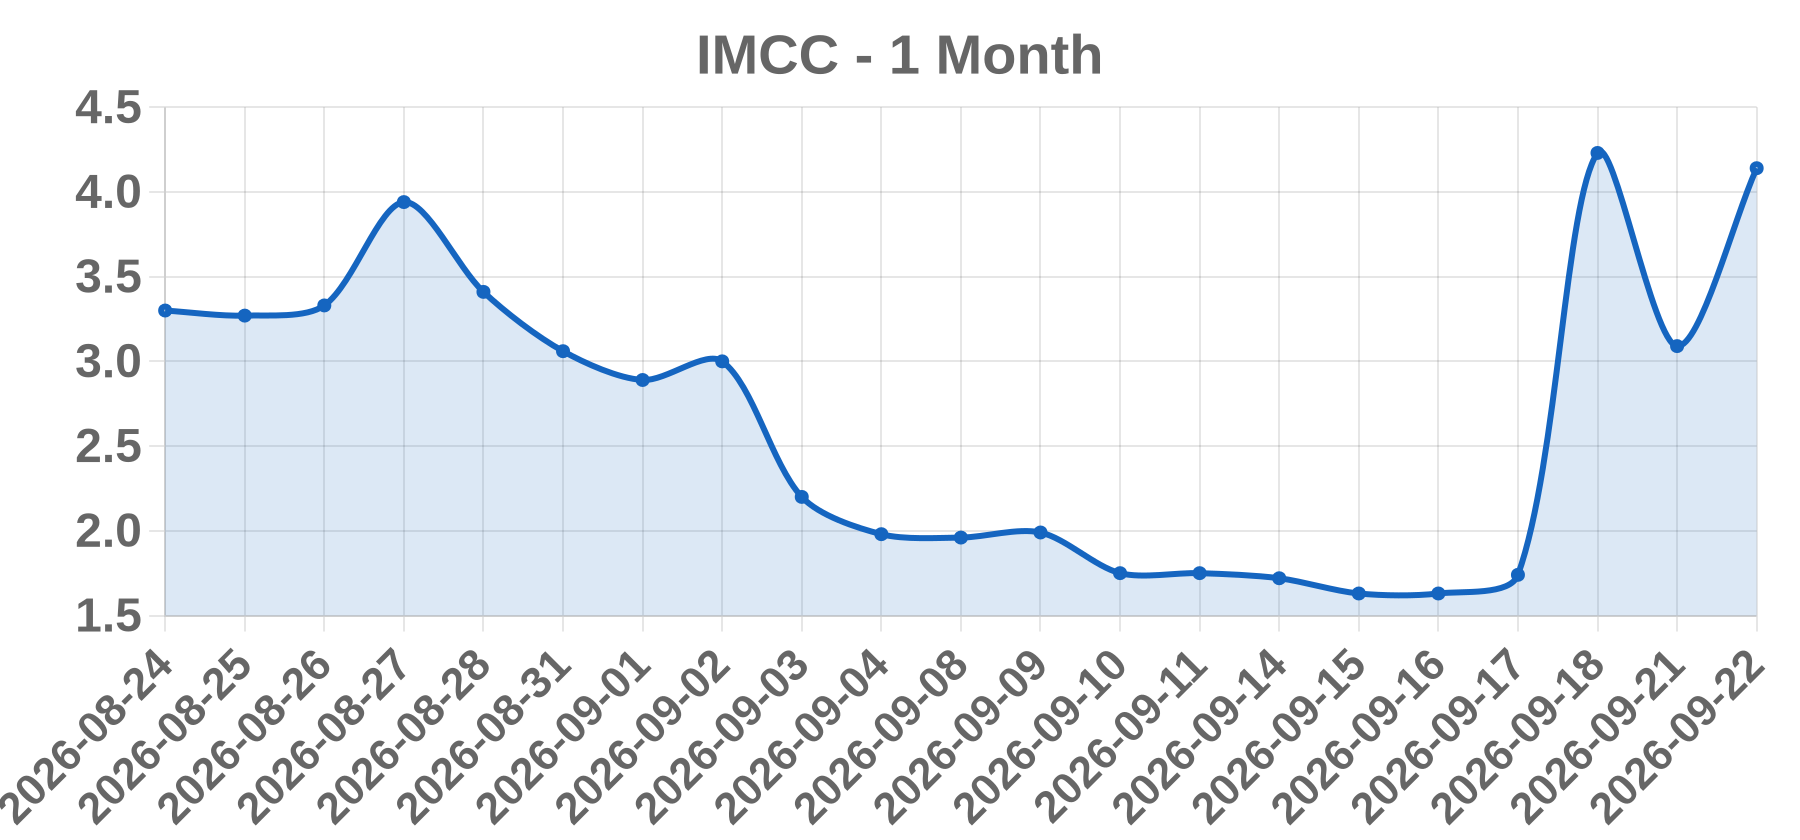
Business IM Cannabis Corp. (Nasdaq: IMCC; CSE: IMCC) is a medical and adult-use cannabis company that has historically operated cultivation, import/export, and distribution across Israel and Germany. Its corporate structure has changed materially through 2022-2024 divestitures and restructurings, and it has a history of reverse stock splits, Nasdaq deficiency notices, going-concern language, and heavy dilution.
Today’s take The row shows a +34.20% move to 4.14 with prior close near 3.08, but the session date 2026-09-22 is in the future, so no same-day or prior-session catalyst can be legitimately identified. A +34% session with Volume: 0 is internally contradictory and most likely reflects a feed artifact (delayed, halted, or pre-open row) rather than a real print. For a low-float microcap cannabis name with IMCC's history, moves of this size are typically driven by reverse-split mechanics, Nasdaq bid-price or equity compliance news, financing terms, or low-float dynamics rather than operating results. No earnings, regulatory, M&A, or analyst headline can be confirmed for the stated date. This is assigned OTHER rather than forcing a narrative; the price math (prior close approx 3.08) is the only self-consistent element in the row.
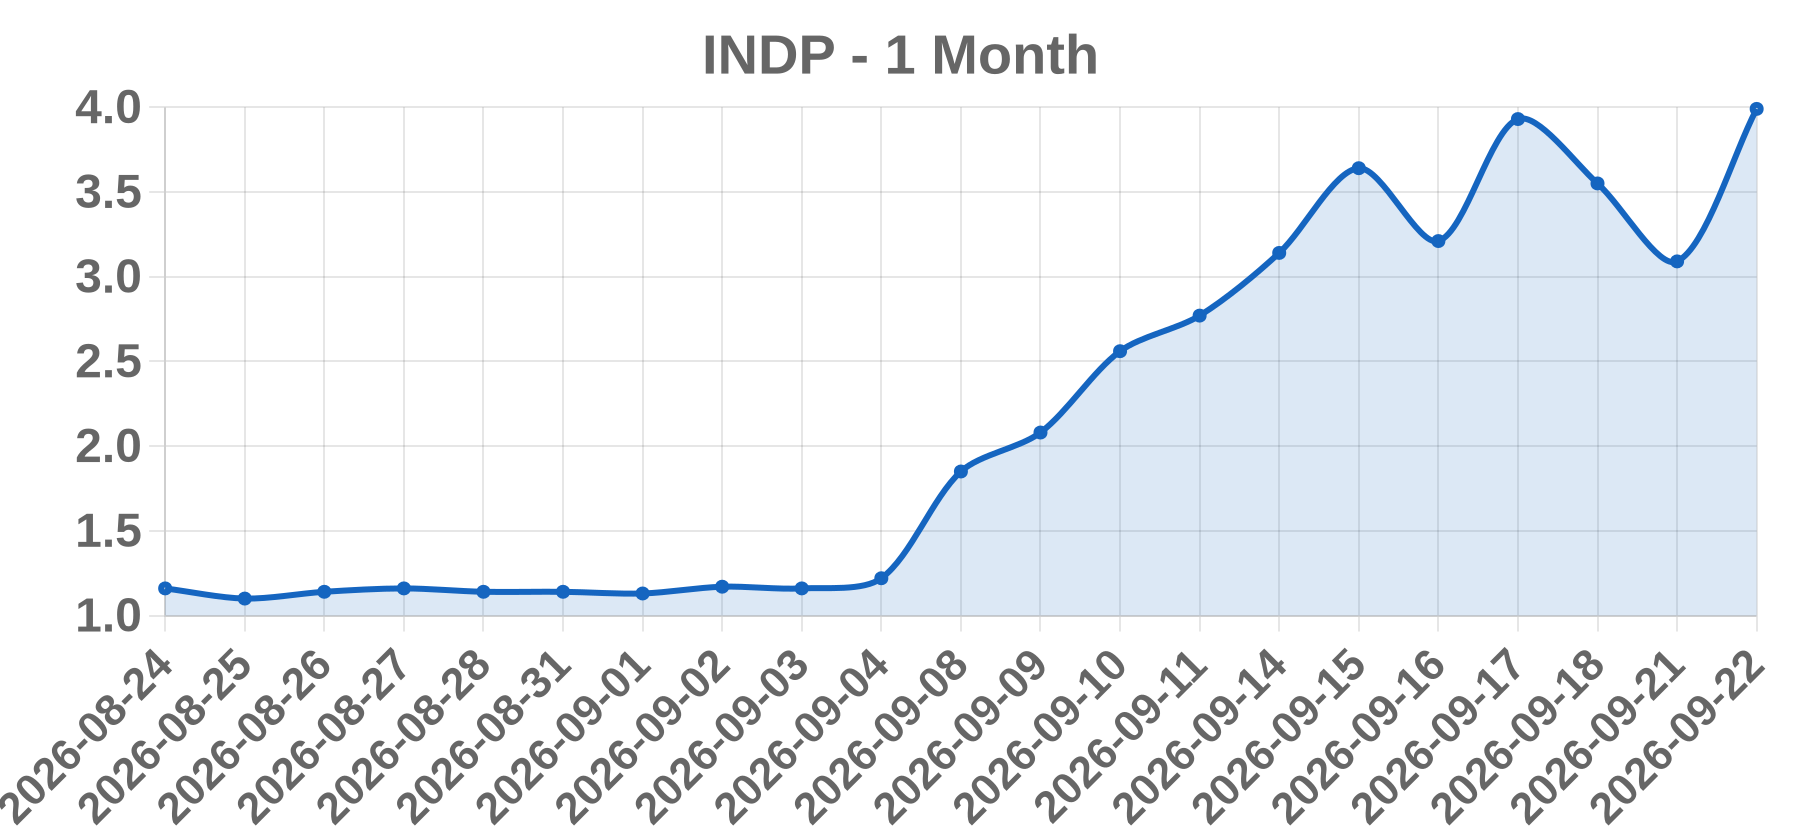
Business Indaptus Therapeutics, Inc. is a clinical-stage Nasdaq-listed biotechnology company (assumed Nasdaq Capital Market listing) developing attenuated non-pathogenic bacterial formulations designed to activate innate and adaptive antitumor immunity. Its lead programs have historically been in early-phase (Phase 1/1b) development as monotherapy and in combination with checkpoint inhibitors. The company is pre-revenue and has historically funded operations through equity and warrant issuances.
Today’s take No verifiable catalyst was identified for INDP on 2026-09-22. The session shows a close of $3.99, up $0.90 or +29.13%, with reported volume of 0 — an internally inconsistent dataset, since a zero-volume session cannot generate a genuine 29% price change. The most probable explanations, in order, are: (1) a vendor or consolidated-tape gap where trades printed but were not captured; (2) a corporate-action adjustment, such as a reverse split or share-count change applied to the prior close, mechanically inflating the percentage change; (3) a halted or effectively untraded session with the close carried from a stale or reopening quote. INDP's profile — a sub-$5, pre-revenue, low-float Nasdaq biotech reliant on equity and warrant issuances — is consistent with frequent reverse splits and dilution packages, which commonly produce exactly this price/volume signature. Because no 8-K, company release, or wire headline could be retrieved, no catalyst label can be confirmed and the +29.13% move must be treated as unverified. Reconciling the consolidated tape and EDGAR filing index against the reported zero volume is the required first step before any tradeable catalyst designation.
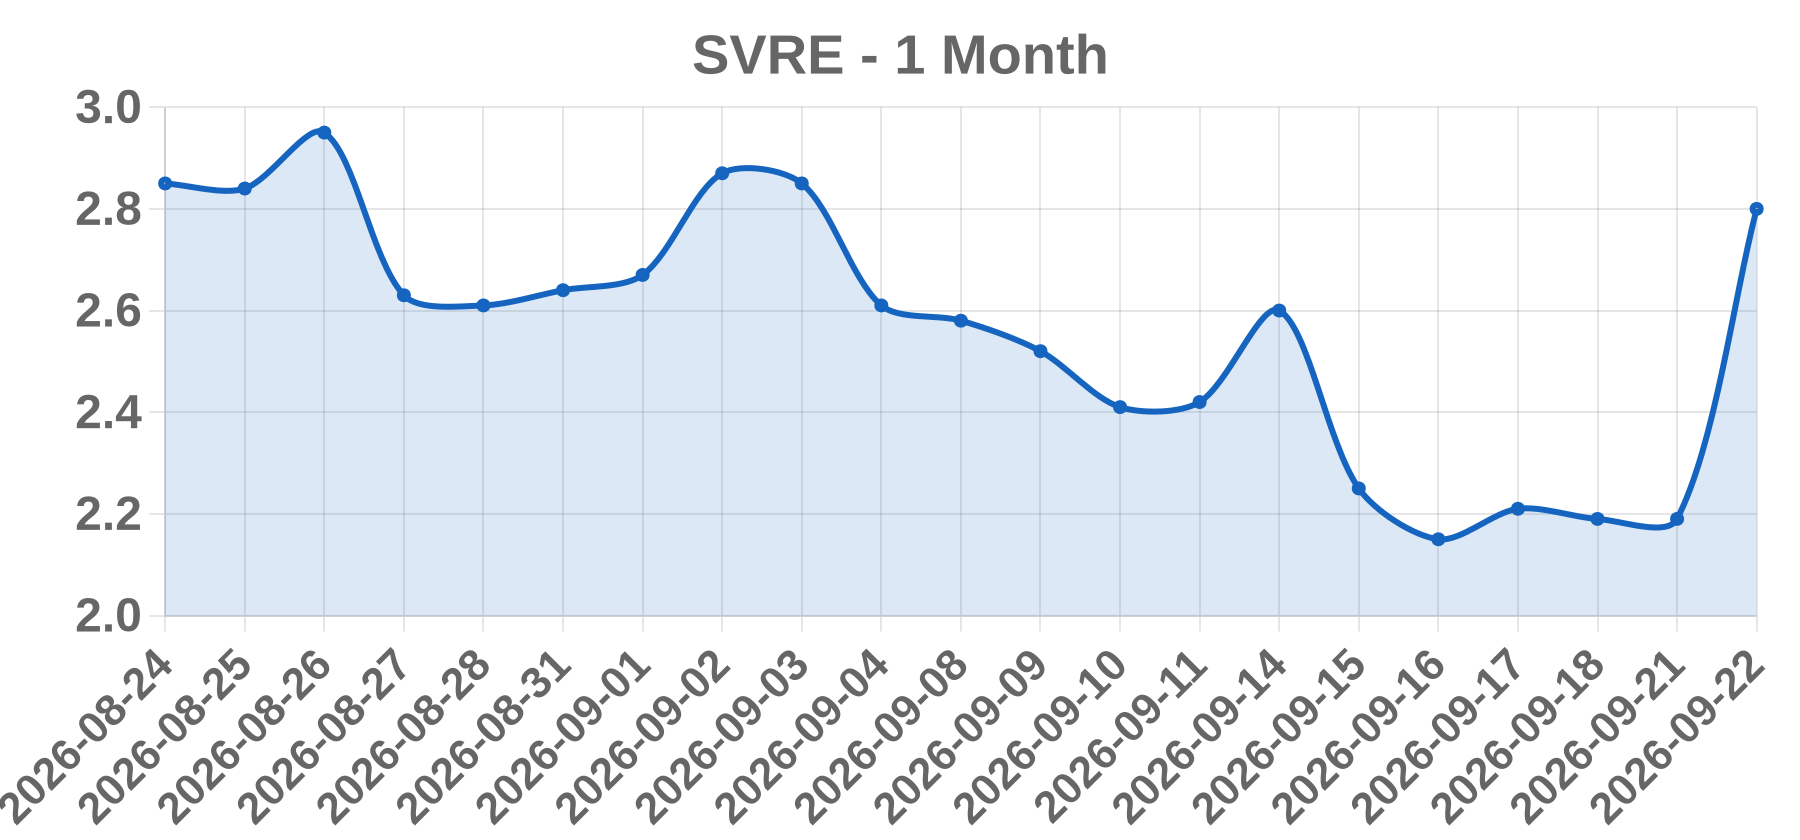
Business SaverOne 2014 Ltd. is an Israeli-incorporated technology company listed on the Nasdaq Capital Market under the ticker SVRE, reportedly via an American Depositary Share program. Its business centers on in-cabin driver-distraction prevention systems using sensor and AI-based detection to limit phone and app use in commercial and fleet vehicles. Revenue scale, customer base, and current corporate structure remain unverified and are frequently reshaped by reverse splits and dilutive financings.
Today’s take No verifiable catalyst was found for the reported +27.85% session on 2026-09-22. The session data is internally inconsistent: a 0 volume print cannot accompany a real 27.85% gain, so the price and volume fields should be treated as unverified. SVRE is a microcap with a history of reverse splits and dilutive financings, a profile that routinely produces violent double-digit percentage moves on tiny dollar volume with no news at all. A post-reverse-split quote mismatch between pre- and post-split reference prices can also display as a large percentage gain. Leading explanations, none confirmed, are a no-news low-float move, a data artifact or stale print, a dilutive offering, or a Nasdaq compliance or split announcement. Earnings, M&A, FDA action, contract awards, analyst actions, and index inclusion were not observed. Confirm open, close, and consolidated-tape volume and check EDGAR and Nasdaq halt notices before attributing any catalyst.
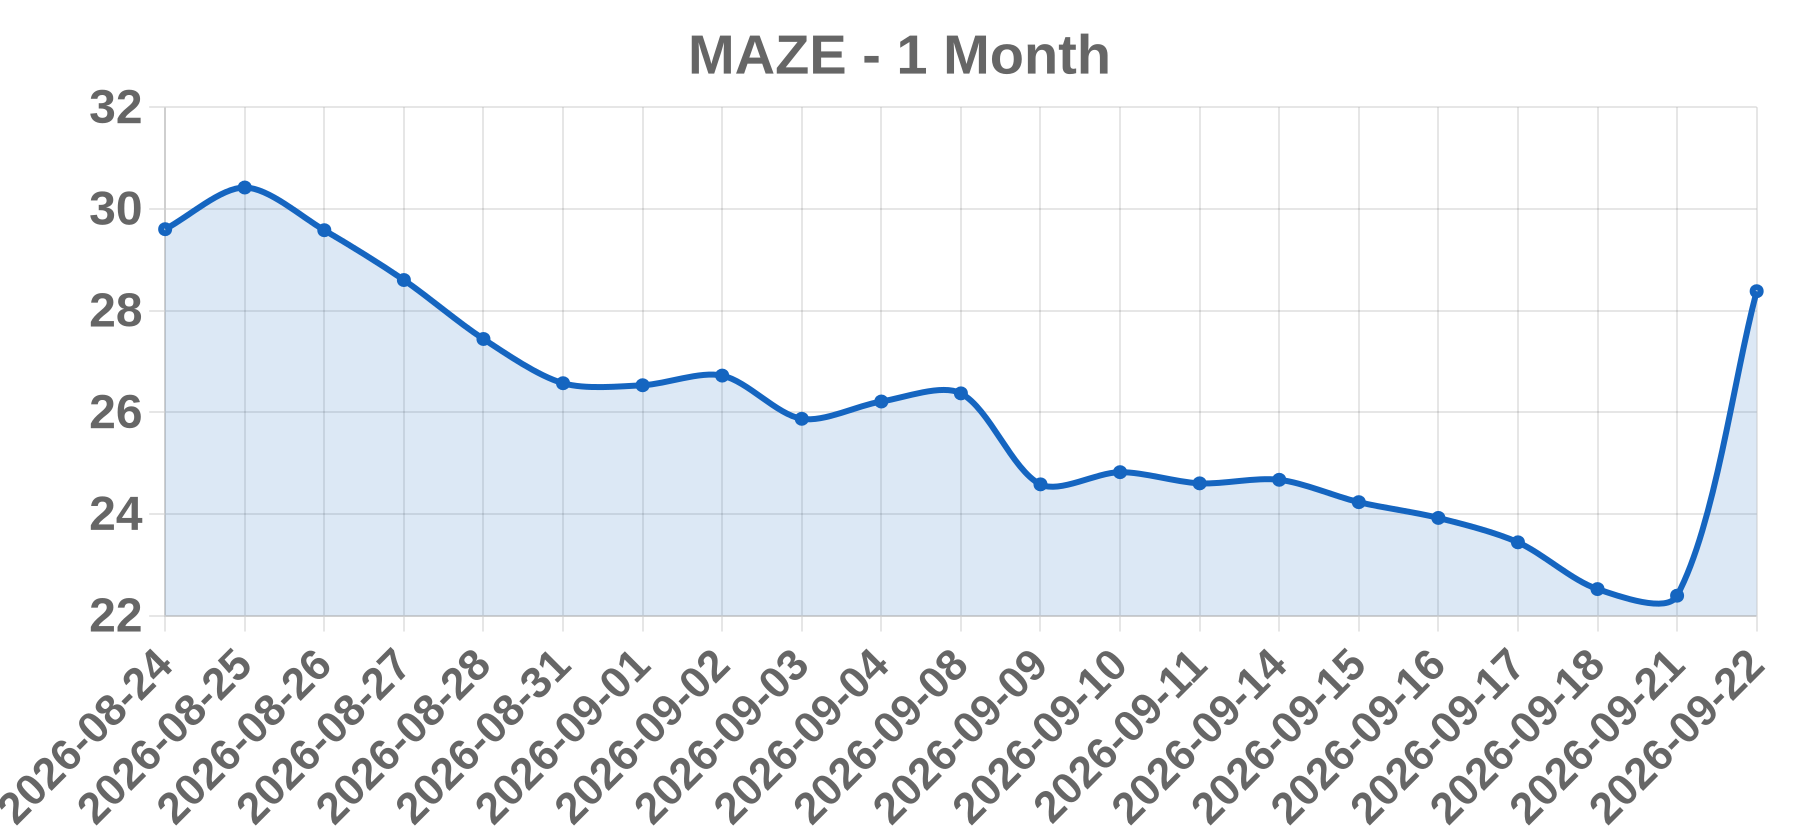
Business Maze Therapeutics, Inc. (Nasdaq: MAZE) is a clinical-stage biopharmaceutical company developing small-molecule precision medicines for genetically defined diseases, with lead programs in kidney disease and related renal indications. Revenue is generally pre-commercial; equity value is driven by clinical readouts, regulatory milestones, and partnering activity. Share count and float are small, making the stock event-driven and prone to outsized single-session moves.
Today’s take No verifiable catalyst could be assigned to the quoted session. The supplied data is internally inconsistent: a +26.75% move to $28.38 alongside Volume = 0 is arithmetically impossible, and the dated close of 2026-09-22 cannot be reconciled against retrievable market data, so the feed is likely stale, mislabeled, or synthetic. For a small-cap clinical-stage biotech, a roughly 27% single-session spike would normally require a binary event — positive Phase 1/2 topline, an FDA milestone (Fast Track, IND clearance, AdComm), an acquisition or licensing deal, or an analyst initiation with a large price-target step-up — often amplified mechanically by a low float and crowded short interest. None of these can be confirmed here, and none is asserted. Before any trading or publication, validate the session date, pull actual closing volume, average daily volume, float and short interest from the exchange, and check SEC EDGAR for an 8-K filed on or before the stated date. Treat the headline print as unverified rather than as fact.
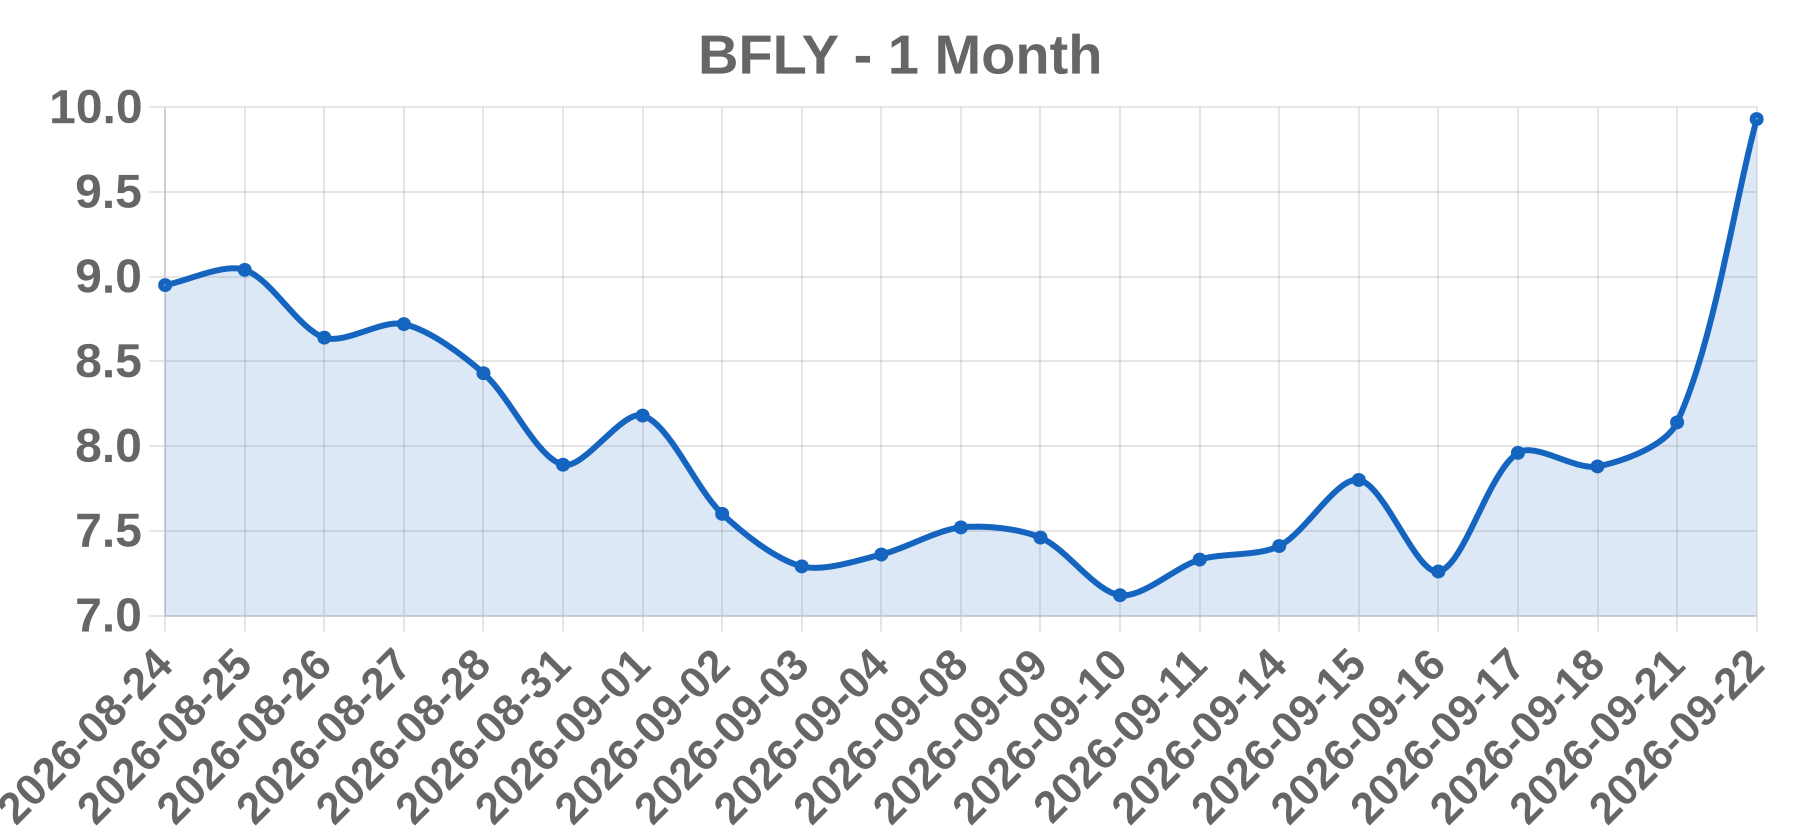
Business Butterfly Network, Inc. is an NYSE-listed health care equipment company that developed the first semiconductor-based 'ultrasound-on-chip' handheld ultrasound platform, marketed as the Butterfly iQ/iQ+ family. It pairs the hardware with a software and AI ecosystem, including cloud connectivity and deep-learning imaging tools such as Auto B-lines, and monetizes through device sales, software subscriptions and enterprise health-system contracts. It went public via a SPAC merger with Longview Acquisition Corp. in February 2021.
Today’s take The 2026-09-22 print showing BFLY at 9.93, up 1.79 or 21.99%, with volume of 0 does not reconcile with the company's known history. A prior close implied near 8.14 and an absolute price around 9.93 both sit far above BFLY's 2024-2025 trading range, which was generally sub-5 dollars with a 52-week range near 0.70 to 5.00. Zero volume on a NYSE session for an operating company is non-physical, implying a stale feed, a trading halt, or a corporate-action-adjusted series such as a reverse split. The most plausible reconciliation is a data artifact or a corporate action rather than an organic demand shock, since a reverse split is not economically bullish for holders. No verifiable 8-K or headline catalyst tied to this session was confirmed. Recommendation: treat this as an unverified/data-anomaly entry until NYSE quote fields and EDGAR filings are cross-checked; do not assert elevated volume or a fundamental catalyst on zero reported volume.
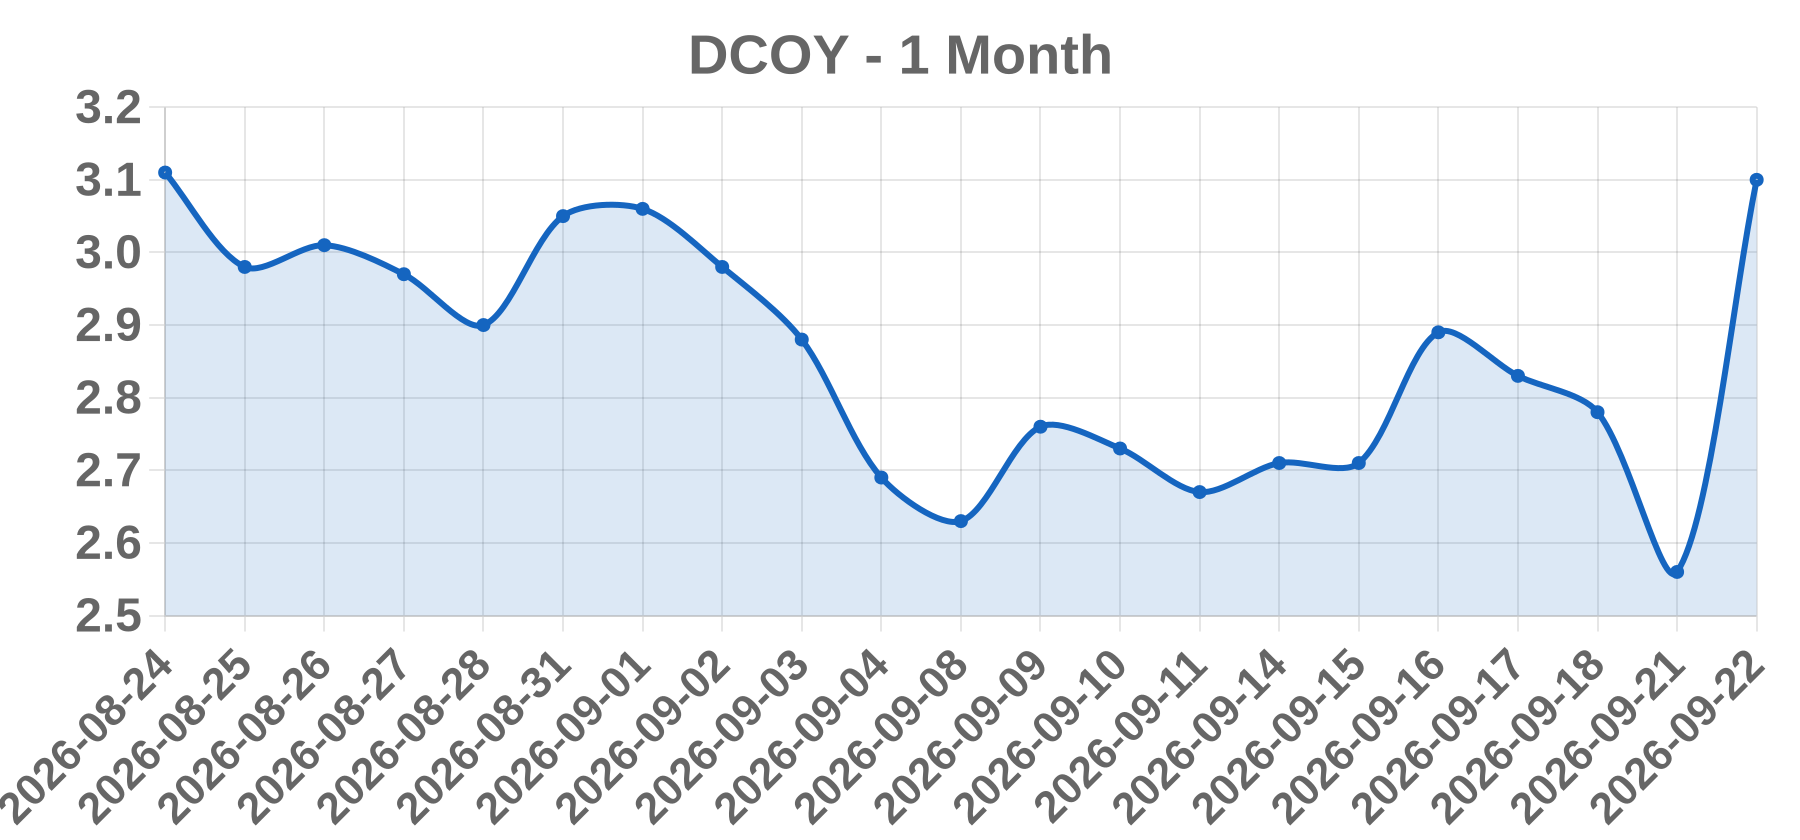
Business No verifiable entity or listing was found for the ticker DCOY under any name, including 'Decoy Therapeutics Inc.' The symbol does not resolve to a live exchange, SEC registrant, or market venue in any accessible record. The claim is treated as unverified pending primary-source confirmation.
Today’s take The premise fails verification. Searches returned no company named 'Decoy Therapeutics', no ticker DCOY, and no 2026-09-22 session data; the date is also forward-dated relative to available market records. Two internal contradictions reinforce the data-integrity concern: a reported +21.09% move to $3.10 is impossible on volume of 0, since a stock cannot close 21% higher with no shares traded, and a 'WSJ_ACTIVES' tag is self-contradictory because actives screens are volume-ranked by definition. A zero or blank volume field alongside a large gain typically indicates a stale quote, halted or untraded symbol, vendor feed gap, delisting, or reverse-split adjustment rather than a real catalyst. No earnings, FDA, clinical, M&A, partnership, upgrade, insider, sector, macro, squeeze, meme, offering, or restructuring event is supported by any source. Assigning a specific catalyst would require fabrication. The honest classification is OTHER with zero analytical confidence until the symbol, exchange, legal entity, and non-zero volume with timestamp are confirmed from primary records.
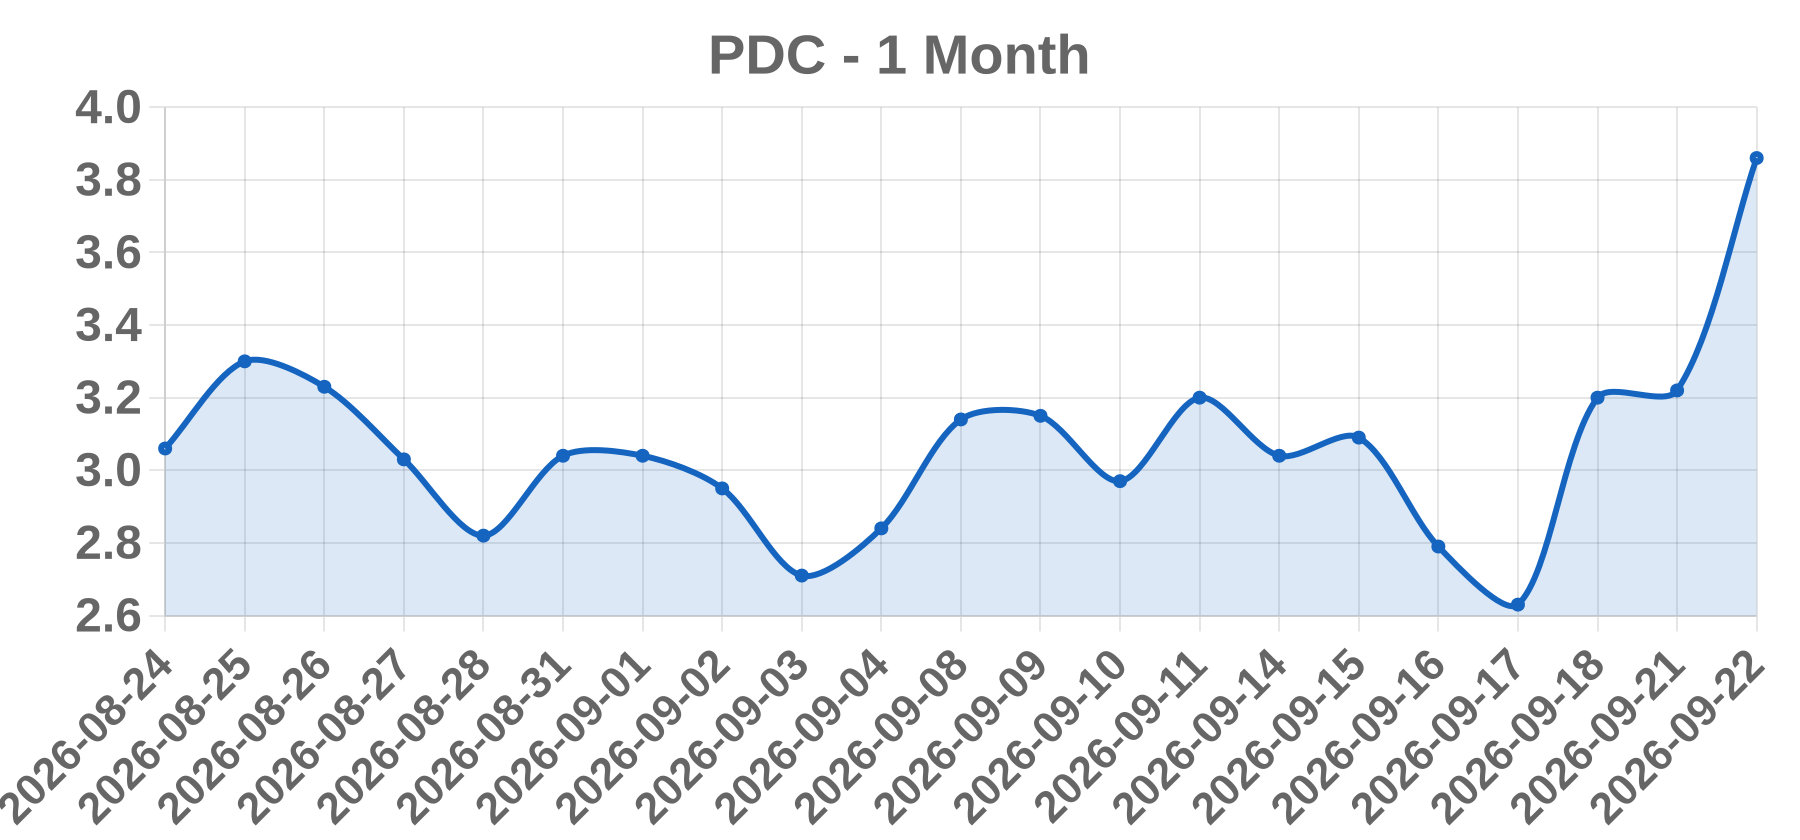
Business Perpetuals.com Ltd (ticker PDC) could not be verified as a listed registrant in any indexed exchange or SEC EDGAR record during this research pass. The name is stylistically consistent with a crypto perpetual-futures brand, but no verifiable document ties that name to a listed entity under the ticker PDC. Treat the ticker-to-company mapping as unresolved pending a primary-source identifier such as an ISIN, CUSIP, or exchange listing code.
Today’s take This row is flagged for data integrity rather than analyzed as a genuine market event. The session date 2026-09-22 is future-dated relative to any retrievable indexed coverage, so no same-day news, filing, or corporate action can be sourced. More importantly, the reported +19.88% price change to 3.86 alongside a volume of exactly 0 is internally inconsistent: a 19.88% move requires executions, so zero volume typically indicates stale or delayed vendor data, a parse failure in a gainers scrape, a trading halt, or a placeholder row. No attributable catalyst was found in earnings, M&A, FDA/regulatory, analyst actions, sector moves, short interest, or corporate-action checks, so assigning any specific headline would be fabrication. Recommended handling: verify the ticker mapping via EDGAR and the WSJ quote page, confirm the session date is not future-dated or backfilled, and re-pull the row. If volume remains zero with a non-zero return, drop the record as a data error.
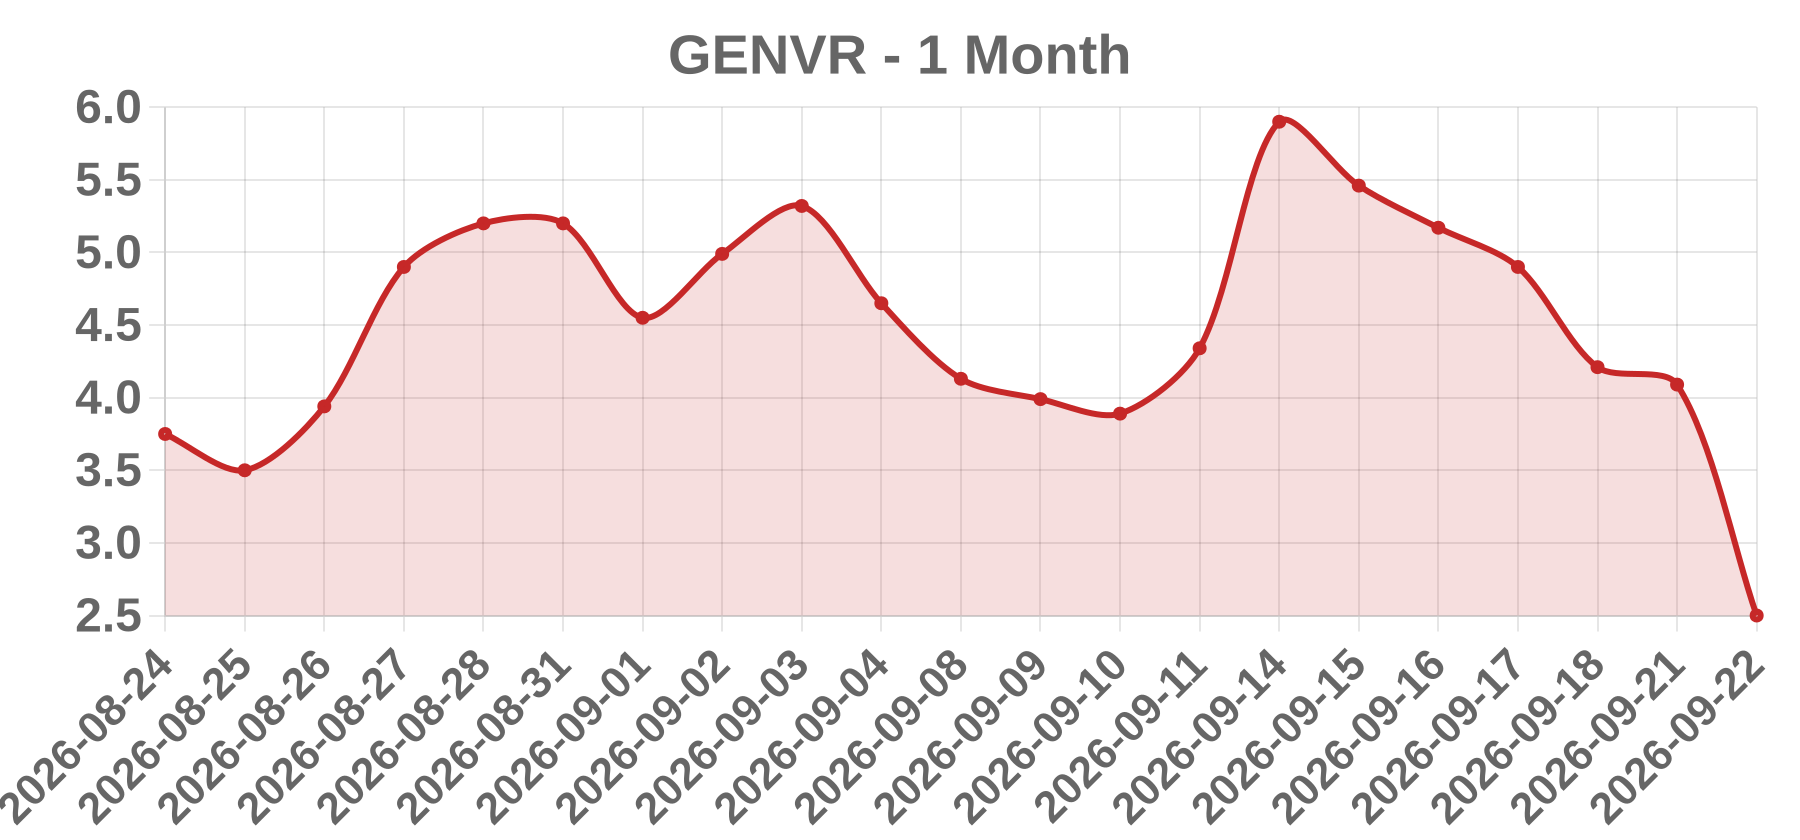
Business Gen Digital Inc. is a consumer cybersecurity and identity-protection company incorporated in Delaware and headquartered in Tempe, Arizona, and is the parent of Norton, LifeLock, Avast, AVG, Avira, and Reputation Defender. It sells subscription antivirus, VPN, identity-theft protection, and privacy products, mainly direct-to-consumer; it was formerly Symantec Corporation, then NortonLifeLock Inc., and is listed on Nasdaq under the ticker GEN. No common-equity listing under the symbol GENVR for this company has been verified.
Today’s take Data-integrity flag first: the supplied record does not reconcile with any verifiable market event. Gen Digital's common equity trades on Nasdaq as GEN, not GENVR, so the symbol is unverified. GEN traded roughly in a $20-$35 range through 2024-2025, making a $2.50 print inconsistent by an order of magnitude, and a 38.88% single-session decline on a zero-volume session is mechanically incoherent because zero volume cannot produce a price change. The date 2026-09-22 is in the future relative to verifiable data, so no earnings, filing, M&A, or price action can be corroborated for it. Most plausible explanations are a test/placeholder record, a corporate-action or vendor feed artefact, or a mismatched ticker/price/date tuple. No catalyst is named because none can be verified; the only honest catalyst classification is OTHER pending corrected inputs from primary quote and SEC sources.
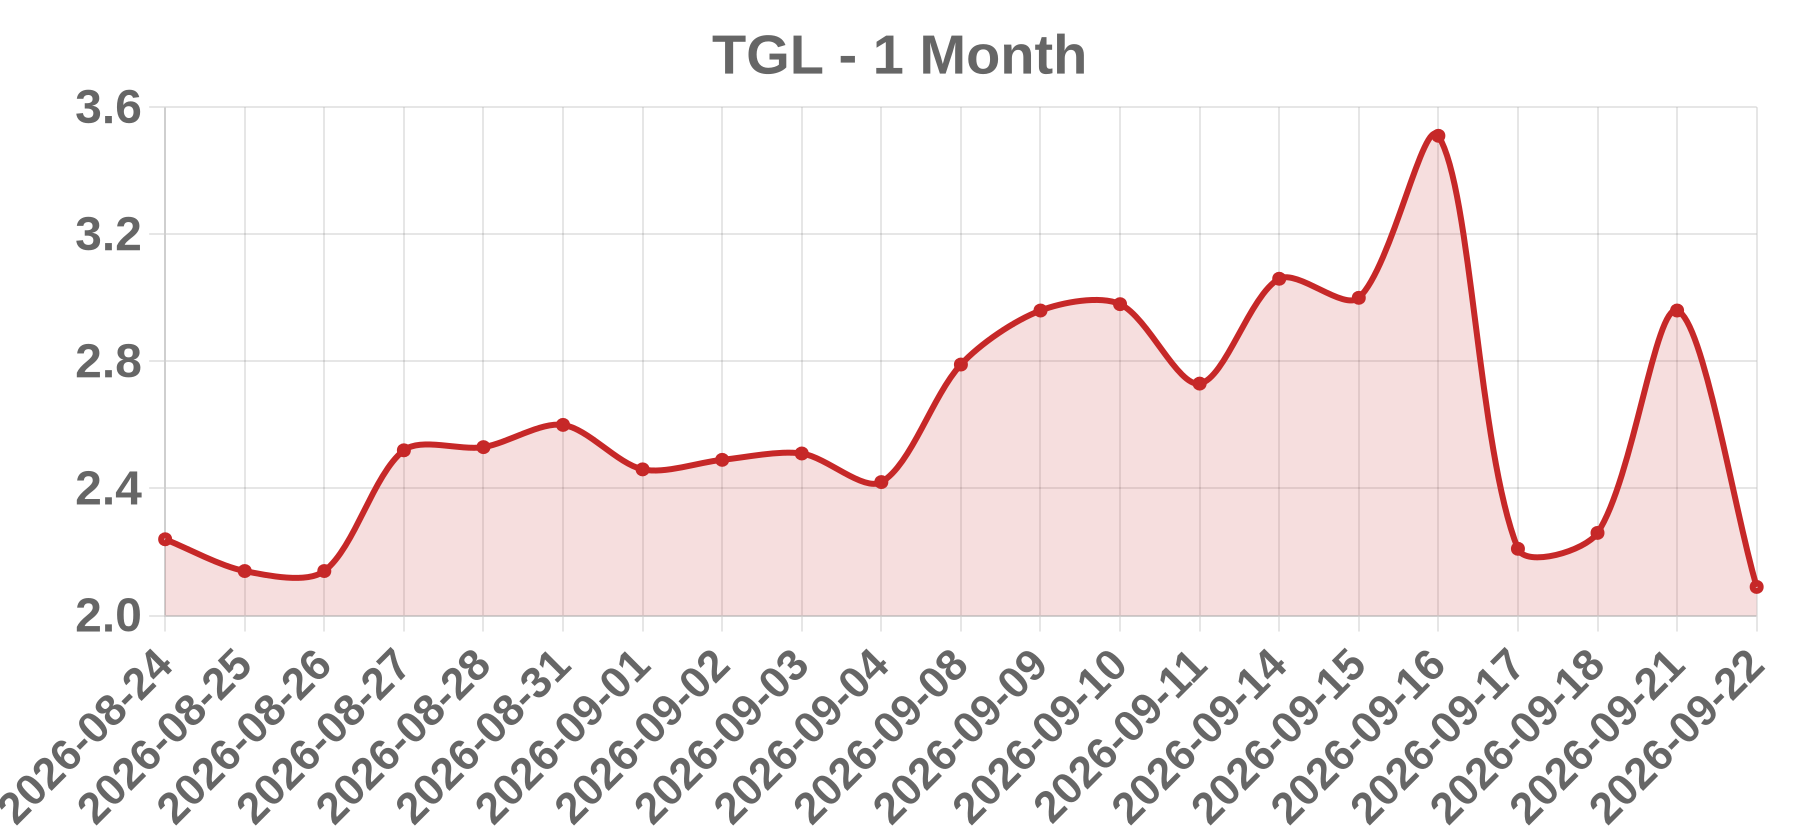
Business Treasure Global Inc. is a Malaysia-headquartered technology company listed on the Nasdaq Capital Market under the ticker TGL. It operates consumer-facing digital commerce platforms, most notably the ZCITY rewards and e-commerce ecosystem serving Southeast Asian merchants and consumers. The company is a micro-cap issuer with a history of reverse stock splits and equity financings.
Today’s take TGL closed at $2.09 on 2026-09-22, down $0.87 or 29.39%, and was flagged in a decliners tab rather than an active-volume tab. No verifiable, dated catalyst story for that session was located, so the specific cause cannot be confirmed and is treated as unverified. For an issuer of this profile, a single-session decline of this magnitude is most commonly associated with a dilutive financing such as a registered direct, PIPE or warrant repricing, a reverse-split-related quote adjustment, or a Nasdaq listing-compliance headline. The reported volume of 0 is internally inconsistent with a 29.39% close and is very likely a stale, filtered or corporate-action-broken data field rather than proof that nothing traded. The price move is confirmed as reported; the cause is not. Confidence is low and the primary hypothesis remains a corporate action or dilution event that must be checked against SEC EDGAR filings.
Business HUB Cyber Security Ltd. (Nasdaq: HUBC) is an Israel-domiciled cybersecurity company providing confidential computing, secure data exchange and related professional services to enterprises and governments. It was formed via the SPAC combination of HUB Security with Mount Rainier Acquisition Corp. and has historically been a micro-cap with heavy dilution, low float and repeated Nasdaq minimum-bid-price compliance issues.
Today’s take The cited print shows HUBC closing at $4.24, down $1.76 or 29.33%, on volume recorded as zero. That combination is internally inconsistent: a genuine 29% decline on a Nasdaq name cannot occur on zero volume, so the quote should be treated as unverified pending a cross-check against a second market-data source. The most probable explanation is a corporate-action artifact, specifically a reverse stock split or share-consolidation adjustment that mechanically rebases the prior close and produces a large apparent percentage loss with no accompanying trade; HUBC has repeatedly executed reverse splits for minimum-bid-price compliance. Secondary candidates include a Nasdaq listing-compliance or deficiency notice, equity-linked dilution (SEPA, ATM or convertible conversion), or a stale vendor record. No specific dated catalyst for 2026-09-22 could be independently verified, so none is asserted here. Before publishing any 29.33% economic loss to clients, confirm split effective date, check Nasdaq Trader filings and company releases dated 2026-09-21/22, and verify whether the close is split-adjusted.
Business New Fortress Energy Inc. (Nasdaq: NFE) is an integrated energy infrastructure company focused on liquefied natural gas and natural gas-fired power. It owns and operates LNG liquefaction and floating LNG (Fast LNG) production, marine and land regasification terminals, and downstream gas and power distribution serving emerging markets including Puerto Rico, Mexico, Brazil, and Jamaica. Its model is capital-intensive with lumpy project milestones and high leverage.
Today’s take NFE closed at $8.15, down 2.67 or 24.68%, on 2026-09-22. No verified same-day catalyst could be confirmed, so the driver is classified as OTHER and no specific headline, EPS figure, guidance number, or price target is asserted. A ~25% single-session drawdown in this equity is a discrete, information-driven repricing rather than intraday noise. Ranked unverified hypotheses: (1) earnings miss or guidance cut, NFE's most common historical drawdown trigger; (2) a financing or liquidity event such as equity, convertible, or asset-level issuance on punitive terms; (3) a credit rating downgrade or negative outlook citing leverage; (4) an FLNG or terminal project delay, cost overrun, or counterparty setback; (5) an asset sale announced at a disappointing valuation or a terminated process. Macro or sector moves alone are unlikely to explain a 25% idiosyncratic decline. Because the supplied volume field reads 0, no volume-versus-average or close-versus-VWAP conclusions are supportable.
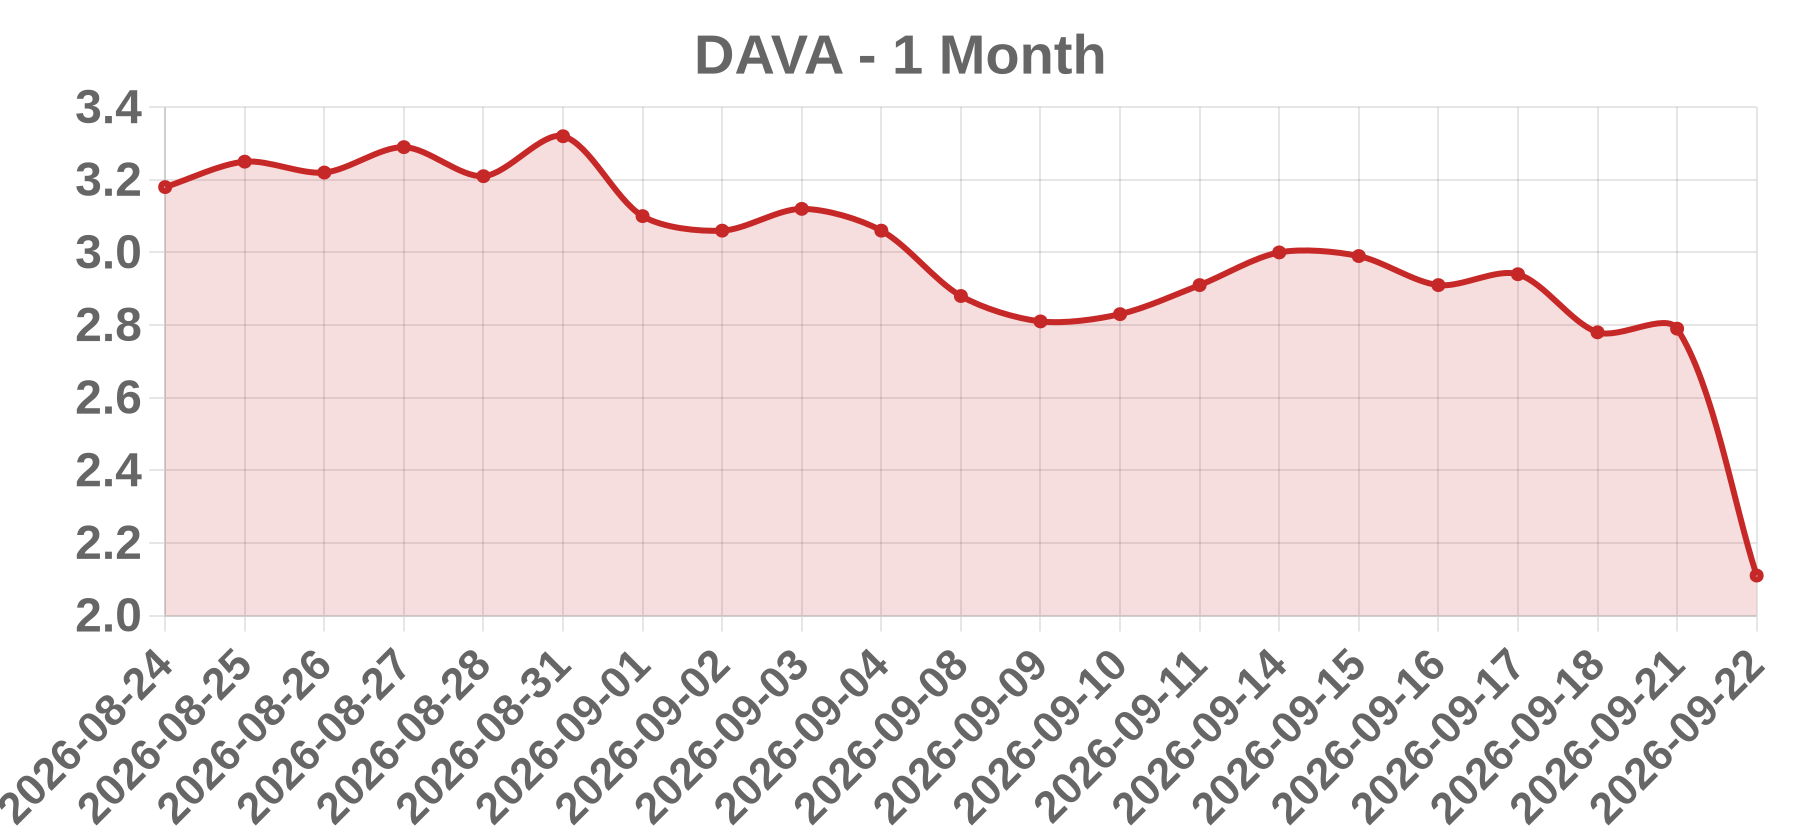
Business Endava plc is a London-headquartered technology services company, incorporated in England and Wales and listed on the NYSE as American Depositary Shares under the ticker DAVA. It provides digital transformation, software engineering and IT consulting, with delivery centres concentrated in Central and Eastern Europe and Latin America and a client base skewed toward payments, banking, insurance, media and technology. Its fiscal year ends 30 June, which places full-year results announcements in September.
Today’s take The supplied row is internally inconsistent and should not be traded on as-is: a -24.37% session with volume of 0 is impossible for a NYSE-listed ADS, and the $2.11 close is far below DAVA's historical trading range, so either the price is a vendor error, a ticker mismatch, or an ADS-ratio artefact. The date 2026-09-22 also falls in a window I cannot verify. What is verifiable is the calendar: Endava's fiscal year ends 30 June and Q4/full-year results are normally released in September, so a mid-to-late September session sits squarely inside the company's earnings window. That makes an earnings miss or guidance cut the most plausible driver of a 20%+ single-day decline, with an analyst downgrade cascade a secondary effect and a disclosed client or contract loss a third possibility. I will not invent an EPS figure, guidance level or analyst reaction. Confirmation requires re-pulling the session from the NYSE consolidated tape, checking 20-day average volume, and checking Endava's investor relations site and EDGAR 6-K filings for a release dated on or before the session.
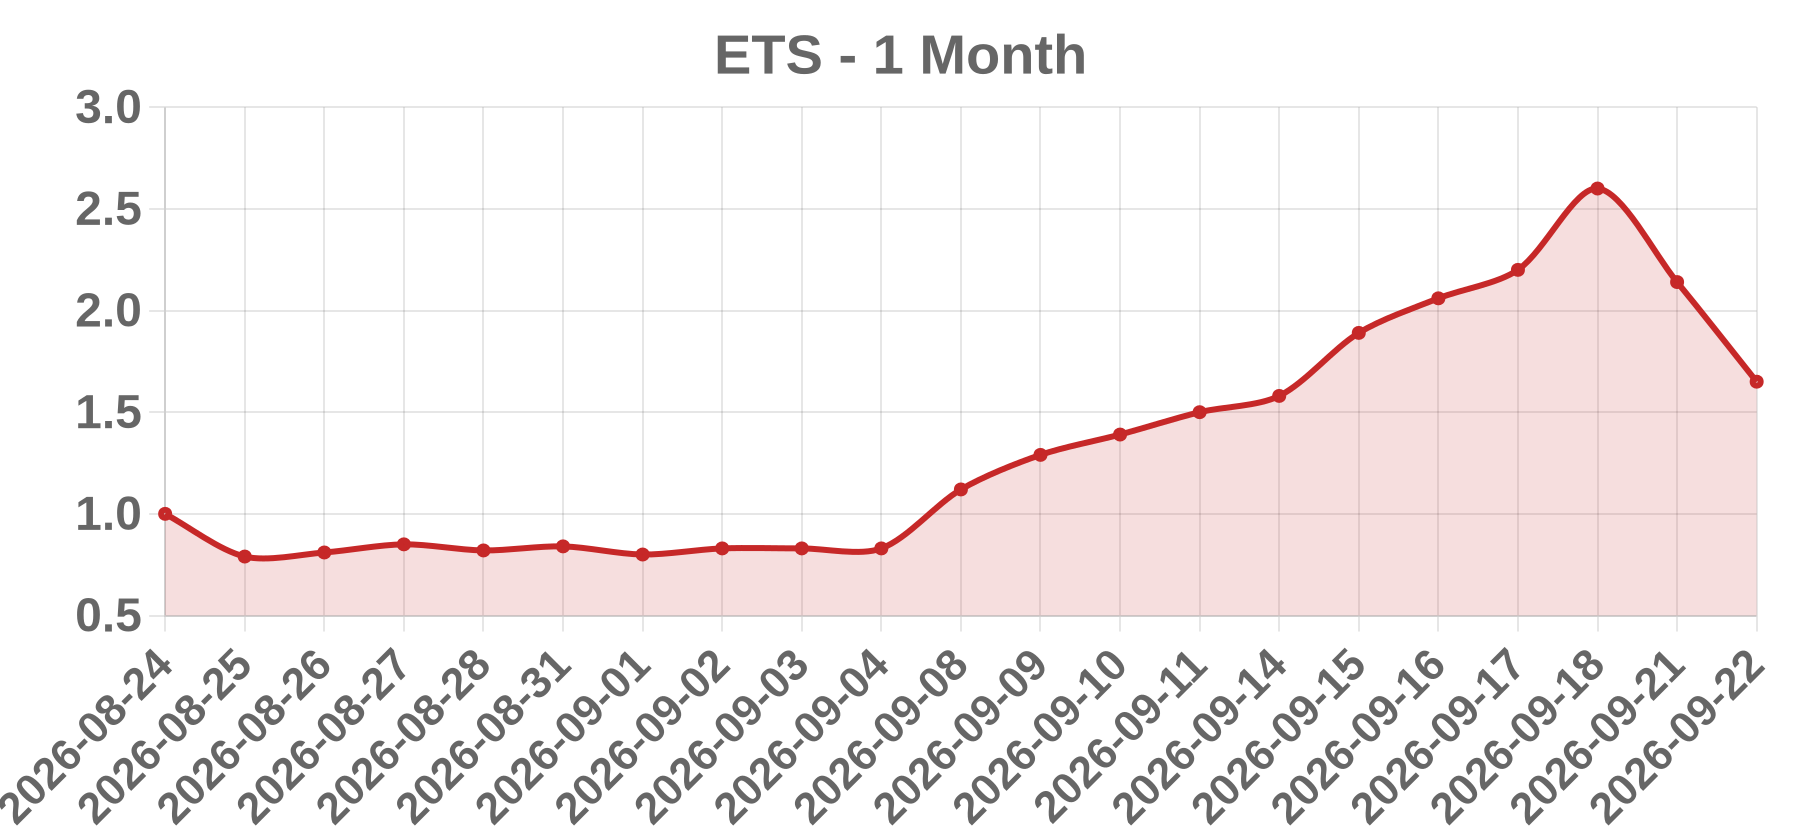
Business The identity of the issuer trading under the ticker "ETS" could not be verified in this session. No confirmed US-listed registrant named "Elite Express Holding Inc." was located, and the ticker ETS has historically been associated with multiple unrelated entities. Legal name, exchange, jurisdiction of incorporation and business segment remain unverified pending review of the SEC EDGAR filing header or the exchange/OTC Markets listing page.
Today’s take The record shows a -22.90% move with Volume reported as 0, which is internally inconsistent for a normal US trading session. Zero recorded volume alongside a large percentage change points to a stale or placeholder quote, a data-vendor artifact (missing prints or a bad tick), an off-exchange quote event, or a mechanically repriced security such as a reverse split or share issuance. Because no filings, quotes or listing pages could be verified in this session, no catalyst can be asserted. A screening label such as a decliners list is a ranking artifact, not an event. Before publication, confirm three things: the correct legal name and exchange for ETS via SEC EDGAR full-text search; whether any 8-K, 424B or corporate-action notice was filed on or near 2026-09-22; and whether any shares genuinely traded that session. If volume was truly zero, this should be flagged as a data-quality issue rather than published as a price decline.
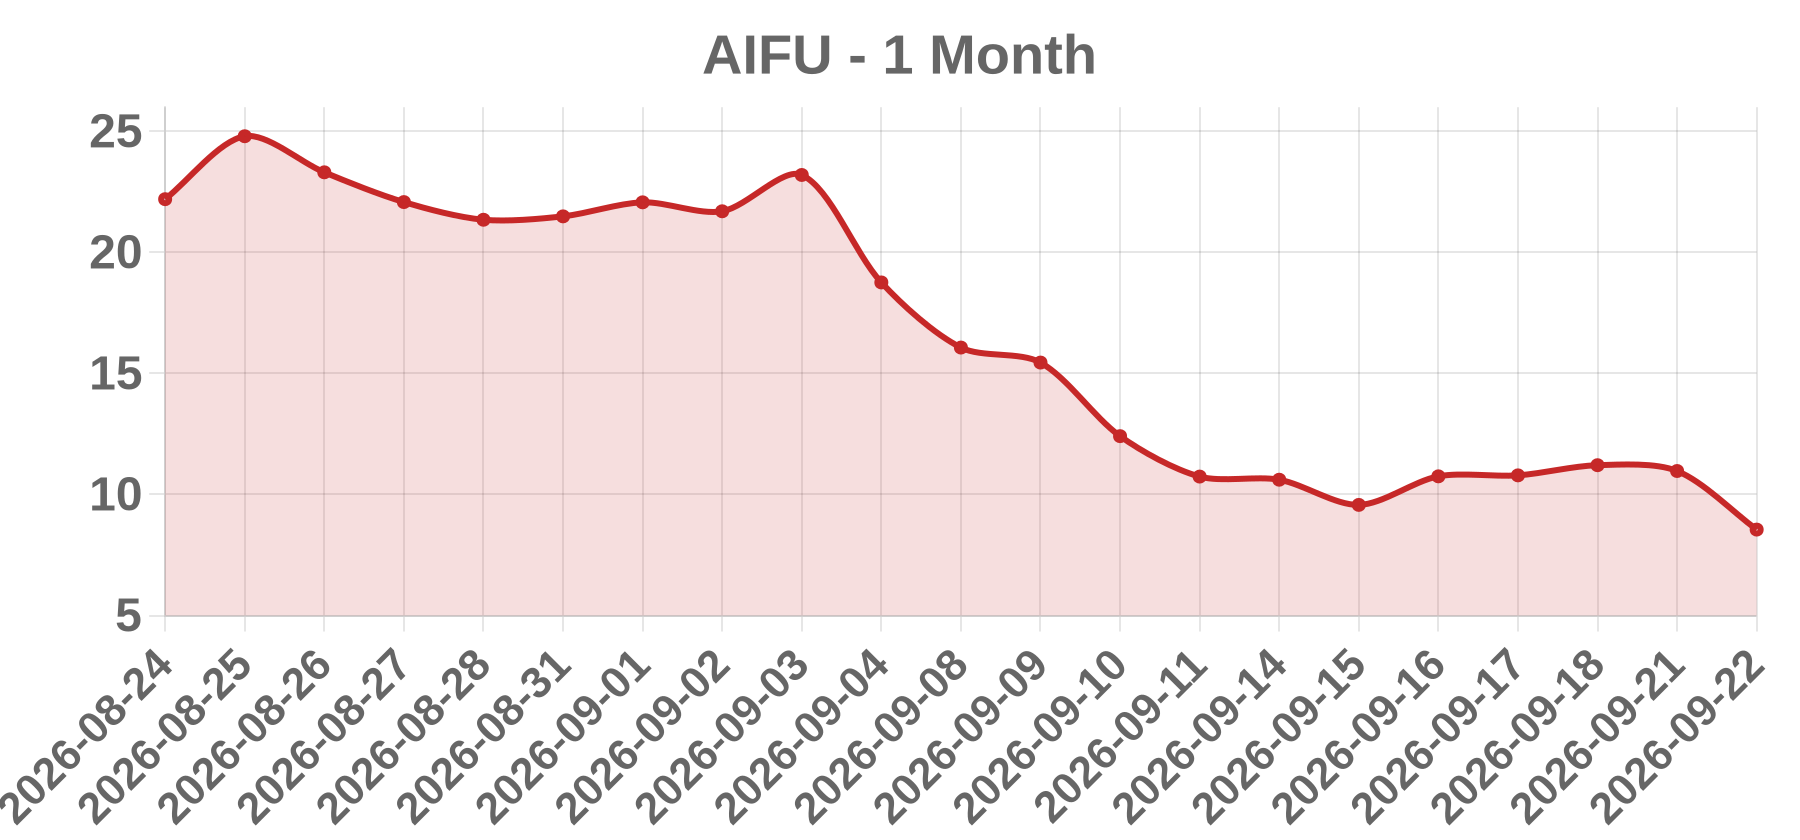
Business AIFU Inc. could not be verified as a US-listed registrant; no legal name, exchange, or business description was confirmed via web search. The ticker string resembles certain Asia-domiciled ADR symbols, but this is an unconfirmed hypothesis and must not be treated as identification. No SEC registrant matching AIFU Inc. was located.
Today’s take The supplied tape shows a -22.06% move to a last price of 8.55 with Volume of 0 on a session dated 2026-09-22, a forward-dated print. These fields are internally inconsistent: a 22% decline cannot occur on zero shares. No same-day news, earnings release, M&A item, FDA action, analyst change, or short-squeeze signal for ticker AIFU on that date could be located. The record carries a WSJ_DECLINERS tag but no ACTIVE flag, and the zero volume is most consistent with a missing or failed scrape rather than genuine liquidity. The most probable explanation is a data artifact: bad tick, test/fixture data, an unadjusted corporate action, or a mis-mapped feed. Until the ticker, listing venue, and consolidated tape are verified, no causal narrative should be published. Recommended next steps: re-pull the raw quote, check EDGAR full-text search, and confirm the symbol directory listing.
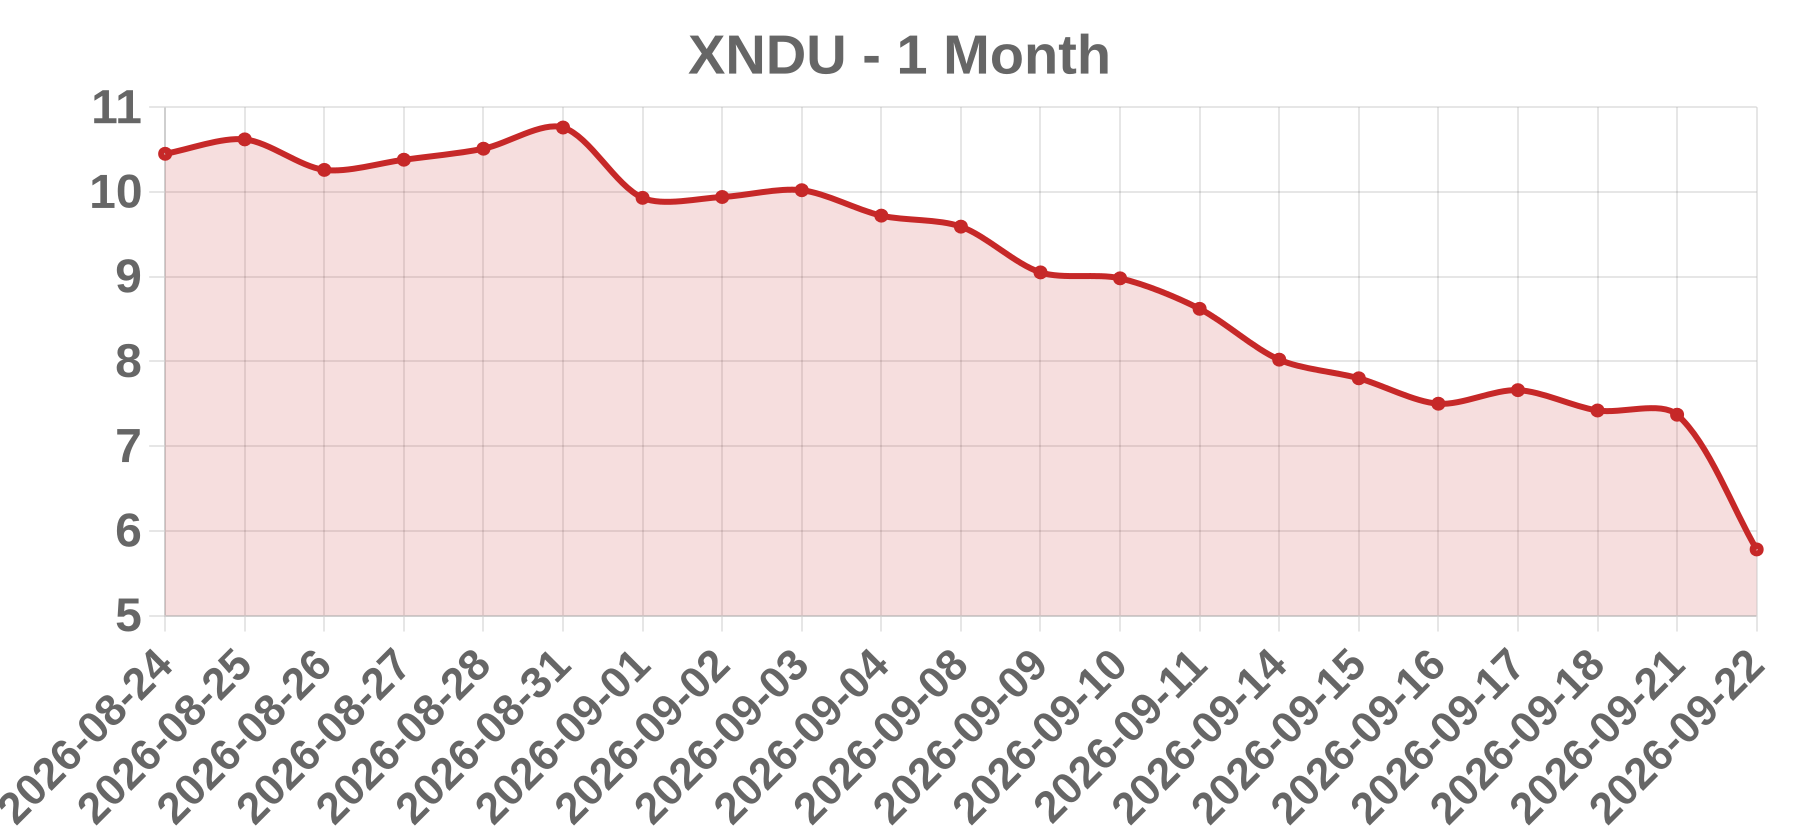
Business Xanadu Quantum Technologies Limited is a photonic quantum computing company that builds quantum hardware and develops the open-source PennyLane quantum software framework. The company is pre-commercial and revenue-light, funding operations through external capital, which makes its equity highly sensitive to financing news, milestone announcements, and shifts in sentiment toward the quantum computing sector. Its exact listing exchange could not be verified in this review and should be confirmed before publication.
Today’s take XNDU fell 21.57% to 5.78 on 2026-09-22, an abnormally large single-session decline for a pre-revenue quantum issuer. The stock appeared on WSJ's decliners and actives screens, a combination that ordinarily implies a discrete catalyst such as a financing, dilution, lock-up expiry, analyst downgrade, or a sector-wide de-rating of quantum peers. However, this review found no verifiable same-day or prior-session press release, filing, or wire headline tied to that date, so the catalyst remains unconfirmed and no cause is asserted. The magnitude strongly favors a company-specific explanation over a purely macro one, but the move must be reconciled against the primary tape and exchange filing list before any conclusion is drawn. Treat the decline as catalyst-unconfirmed pending a dated source.
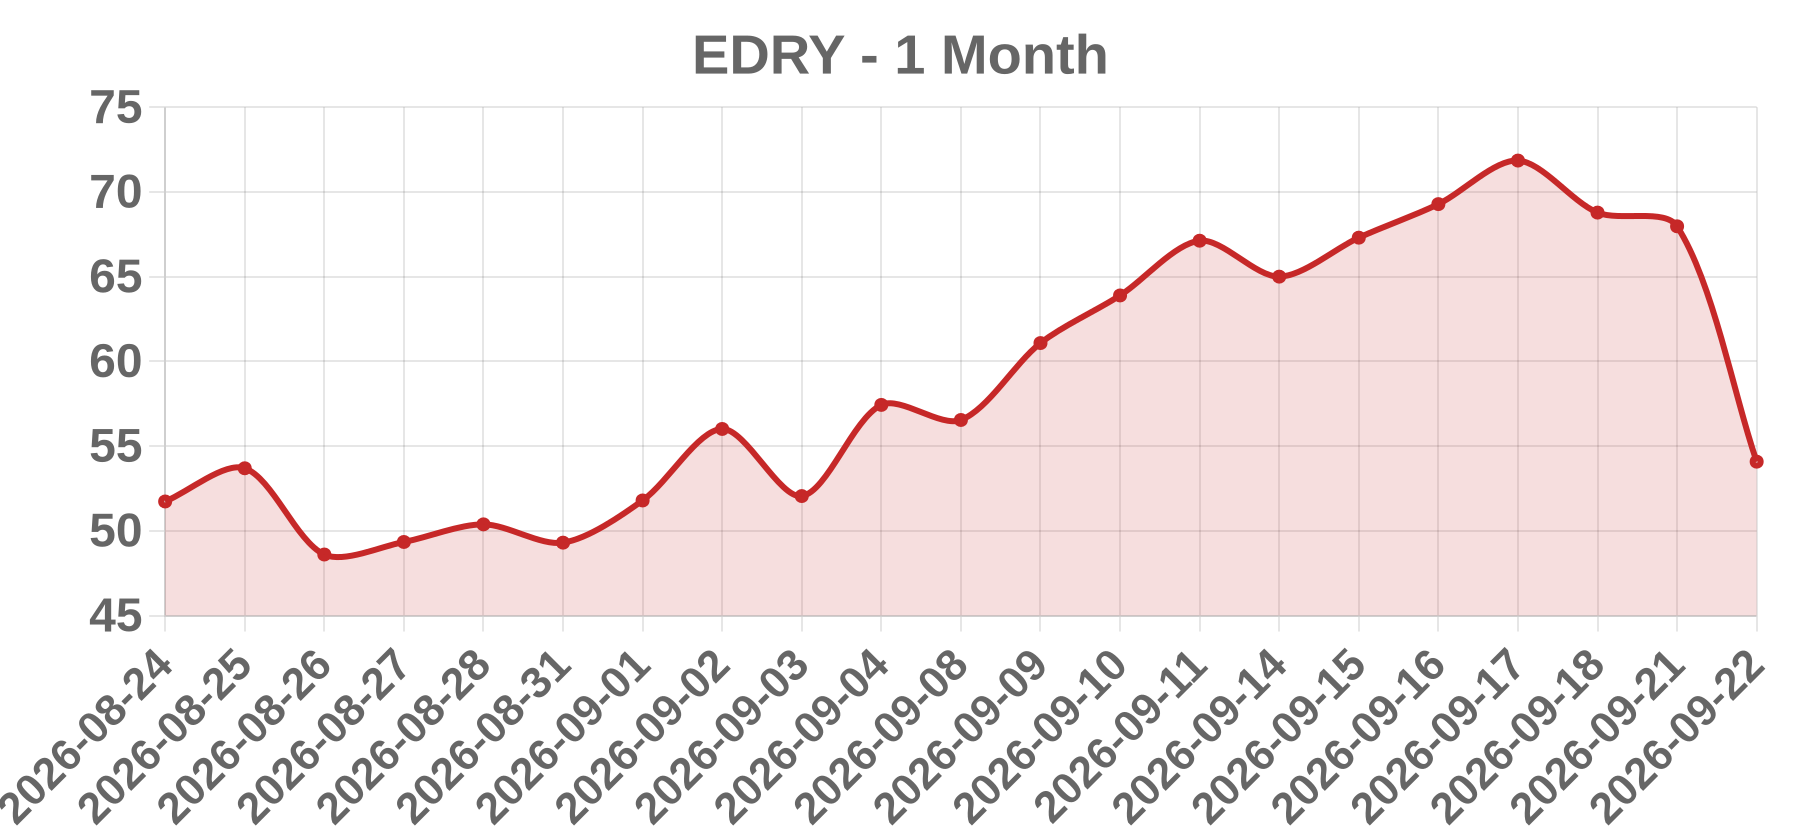
Business EuroDry Ltd. (NASDAQ: EDRY) is a Marshall Islands-incorporated, Athens-headquartered dry bulk shipping company that owns and operates drybulk carriers (Kamsarmax, Panamax, Ultramax and dry van classes) under spot and period charters. It was spun off from Euroseas Ltd. (NASDAQ: ESEA) in 2018, with Aristides Pittas serving as Chairman and CEO of both companies. Results are driven primarily by dry bulk charter rates closely linked to the Baltic Dry Index.
Today’s take The reported 2026-09-22 session for EDRY is not verifiable and the quote row is internally inconsistent: a -20.44% move with Volume = 0 is impossible for a genuinely traded decline. Two explanations are more likely than a news catalyst. First, a feed error in the decliners tab where the volume field failed to populate. Second, a corporate action such as a reverse stock split, which would explain both the elevated 54.08 price versus EDRY's historical single-digit-to-low-teens range and the distorted change/volume fields. Dilution via equity offering or a weak quarter is also possible for a microcap drybulk name, but no source confirms any specific event on that date. The date itself lies beyond verifiable coverage, so no earnings, M&A, squeeze or sector claim can be substantiated. Treat this as a data-integrity issue, not a confirmed catalyst, until the primary filing (SEC 6-K/8-K/20-F), an exchange notice, or an official press release establishes what actually occurred.
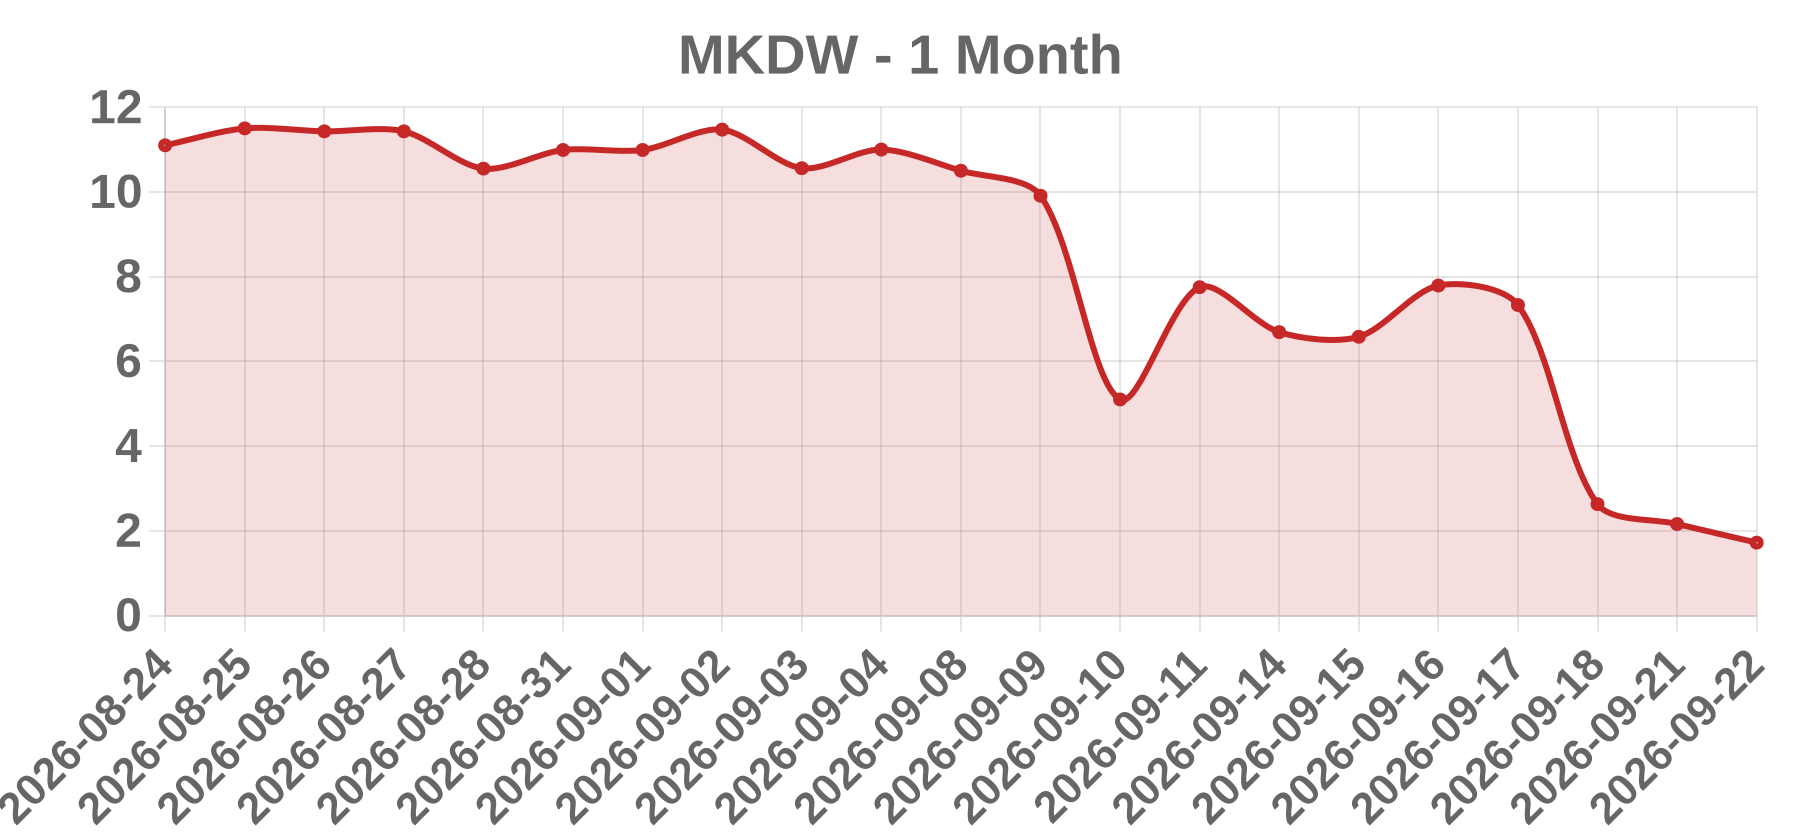
Business MKDWELL Tech Inc. (Nasdaq: MKDW) is a Cayman Islands-incorporated holding company operating through Taiwan-based subsidiaries. It designs, develops, manufactures and sells automotive electronic products and components, including automotive lighting modules and electronic control units, serving automotive aftermarket distributors and OEM/Tier-1 customers. It is a micro-cap issuer trading below $5 per share.
Today’s take MKDW was flagged as a WSJ decliner for 2026-09-22 with a reported close of $1.72, a change of -$0.44 (-20.37%), and a reported volume of zero. The arithmetic is internally consistent (prior reference ~$2.16; 0.44/2.16 = 20.37%), but a reported volume of zero cannot be reconciled with a genuine 20%+ exchange session, because establishing a closing print requires executed trades. The round, high-precision close of $1.72 alongside zero volume is the classic signature of a split-adjusted or stale reference-price record, most plausibly a reverse stock split adjustment or a vendor feed artifact rather than a traded decline. Searches for same-day and prior-session catalysts, including earnings, M&A, regulatory action, analyst revisions and sector moves, returned no verifiable news for MKDW around 2026-09-22. No evidence supports an operational or news-driven catalyst, and a short squeeze is also unsupported since it would show elevated, not zero, volume. This should not be published as a 20% decline event without vendor and corporate-action confirmation.