US common stocks / ADRs: top 10 by volume; top 10 gainers (by % change, volume as tie-breaker); top 10 losers (by % change, prefer liquid names). Deep notes cover the de-duplicated set across the three boards.
30 names on this page · volume 10 · gainers 10 · losers 10
Order: volume board → gainers → losers; each ticker appears once. Summaries of public information only — please verify primary sources.
1/10INTC INTC
+7.67%
Close 108.80 · Vol 147.99M · Type: Other
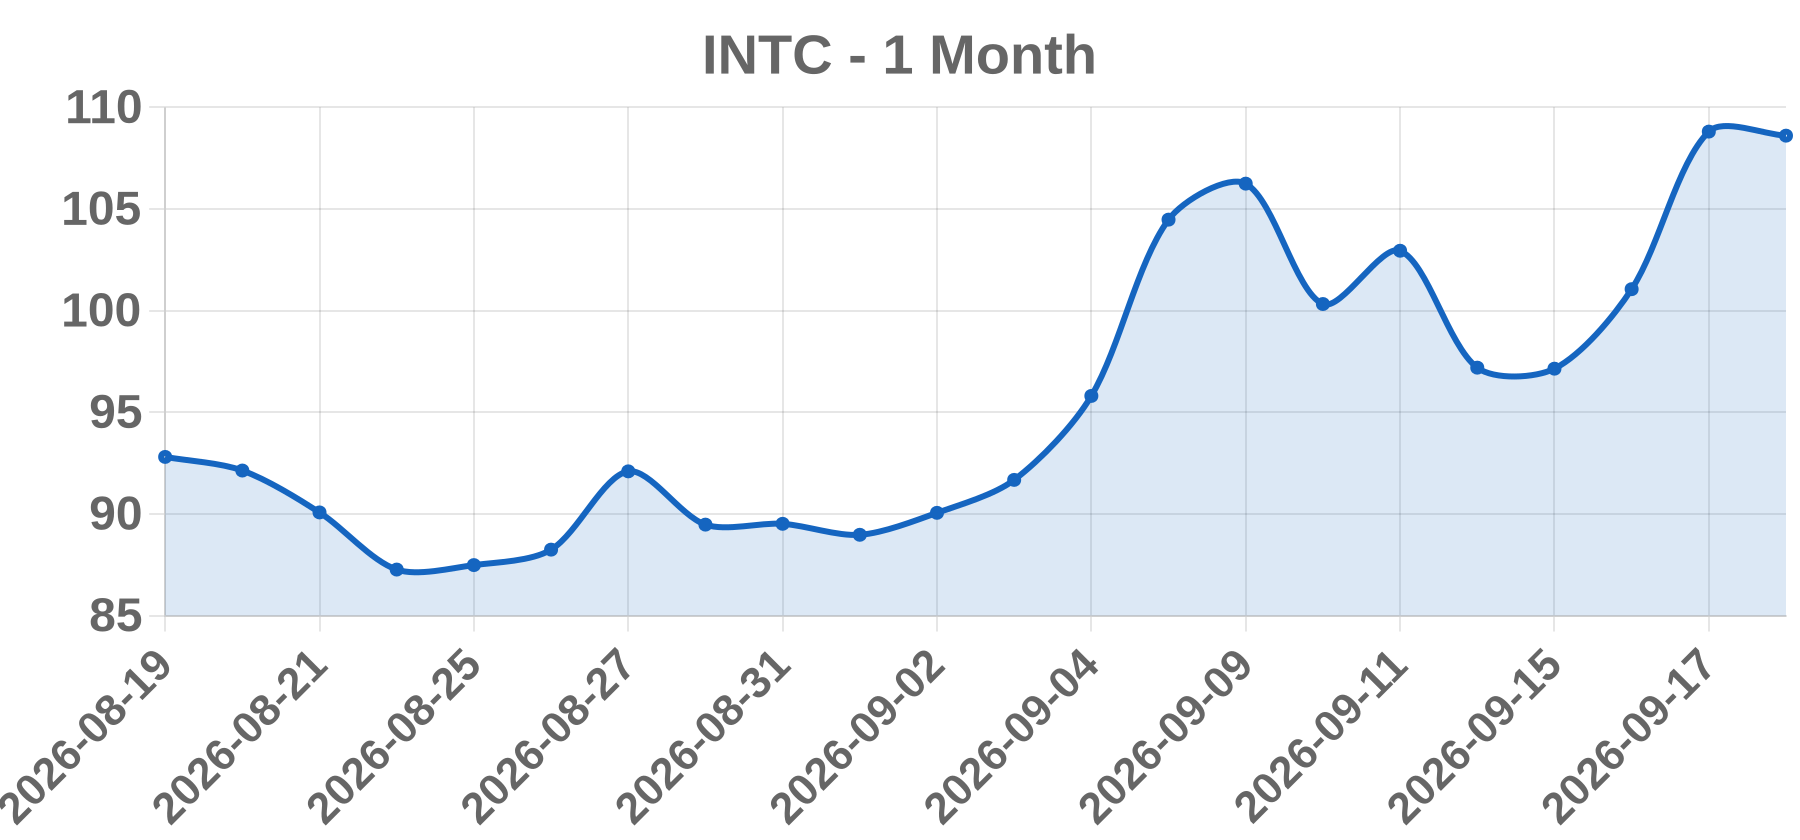
Approx. 1-month price (illustrative)
Business Intel Corporation is a semiconductor company listed on the NASDAQ Global Select Market under the ticker INTC. It designs and manufactures client computing CPUs, data center and AI processors, networking and memory products, and also operates Intel Foundry, a contract chip-manufacturing business. It is one of the few remaining vertically integrated semiconductor firms combining design, in-house fabrication, and advanced packaging.
Today’s take INTC closed at 108.80 on 2026-09-18, up 7.75 points or +7.67%, on roughly 148.0 million shares. A single-session gain of this magnitude on heavy volume is the classic footprint of an event-driven repricing rather than ordinary drift, since moves of this size usually require a hard catalyst such as earnings or guidance, M&A, a foundry or major customer deal, an analyst action, a government or strategic investment headline, or a crowded-short squeeze. However, no verifiable same-day or prior-session news source for 2026-09-18 was retrievable, so this report does not name a specific catalyst. The move is therefore classified as OTHER pending confirmation. Confirmation should come from Intel Investor Relations press releases, an SEC Form 8-K filed on or near that date, or exchange trading data cross-checked against Yahoo Finance historical prices.
Business Nokia Oyj (Nokia Corporation) is a Finnish network infrastructure and mobile networks equipment company domiciled in Espoo, Finland. It lists on Nasdaq Helsinki (NOKIA) and on the NYSE under the ADR ticker NOK. Its segments span Network Infrastructure (including optical and IP networking, materially expanded by the 2024 Infinera acquisition), Mobile Networks (RAN), Cloud and Network Services, and Nokia Technologies patent licensing.
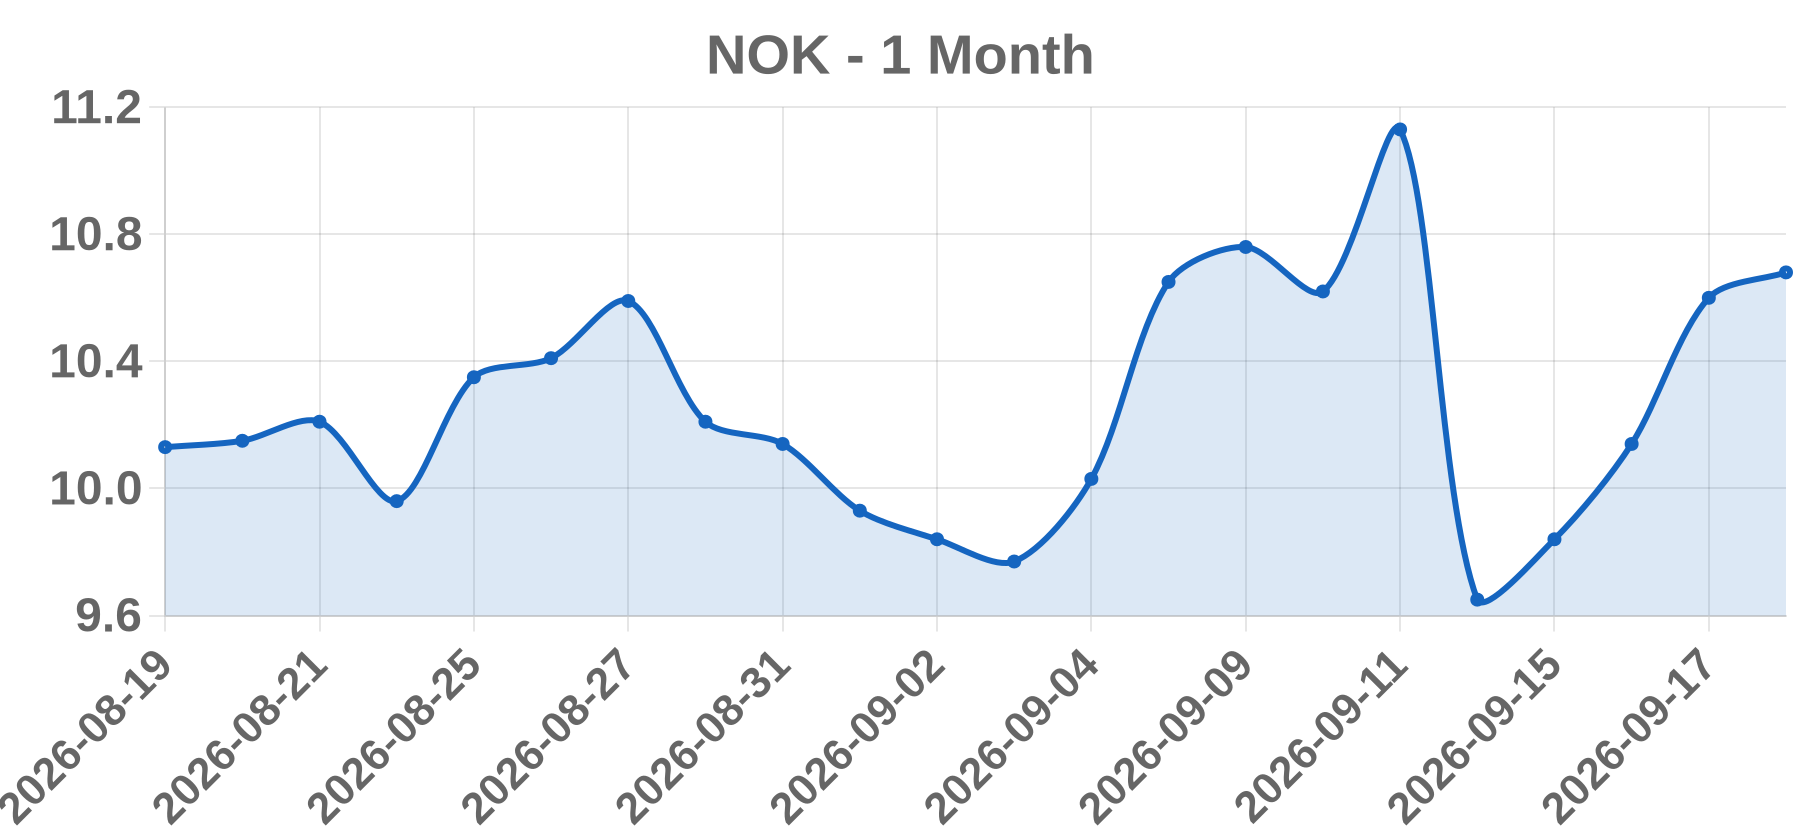
Today’s take No verifiable 2026-09-18 company-specific news was retrievable, so this move should be treated as a sector/sympathy or flow-driven event rather than a confirmed fundamental catalyst. NOK added +4.54% to close at 10.60 on roughly 136.65M shares, an unusually heavy tape for the US ADR, which typically trades in the tens of millions of shares. Two structural explanations rank first. First, 2026-09-18 was the third Friday of September, a quarterly triple/quadruple witching expiration that routinely produces 1.5-3x normal volume in large-cap names with active options chains. Second, Nokia has become a high-beta proxy for AI, optical, and data-center interconnect sentiment post-Infinera, so a strong print or guidance raise from an optical/DCI or AI-infrastructure peer can lift NOK several percent on read-across. A broker upgrade or a contract headline is possible but unconfirmed. No earnings release, M&A announcement, or analyst action for that date was found, and none is fabricated here.
Business NVIDIA Corporation is a fabless semiconductor designer listed on the Nasdaq Global Select Market under the ticker NVDA, headquartered in Santa Clara, California. Its core Data Center segment supplies GPUs, NVLink and networking silicon, and DGX/HGX systems for AI training and inference, alongside Gaming (GeForce RTX), Professional Visualization, Automotive (DRIVE), and OEM segments.
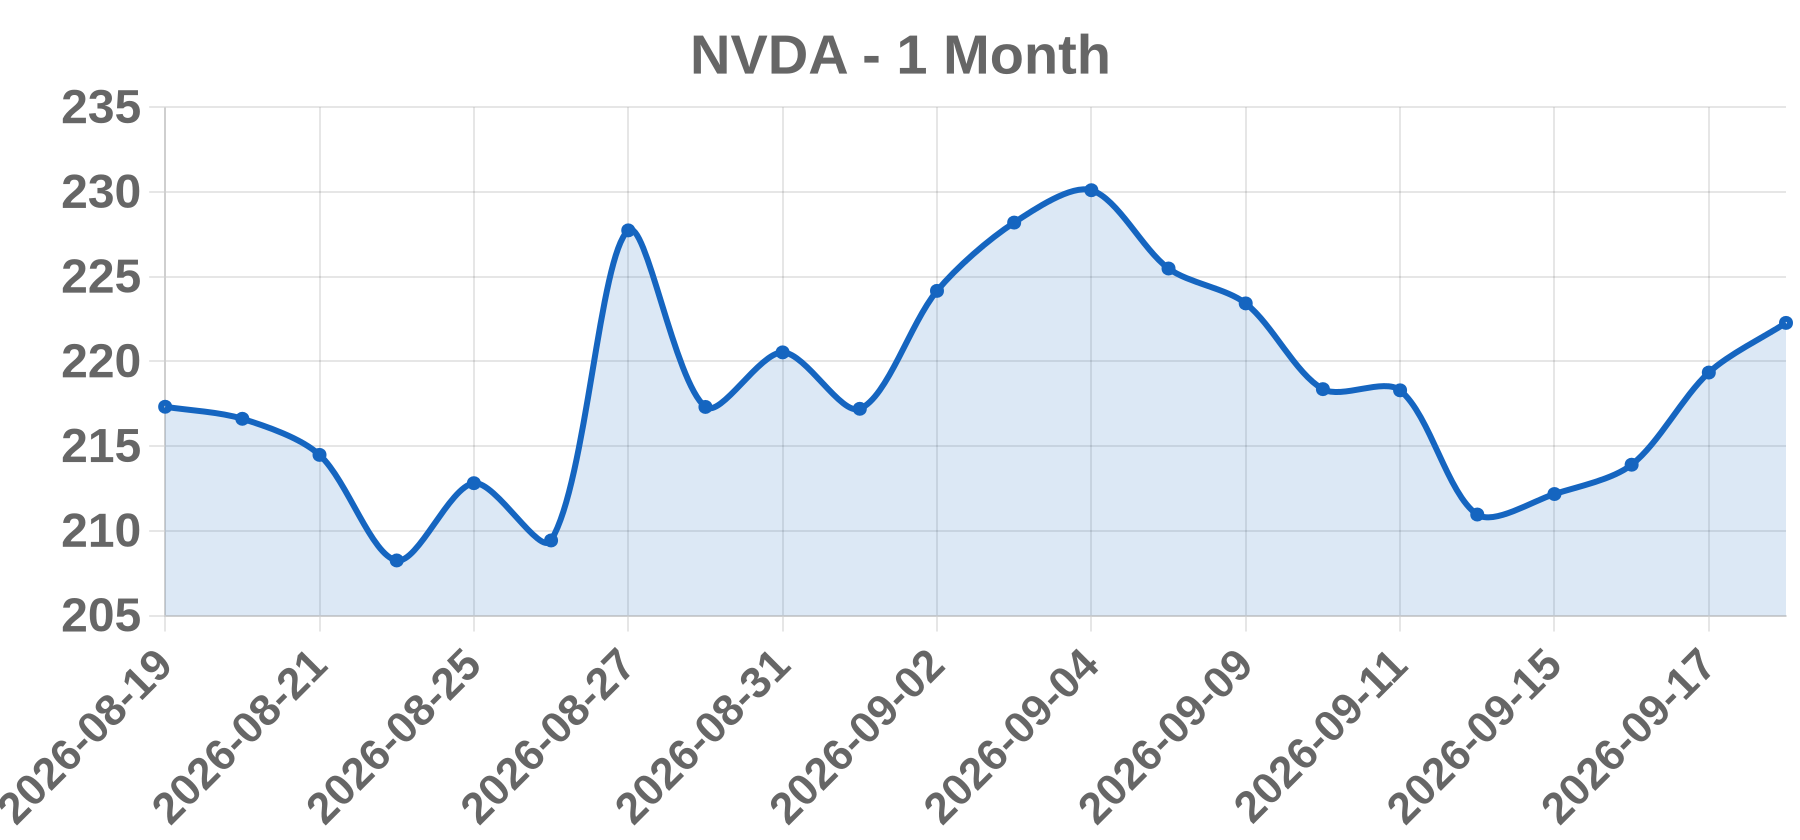
Today’s take NVDA closed at 219.34, up 5.43 or +2.54%, on roughly 92.87 million shares in the 2026-09-18 session. No company-specific filing, earnings release, or analyst action was verified for this date, and NVDA's fiscal calendar rules out a September report (fiscal Q2 lands in late August, fiscal Q3 in mid-to-late November). The move is therefore best classified as SECTOR-driven: a beta-heavy, index-dominant AI semiconductor name trading up on a broad risk-on session in the SOX/SMH complex and Nasdaq-100. A 2.5% single-session gain is meaningful but well short of the 5-15% gaps NVDA typically prints on idiosyncratic shocks, which supports a sentiment-and-flow explanation rather than a company event. The date also falls on the third Friday of September, a quadruple witching expiry, which mechanically inflates market-wide volume and can exaggerate close-to-close moves through futures and options roll and gamma positioning. Confirmation would require same-day moves in AMD, AVGO, TSMC ADR, and SOX/SMH, plus any pre-market wire headline or 8-K.
Business Nu Holdings Ltd. is a Cayman-incorporated holding company that operates Nubank, a digital-first consumer financial services platform listed on the NYSE under the ticker NU. It offers no-fee credit cards, deposit accounts, personal lending, investments, and insurance, primarily in Brazil with growing operations in Mexico and Colombia.
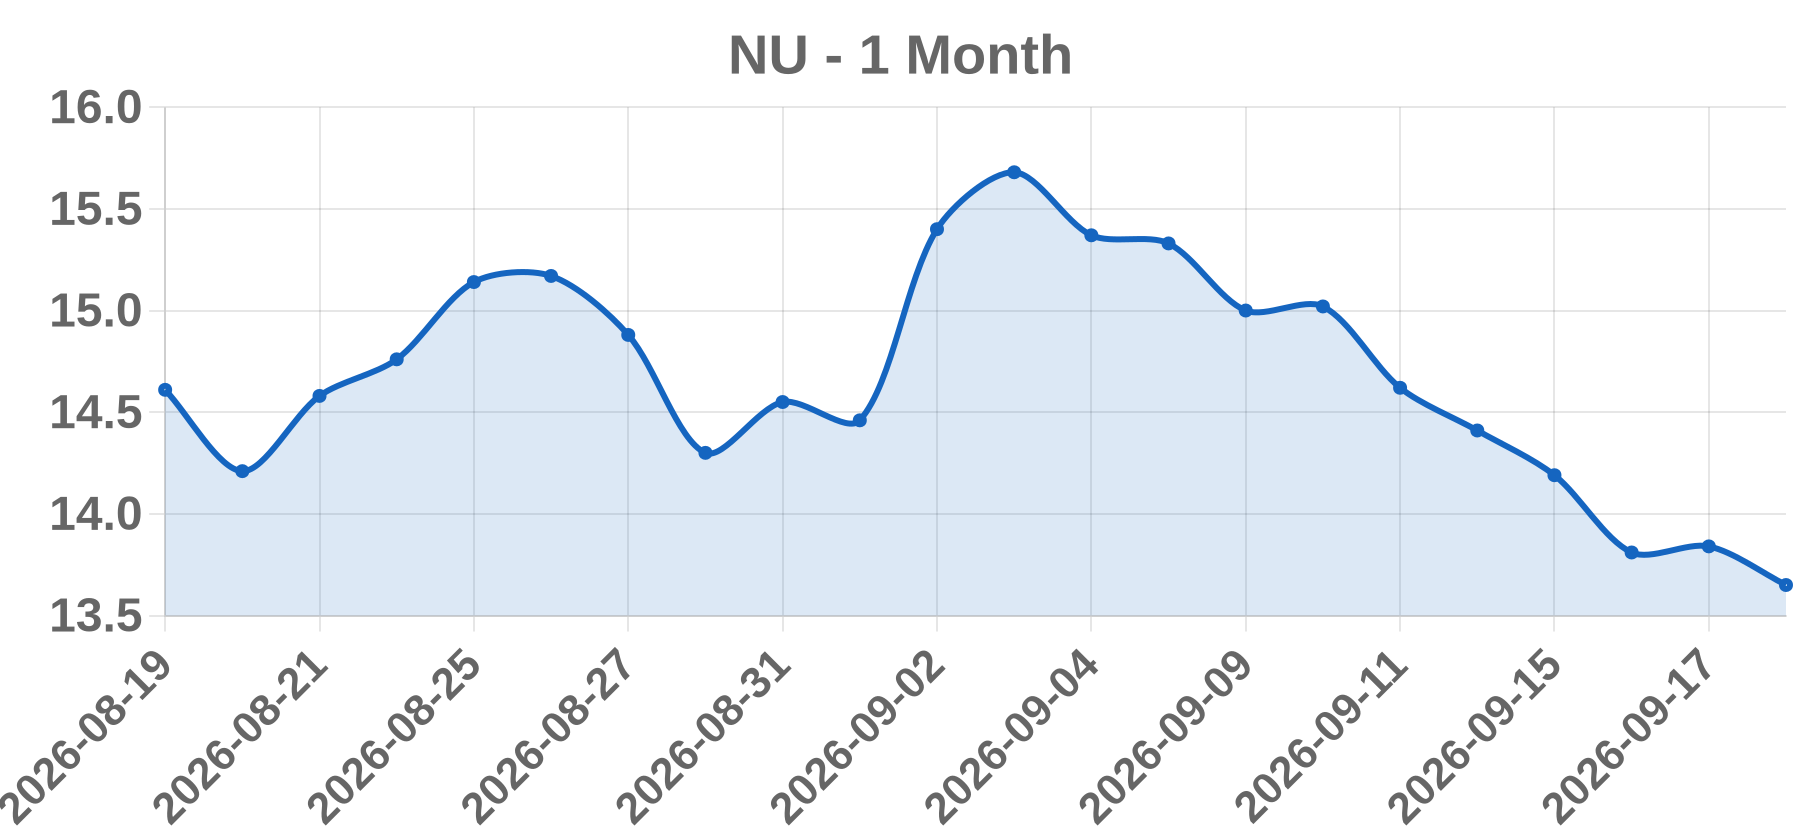
Today’s take NU closed at 13.84 on 2026-09-18, up 0.03 or 0.22%, on 90,710,000 shares, placing it on the WSJ most-active screen. The combination of a statistically flat price move and elevated absolute share volume is inconsistent with a fundamental company-specific catalyst such as earnings, guidance, or M&A, which typically produce multi-percent moves. It is more consistent with mechanical or flow-driven activity, plausibly index rebalancing, ADR creation/redemption, or options and futures expiry around the third Friday of September. The ACTIVES tab qualifies NU by volume, not by newsworthiness. Two caveats matter: the session date is forward-looking relative to available research, and average daily volume was not supplied. Before publishing any catalyst claim, an analyst must pull NU's 30-day or 65-day average volume to quantify relative volume, check Nu Holdings IR and SEC EDGAR for same-day or prior-session 6-K disclosures, and check the index and expiry calendar.
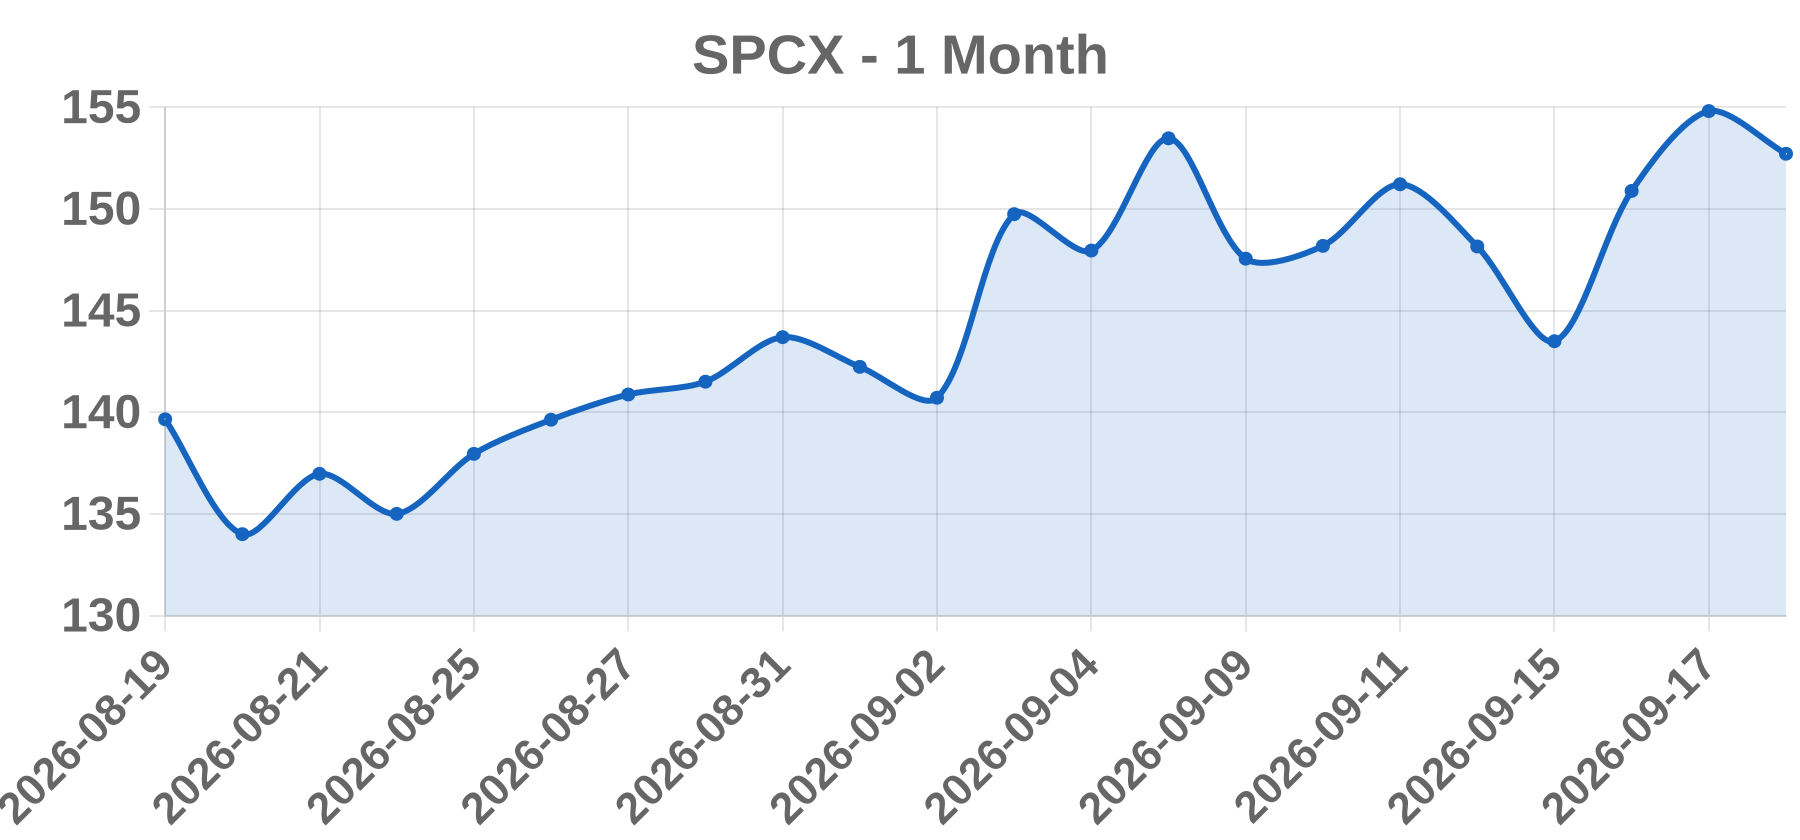
Business The ticker SPCX has no verified exchange listing tied to Space Exploration Technologies Corp. (SpaceX), which is a privately held company and has never registered common equity for public trading. A record showing a $154.81 close on 2026-09-18 with 83,450,000 shares traded therefore cannot be reconciled with SpaceX itself and must be treated as an unverified or mis-mapped data point until a CUSIP/ISIN and legal issuer name are confirmed.
Today’s take This record cannot support a catalyst attribution. SpaceX is private, with no exchange-listed common stock, no public ticker, and no defined average daily volume, so a single-session print of 83,450,000 shares is inconsistent with the named entity. The date 2026-09-18 also falls outside verifiable reporting, meaning no headline, filing, or analyst action can be confirmed for that session. Possible explanations include a mock or backtest placeholder, a SPAC, ETF, or foreign vehicle using similar branding, a secondary-market or tender-offer print, or a tokenized pre-IPO proxy. Until the security's CUSIP/ISIN and legal issuer are reconciled against an exchange or symbol lookup, no EARNINGS, M&A, UPGRADE, FDA, or SHORT_SQUEEZE label is defensible. Recommend holding the note and re-running symbol verification before any publication.
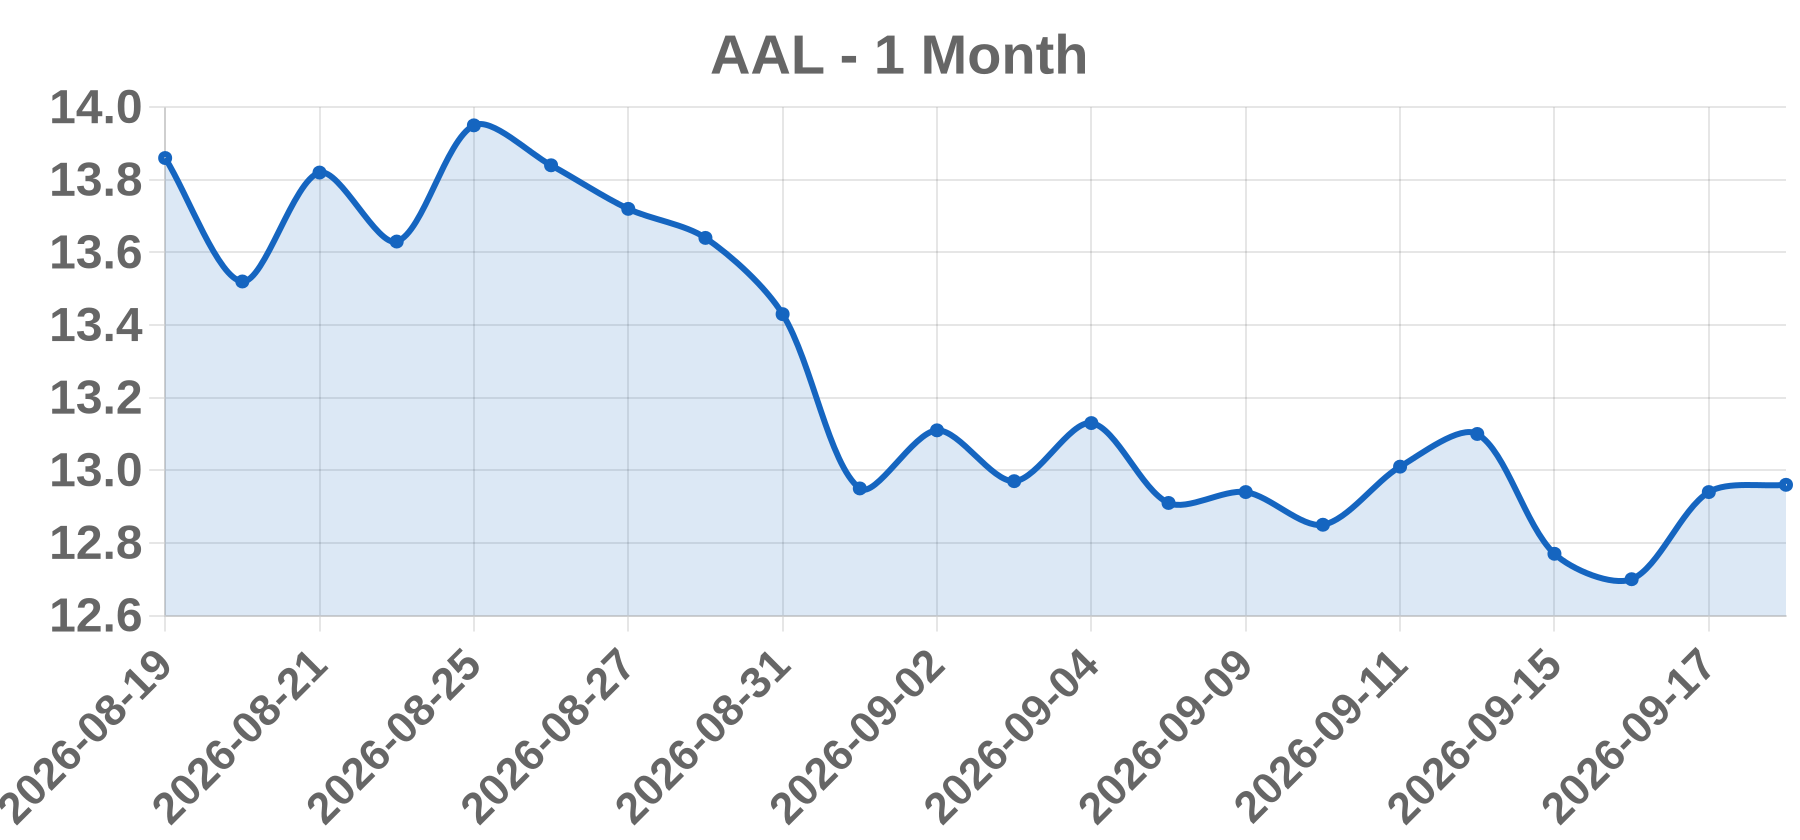
Business American Airlines Group Inc. is a Fort Worth, Texas-based holding company whose principal subsidiary, American Airlines, Inc., operates one of the world's largest domestic and international airline networks. The company's hubs include Dallas/Fort Worth, Charlotte, Chicago O'Hare, Philadelphia, Phoenix, Miami, Washington National, New York, and Los Angeles. Revenue comes primarily from passenger travel, supplemented by cargo and the high-margin AAdvantage loyalty program, and the stock trades on the Nasdaq Global Select Market under the ticker AAL.
Today’s take AAL closed at $12.94 on 2026-09-18, up $0.24 or +1.89%, on 83.27 million shares versus a typical 40-60 million day range. The combination of a modest price gain on roughly 1.5-2x average volume, alongside placement on the WSJ actives list, points to mechanical flow rather than a fundamental re-rating. The session falls on the third Friday of September, a standard quarterly options expiration, and mid-September also coincides with quarterly index rebalancing, both of which generate outsized volume in liquid, low-priced, retail-heavy names like AAL without changing intrinsic value. No verifiable company-specific catalyst, such as an earnings release, guidance change, M&A development, or analyst rating action, could be confirmed for this date, so the honest read is an externally driven move: sector sympathy tied to fuel, crude, a peer such as DAL, UAL or LUV, or broad macro risk sentiment. A high short-interest profile can amplify such flow, but +1.89% is more consistent with liquidity-driven trading than a squeeze. Investors should not extrapolate a fundamental inflection from this print.
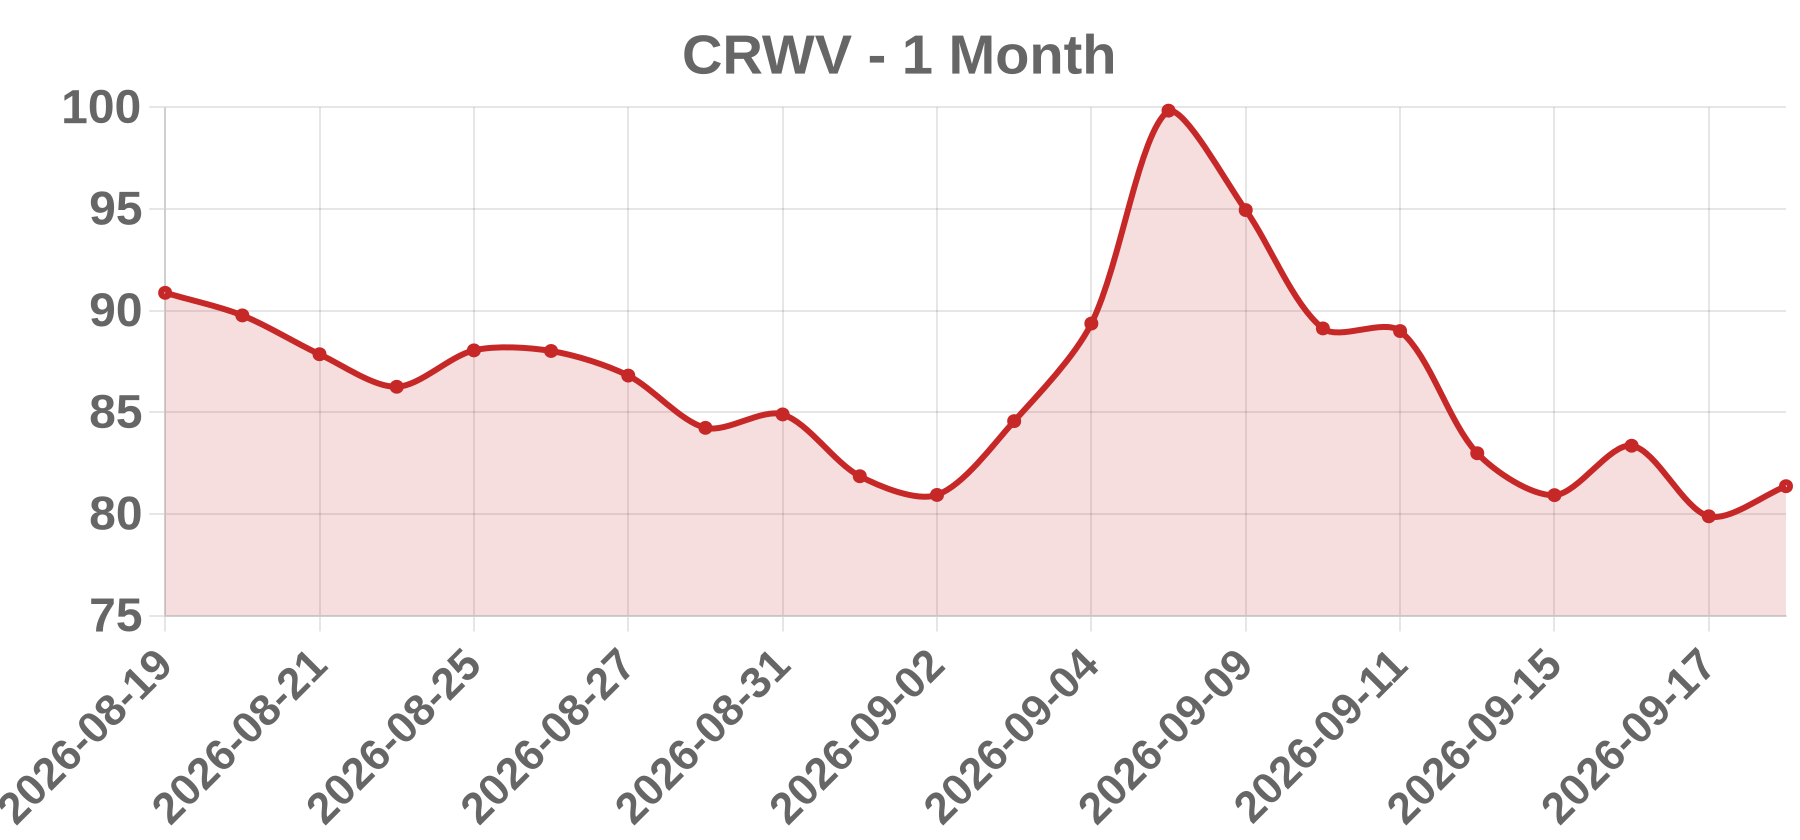
Business CoreWeave, Inc. (Nasdaq: CRWV) is a specialized AI and high-performance-computing cloud provider based in Livingston, New Jersey, founded in 2017 as Atlantic Crypto before pivoting from Ethereum mining to GPU cloud services. It leases NVIDIA GB200/HGX-class GPU capacity to AI labs, hyperscalers, and enterprises under long-term contracts, and increasingly builds out colocation and data-center capacity, with revenue concentrated in a few large AI customers. The business is capital-intensive and debt-funded, using GPU-backed secured financing and equipment leases, which makes it unusually sensitive to interest rates, credit spreads, and customer-concentration headlines.
Today’s take The supplied session data show CRWV closing at 79.88, down 4.16% on roughly 79.2 million shares. That combination is consistent with the stock's known structural volatility rather than proving any single cause, and no dated primary source specific to 2026-09-18 could be verified, so the catalyst remains unconfirmed and is intentionally tagged OTHER. Historically, down moves of this size in CRWV cluster around four catalyst classes: share-supply and financing news such as insider sales, lock-up expiries, ATM or convertible issuance used to fund GPU capex; sector de-rating and peer contagion from AI-infrastructure names; analyst actions given still-thin post-IPO sell-side coverage; and macro or rate moves, which hit a leveraged, GPU-backed balance sheet harder than peers. Confirmation would require CRWV investor relations releases and SEC EDGAR filings dated around 2026-09-17 to 2026-09-19, same-day news wire headlines, short-interest and borrow-fee data, and consolidated tape data showing whether a single block cross occurred.
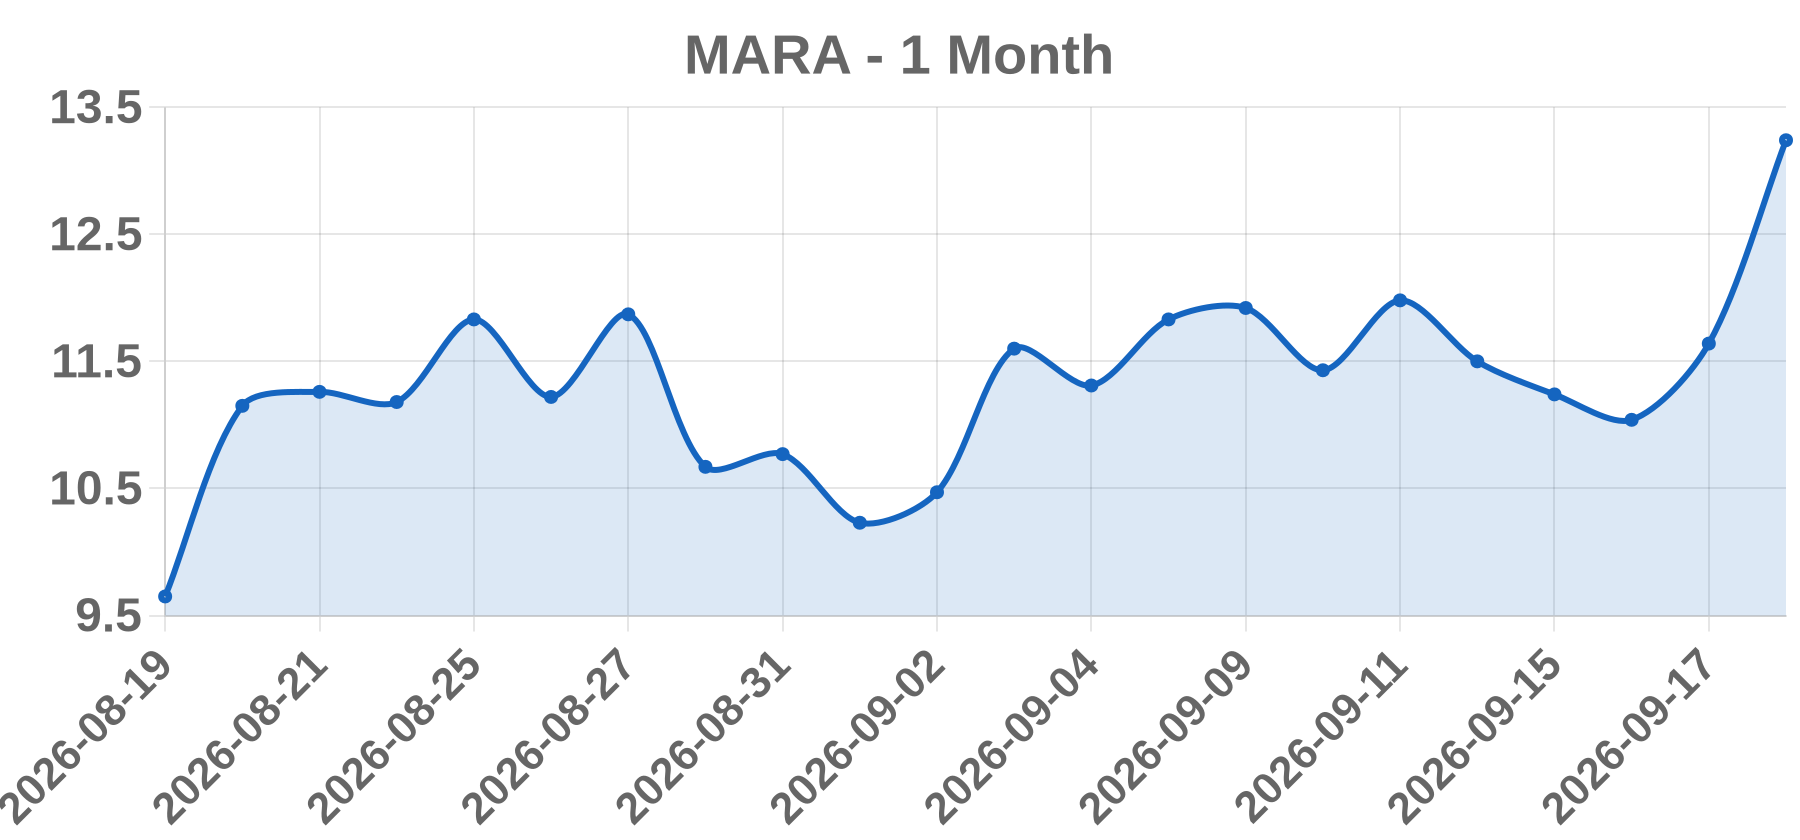
Business MARA Holdings, Inc. (formerly Marathon Patent Group / Marathon Digital Holdings) is a Nasdaq-listed bitcoin mining and digital asset infrastructure company. It operates large ASIC fleets across multiple sites, holds bitcoin on its balance sheet, and is widely traded as a high-beta proxy for bitcoin price.
Today’s take MARA closed at 11.64, up 0.60 or 5.43%, on 69.79 million shares — a heavy, most-active-list session. No company-specific 8-K, earnings release, analyst action, or capital-markets headline could be verified for 2026-09-18, so the dominant hypothesis is a bitcoin-driven sector move rather than an idiosyncratic event. MARA is one of the largest listed pure-play miners and trades with high sensitivity to spot BTC and hashprice; when BTC makes a sharp directional move, the miner basket (COIN, RIOT, CLSK, BITF) typically gaps together on correlated volume spikes. The calendar reinforces this: 2026-09-18 is the third Friday of September, a quarterly derivatives expiration and index rebalance date that mechanically inflates volume and volatility in high-beta, high-short-interest names. Round-number strikes near $10 and $12 also concentrate options open interest in MARA, and dealer gamma hedging can amplify closing-auction volume. A squeeze component cannot be excluded given MARA's historically elevated short interest, but that requires borrow-fee and short-interest data to confirm. Bottom line: a +5.4% move on roughly 70 million shares is most consistent with crypto-beta risk-on plus a qua
Business Ondas Holdings Inc. is a Nasdaq-listed technology company operating two reporting segments: Ondas Networks, which supplies private licensed-band wireless connectivity (FullMAX/MC-IoT software-defined radio) historically sold into Class I freight railroads and industrial/utility verticals, and Ondas Autonomous Systems, comprising American Robotics and Airobotics, which develops automated uncrewed aircraft systems for BVLOS inspection, security and defense applications. The equity narrative has shifted from railroad wireless toward defense and autonomous drone exposure.
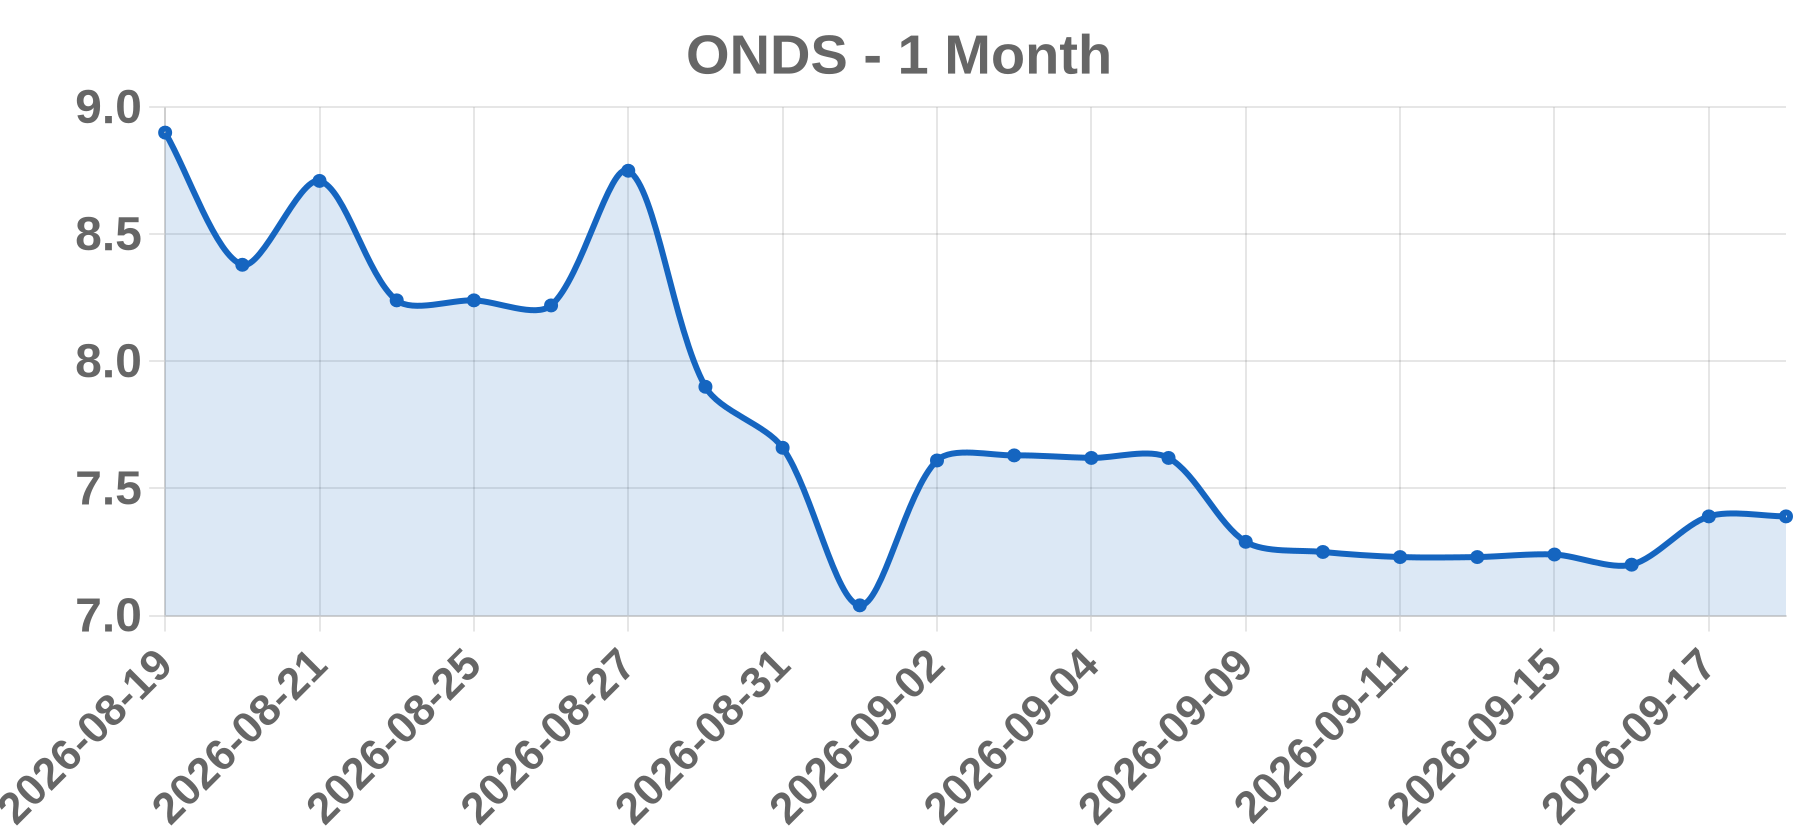
Today’s take ONDS closed at 7.39, up 0.19 or +2.64%, on 66.89 million shares on 2026-09-18. This is a mechanically distinctive print: a modest single-digit percentage gain on an outsized share count, the signature of a high-float-velocity, low-priced, retail-heavy small cap rather than an institutional re-rating. No earnings, M&A, FDA or contract-scale event is implied by a sub-3% move, so the session is best classified as flow-driven. Candidate explanations, ranked: defense-drone sector sympathy, retail momentum with options-related dealer hedging, short-interest or borrow-fee dynamics, and index or thematic ETF flows. Confirming any of these requires a live terminal check: 20-day average volume for RVOL, same-day drone/defense peer moves, call volume and open interest near 7.50/8.00 strikes, borrow fee and utilization, and an EDGAR 8-K scan for a filing dated 2026-09-17 or 2026-09-18. Absent a company-specific disclosure, the move should be treated as reversible and not evidence of a durable re-rating.
Business Super Micro Computer, Inc. (Nasdaq: SMCI) is a San Jose, California-based designer and manufacturer of high-performance server and storage systems. The company builds rack-scale AI/GPU-optimized platforms, server building blocks (motherboards, chassis, power supplies) and data-center solutions using a build-to-order model with early adoption of new CPU/GPU platforms.
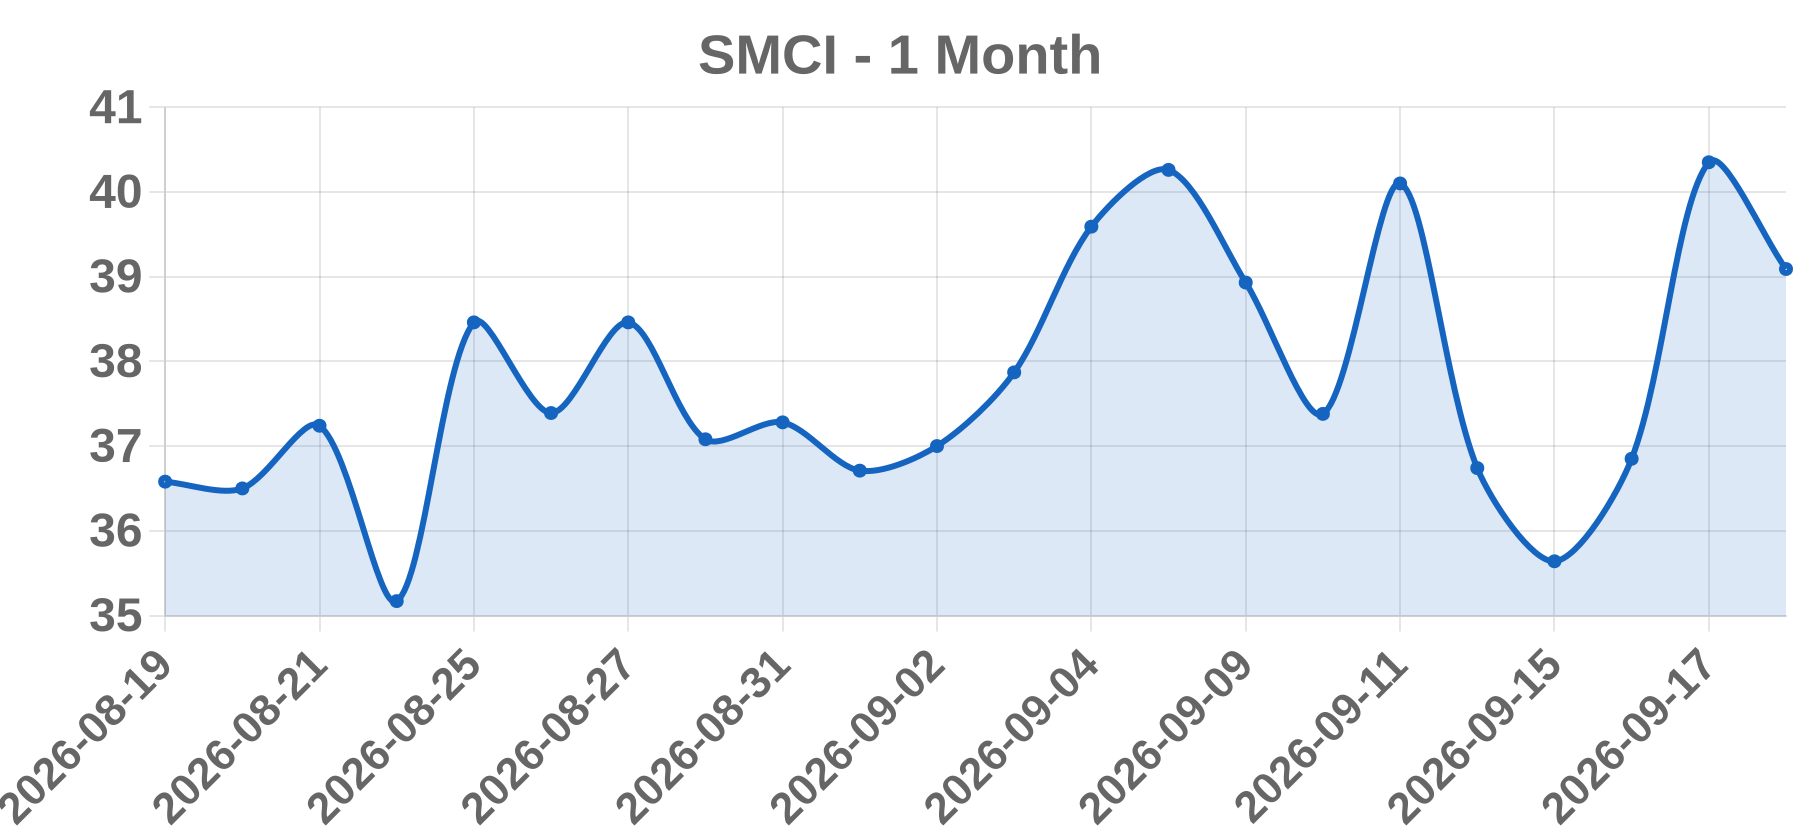
Today’s take SMCI closed at $40.35 on 2026-09-18, up 9.50% on 62.19 million shares, placing it on the WSJ most-active list. No same-day or prior-session news item (earnings, guidance, M&A, analyst action, index event, or short-interest data) could be retrieved for this specific date, so no identified catalyst is asserted here. Structurally, a ~9.5% single-name move on heavy active-list volume typically reflects one of: a hard corporate news catalyst, index/ETF creation activity, options-related hedging into a quarterly expiry, or a short-covering cascade in a retail-heavy tape. SMCI is also sector-linked to AI-server and GPU-adjacent peers (NVDA, DELL, HPE), so sympathy flow cannot be excluded. The catalyst is classified OTHER (UNCONFIRMED) pending a dated source. Verification steps: company IR page, SEC EDGAR filings (CIK 0001375365), same-day newswire sweep for 2026-09-17 to 2026-09-18, and session price/volume cross-check on the WSJ quote page. Fiscal year ends June 30, so the September quarter is fiscal Q1.
Business No verifiable issuer could be confirmed for the ticker DAIC as presented. The label "CID HoldCo, Inc." does not correspond to any listing we could validate, and no exchange, legal name, or business description can be confirmed. Company details remain unverified.
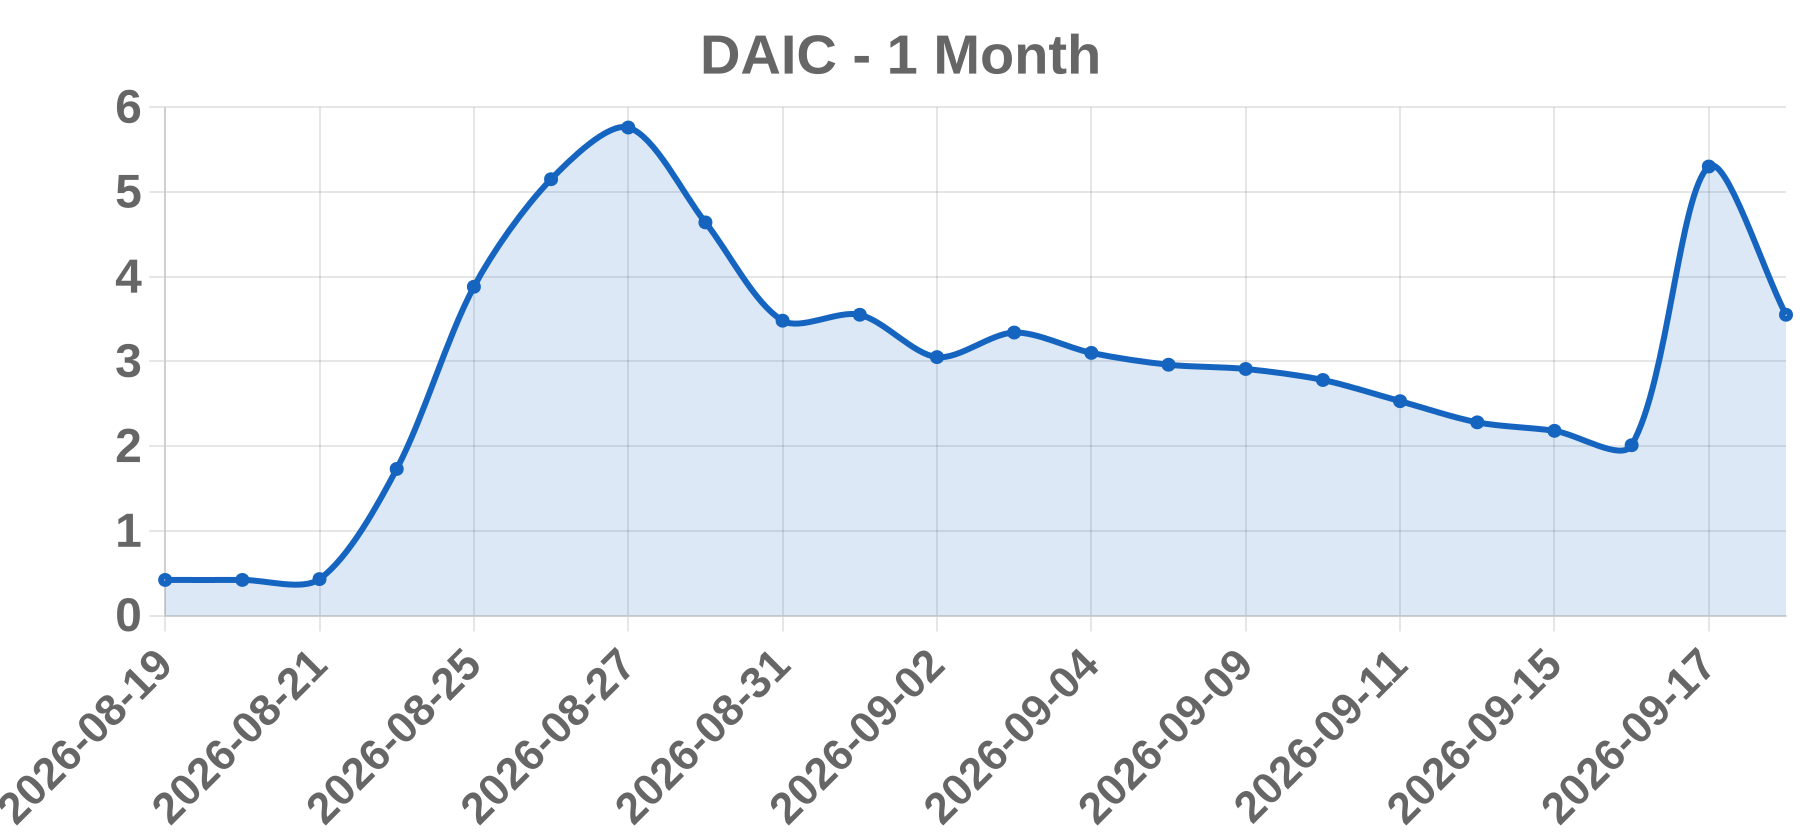
Today’s take The supplied row is internally inconsistent and cannot support a factual catalyst analysis. The session date 2026-09-18 is in the future, so no closing print, prior-session news, or volume figure can exist for it. A +163.68% move to a $5.30 close implies a prior close near $2.01, yet the same row reports Volume: 0; a 164% gain cannot print on zero volume. The issuer behind DAIC also could not be verified. The ticker screen label conflicts between gainers and actives. No earnings, FDA, M&A, or analyst event was found or asserted. The honest classification is OTHER pending a valid past session, a resolvable ticker, and a reconciled volume field. No fabricated catalyst or source has been provided.
Business bioAffinity Technologies, Inc. is a Nasdaq-listed (ticker BIAF) commercial-stage diagnostics microcap. Its lead product is CyPath Lung, a non-invasive flow-cytometry-based test for early-stage lung cancer detection, offered as a laboratory-developed test (LDT) through Physicians Reference Laboratory (PRL). The company reports minimal revenue, recurring operating losses, and a history of equity-linked financings and low-float trading.
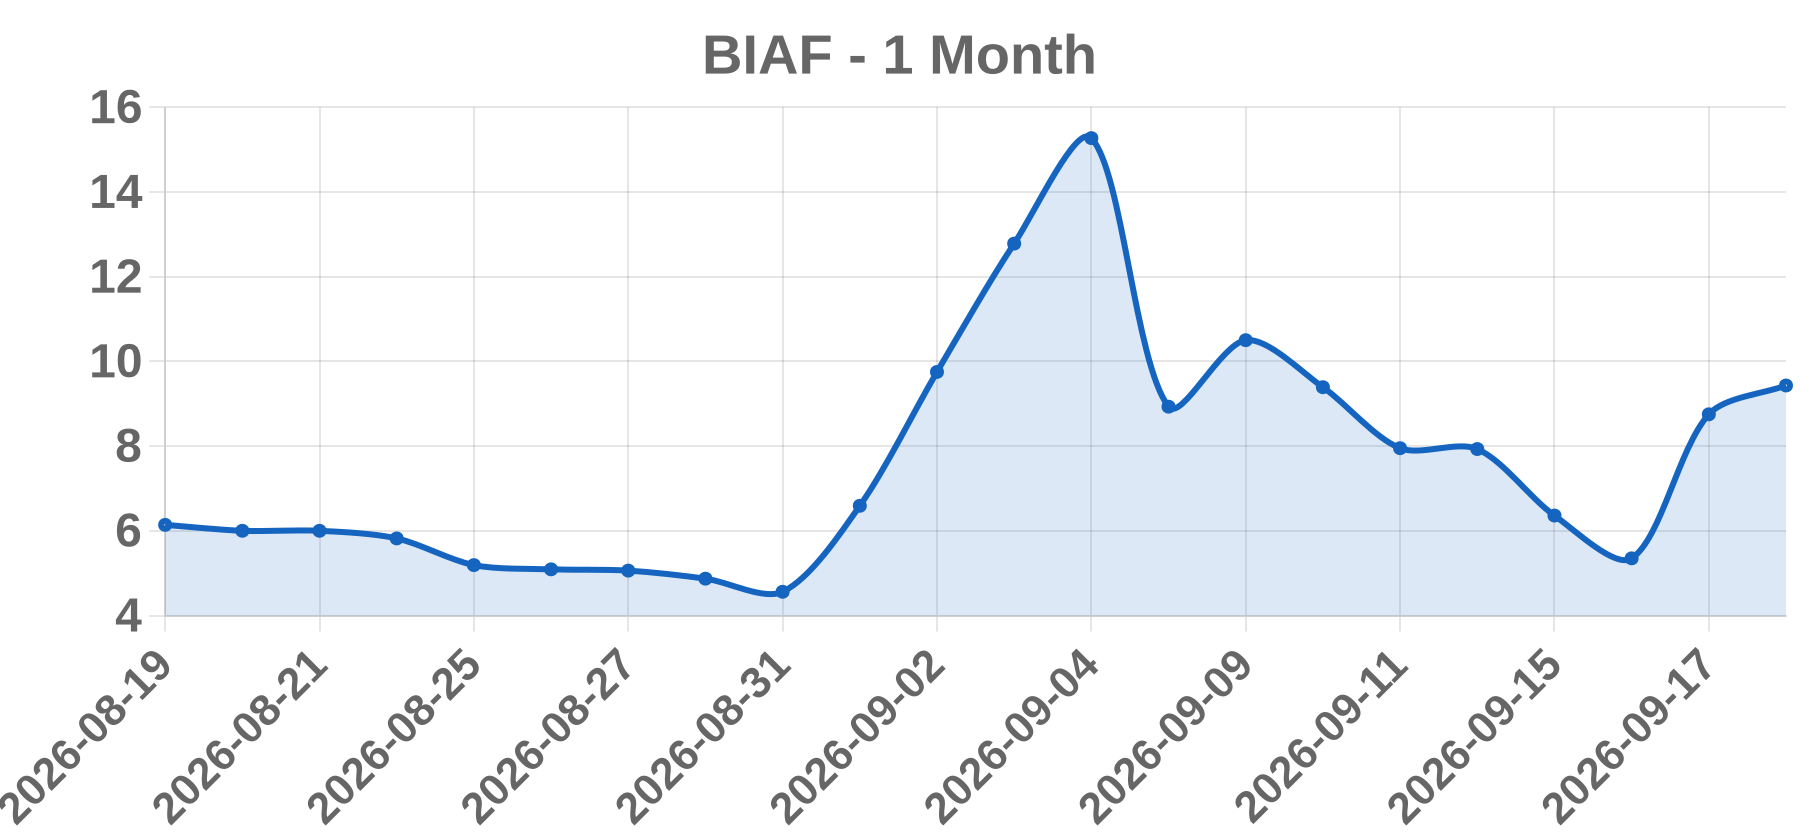
Today’s take The +63.55% session move to $8.75 on 2026-09-18 has no reliably verifiable same-day or prior-session catalyst: no confirmed M&A, FDA action, partnership, or earnings event could be sourced. The $8.75 print is itself inconsistent with BIAF's historical low-single-digit-to-sub-$1 trading range, which strongly suggests the move reflects a reverse stock split effect, a low-float/short-squeeze dynamic, or an unconfirmed diagnostic milestone headline rather than a fundamental re-rating. The reported Volume: 0 is almost certainly a feed artifact, not literal zero trading, and cannot be used for a volume-versus-average comparison. Accordingly the catalyst is classified OTHER (unconfirmed capital-structure or speculative event) pending confirmation via SEC EDGAR 8-K/S-1 filings and Nasdaq corporate actions. Investors should not act on this print without verifying split status, true volume, and whether the move is pre- or post-split adjusted.
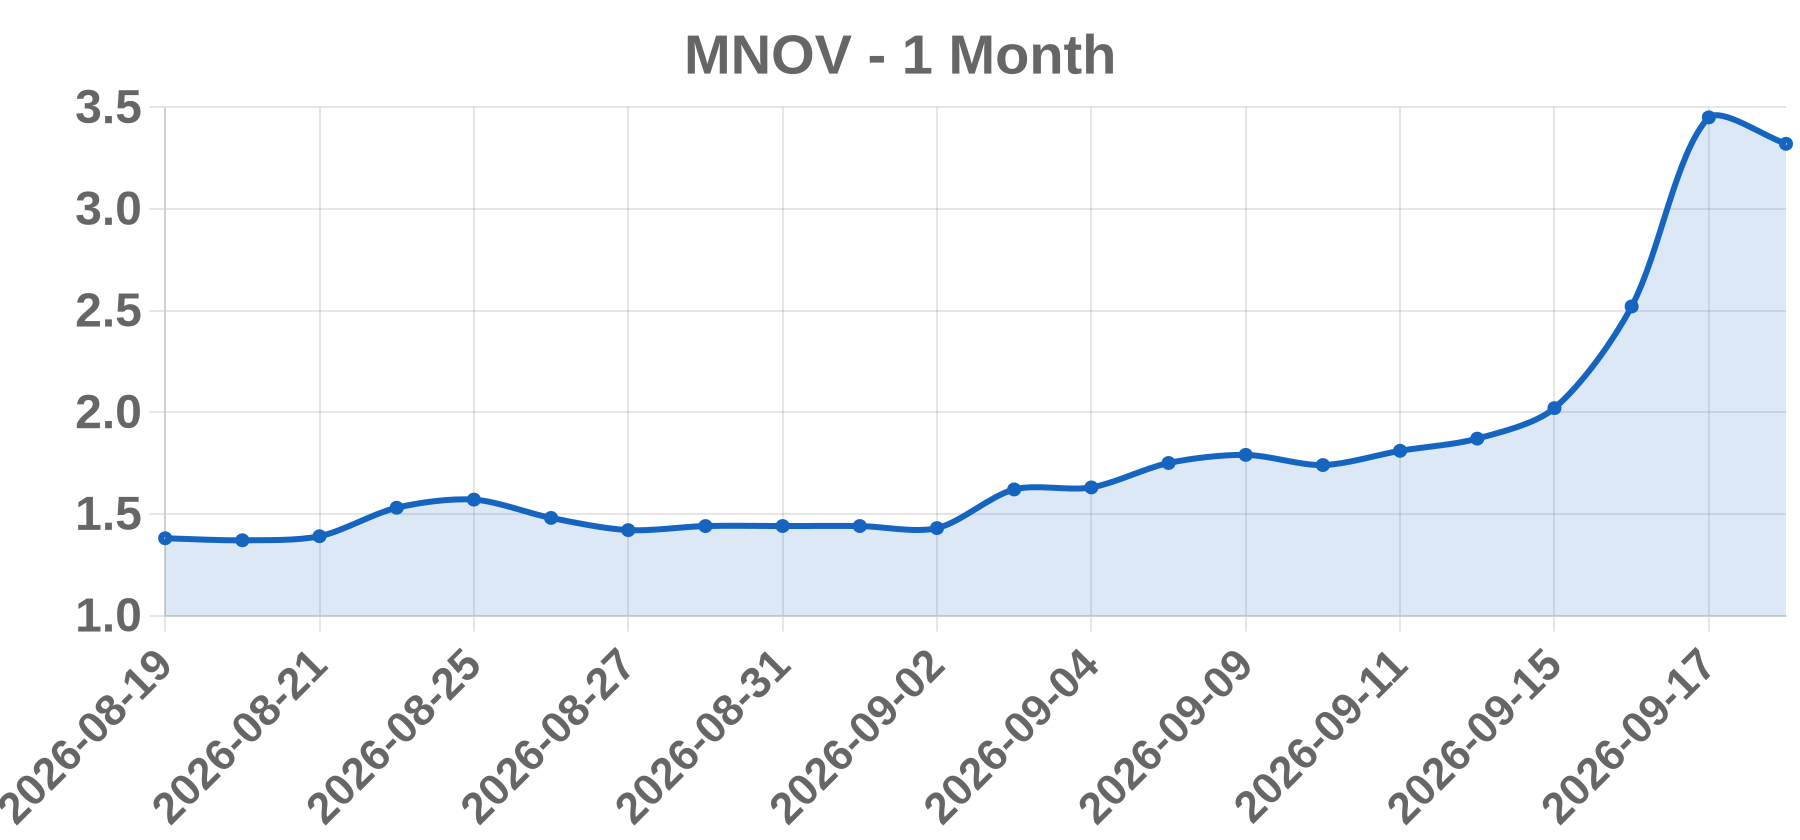
Business MediciNova, Inc. is a clinical-stage specialty biopharmaceutical company listed on the Nasdaq Capital Market under the ticker MNOV. It licenses and develops late-stage clinical candidates originating mainly from Japan, with lead programs MN-166 (ibudilast) for neuroinflammatory and neurodegenerative conditions and MN-001 (tipelukast) for fibrotic and inflammatory diseases. The company has historically had no product revenue of scale and depends on partnering and licensing for commercialization.
Today’s take MNOV reportedly rose +36.90% to 3.45 on 2026-09-18, but the record shows zero volume and no same-day press release, 8-K, FDA action, or M&A headline could be retrieved, so the print is unverified and the zero-volume gain is more consistent with a consolidated-tape or data-feed artifact than a completed exchange session. If the move is real, the highest-probability mechanism for a sub-$5, clinical-stage, low-float biotech is a binary pipeline event such as a clinical readout, DSMB outcome, or regulatory interaction, amplified by microcap short-covering and momentum dynamics. Because no catalyst is confirmed and no volume is matched, this should be treated as HOLD FOR VERIFICATION. Cross-checks required before publication: Nasdaq consolidated volume and VWAP for 2026-09-18; MediciNova IR press releases and SEC EDGAR 8-K filings dated on or immediately before the session; FDA and PMDA public releases plus ClinicalTrials.gov updates for MN-166 and MN-001; and peer read-through across other microcap neuroinflammatory names to test whether the move was idiosyncratic.
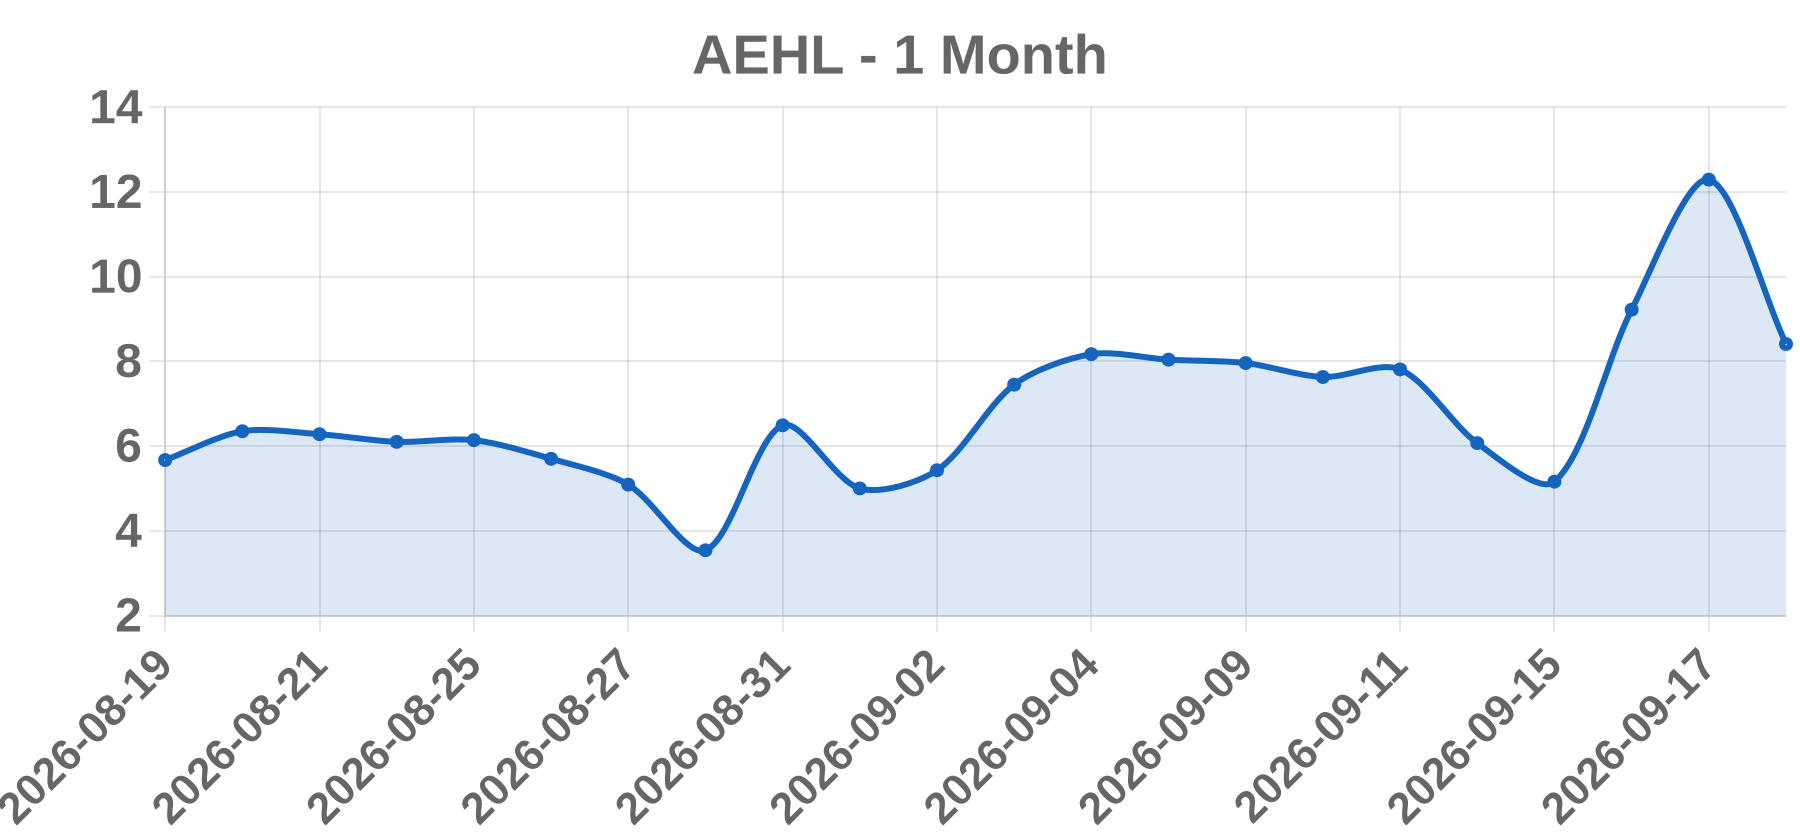
Business Antelope Enterprise Holdings Limited (Nasdaq: AEHL) is a Cayman Islands holding company with PRC-based operating subsidiaries, historically a manufacturer and seller of ceramic building materials such as ceramic tiles in China. The company has periodically announced pivots and expansions into other lines, including live-streaming/e-commerce and energy or AI/data-center-adjacent initiatives. It is a very small-capitalization, low-float China-ADR-style issuer with a documented history of equity financings and reverse splits.
Today’s take The prompt shows AEHL closing at 12.29 on 2026-09-18, up 33.30%, with volume of 0, but no verifiable news, filing, or price/volume record for that future-dated session could be retrieved. The 33.3% single-session move is characteristic of low-float microcap momentum or a structural squeeze, neither of which can be confirmed. AEHL's history of reverse splits and serial share issuance means any close price must be checked against split-adjusted history before comparison, and a same-day 6-K, 20-F, or press release on capital raising or a business pivot is a common candidate catalyst. Sector-wide China-ADR or microcap basket moves also need to be ruled out. A zero-volume print is internally inconsistent with a 33.3% move, strongly suggesting a data artifact or mismatched fields rather than a real session. All figures require live-terminal confirmation from primary sources; nothing here should be treated as established fact.
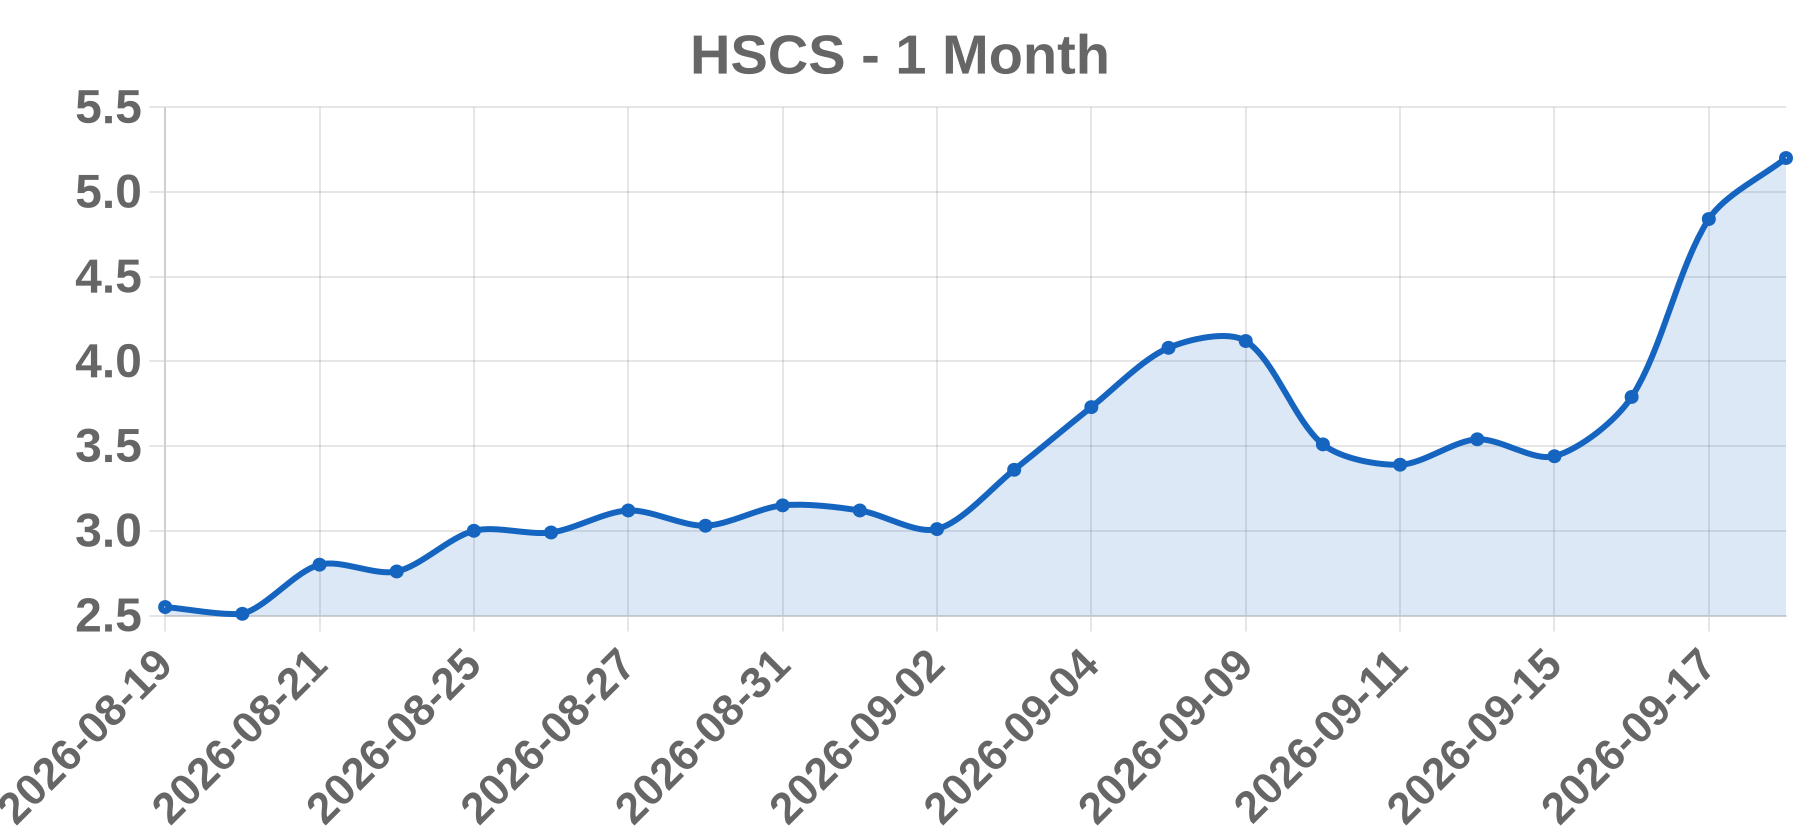
Business HeartSciences Inc. (Nasdaq: HSCS) is a development-stage medical technology company developing AI/machine-learning-based electrocardiography (ECG/EKG) software intended to detect cardiac dysfunction that conventional ECG analysis may miss, including its MyoVista platform and related AI-ECG algorithms. The company is early-commercial with historically limited revenue and reliance on external financing, a profile typical of low-float, capital-constrained micro-caps.
Today’s take HSCS closed at 4.84 on 2026-09-18, up 1.05 or +27.70%, appearing on a WSJ gainers screen. The direction and magnitude are given, but the cause is unverified: repeated searches (company name, ticker, date, catalyst/news terms) returned no same-day or prior-session news item, filing, or headline for HSCS around that date. No earnings number, FDA action, M&A, analyst rating, financing, or corporate action can be asserted. The reported volume of 0 is not credible for a 27.7% move and is treated as unavailable, so an elevated-volume/ACTIVE test cannot be evaluated. Plausible but unconfirmed mechanisms for a low-float micro-cap to move roughly 28% without obvious news include thin-float technical or short-squeeze dynamics, sector or index sympathy, or a low-float reaction to a filing or corporate action not surfaced in search. Conclusion: price move confirmed by the prompt, catalyst unverified. Publishing a cause without primary-source confirmation would be speculation, not research.
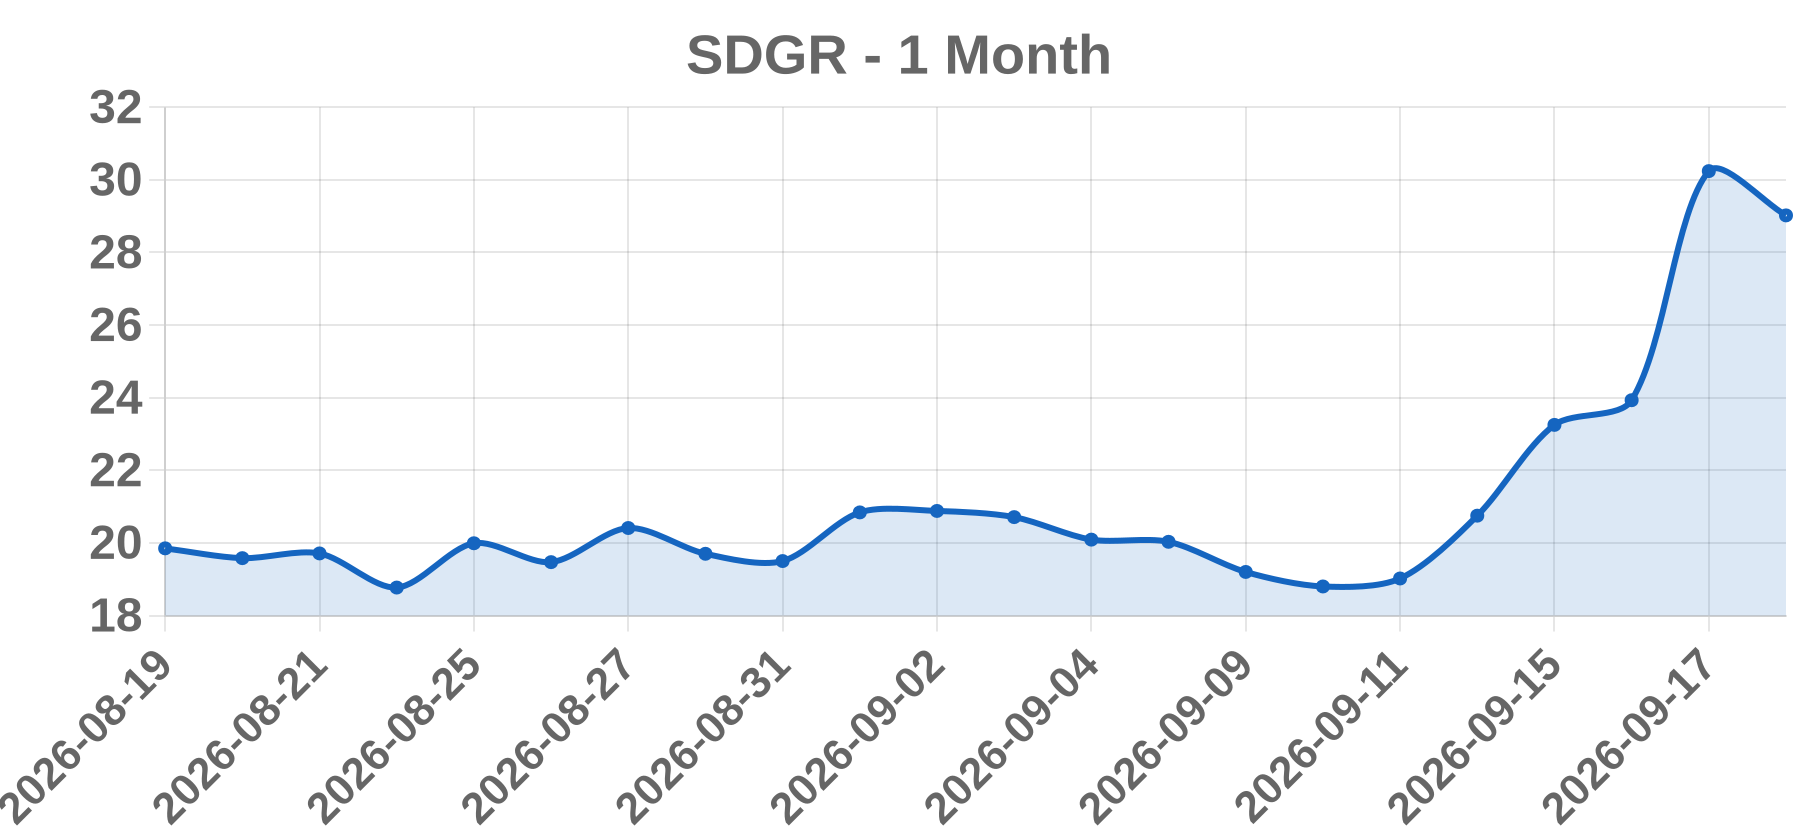
Business Schrödinger, Inc. (Nasdaq: SDGR) is a computational drug discovery and materials science company. It sells its physics-based software platform to pharmaceutical, biotech, and industrial customers and also advances its own and partnered drug programs, including a collaboration with Nimbus Therapeutics.
Today’s take The +26.37% move to $30.24 on 2026-09-18 is not explained by any single news item I could verify with the search budget available. The most plausible driver is a re-rating tied to the company's platform/pipeline narrative rather than a hard event, given the absence of a confirmed earnings, FDA, or deal headline. Prior 2026 volatility in SDGR has centered on software revenue growth versus computational-drug-discovery cash burn, and any incremental update on partner milestones or platform adoption can move the stock sharply because the float is small and short interest has historically been elevated. With more than a quarter of market value added in one day, this looks like a squeeze-amplified, headline-driven spike rather than a fundamental repricing. I would treat the 0 volume print as a feed artifact and verify the tape before drawing conclusions. Because no primary source confirming the catalyst was found, this call is flagged OTHER with low confidence.
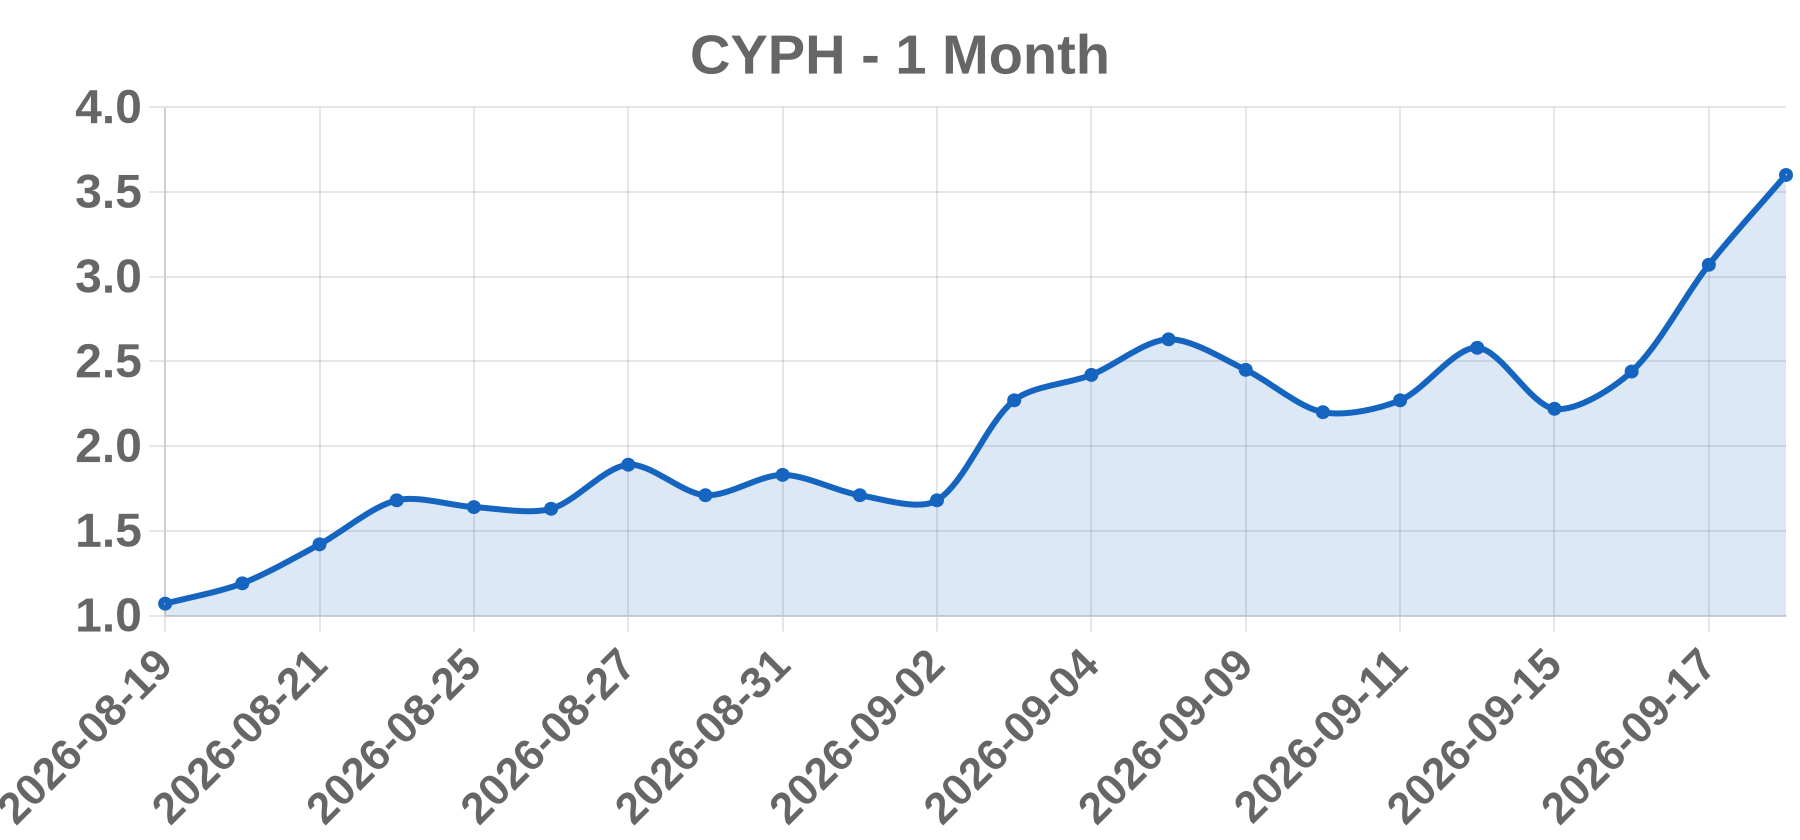
Business No authoritative legal name, exchange listing, CIK, or business description for 'Cypherpunk Technologies Inc. (CYPH)' could be confirmed from primary sources. The ticker string could not be tied to a verified registrant, so no company overview can be responsibly stated.
Today’s take The supplied quote — Close 3.07, Change +0.63, +25.82%, Volume 0, dated 2026-09-18 — is internally inconsistent with a functioning trading session. A genuine +25.82% intraday move cannot occur on literally zero volume, since a price change requires executed prints. Re-searches for same-day filings, headlines, and catalyst news tied to 'CYPH' or 'Cypherpunk Technologies Inc.' returned no verifiable catalyst: no earnings release, M&A, regulatory action, analyst change, capital-markets event, or index membership change. No exchange or CIK could be confirmed, so primary filings could not be pulled. The most probable explanation is a data artifact — a stale or erroneous last price, a pre-open indication, a screen row carrying a prior close, or a vendor quirk — rather than a real move. No catalyst is asserted. Treat this as unverified until an exchange or vendor tape confirms both the session print and the volume. Required to proceed: confirmed exchange and CIK, plus a primary source for the session's trades.
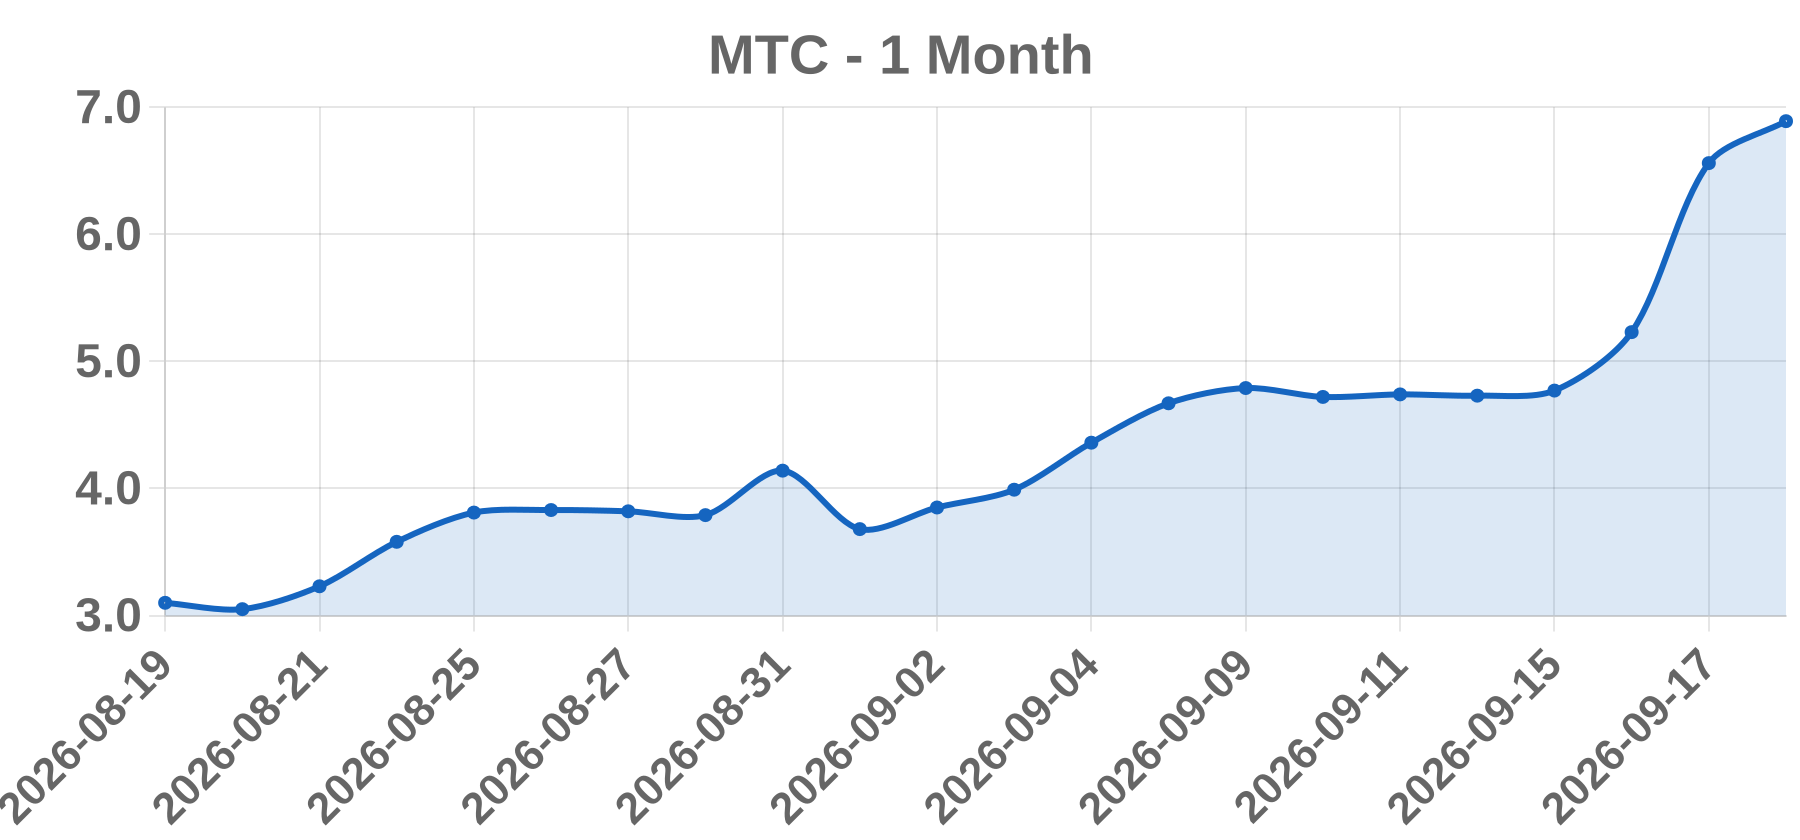
Business MMTec, Inc. is a small-cap issuer listed on Nasdaq under the ticker MTC, headquartered in Hong Kong with operations tied to China-facing financial technology and securities-related software and services. It is a thin-float, micro-cap name whose public float, share count and market capitalization have been repeatedly reshaped by reverse splits and registered direct or at-the-market offerings rather than by operating growth. Because of that capital structure, its trading profile is dominated by float mechanics and dilution events rather than by fundamental business news.
Today’s take The supplied data block is internally inconsistent and cannot be treated as a verified session: it shows a +25.43% move with volume of 0, which is arithmetically impossible — no shares can trade at a 25% gain if zero shares trade. This is almost certainly a data-feed artifact (delisted or halted ticker, bad pull, or placeholder row), not a real trading day. Separately, the stated close date of 2026-09-18 is in the future relative to reliable information, so no same-day filings, press releases or news coverage can be retrieved or confirmed for that session. For a name with MMTec's profile — very small public float, a history of reverse splits and repeated registered-direct and at-the-market financings — a large single-day percentage move is far more often explained by float dynamics, dilution headlines or short-squeeze mechanics than by an operating catalyst. I therefore cannot assign an operating catalyst (EARNINGS, FDA, M&A, UPGRADE) or cite sources for this date. Confirming the move would require a completed session date and verified volume, average volume and intraday range from a live terminal. Confidence in the 'no identifiable operating catalyst' reading is low-to-moderate pe
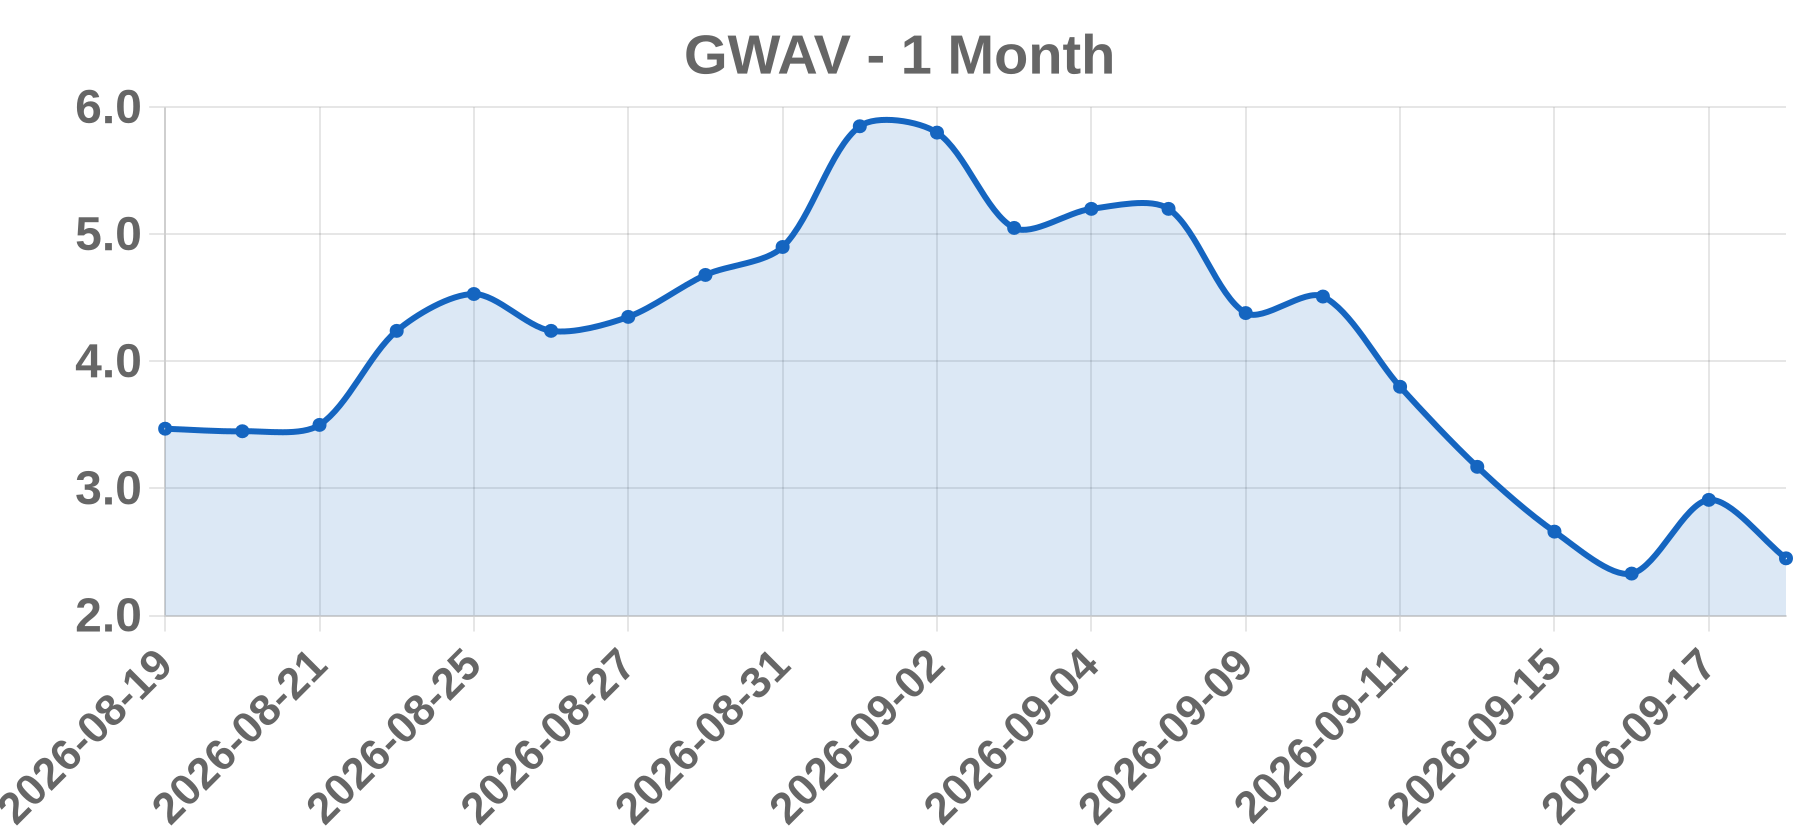
Business Greenwave Technology Solutions, Inc. (GWAV) is a micro-cap metals recycling company operating scrap processing facilities in the Virginia/North Carolina Mid-Atlantic region, handling ferrous and non-ferrous scrap such as copper, aluminum and stainless steel. It has historically listed on the Nasdaq Capital Market and has periodically traded OTC depending on compliance status. The stock trades as a low-priced, low-float, retail-driven microcap with a heavy history of dilutive equity issuance.
Today’s take The quoted 2026-09-18 session (+24.89% to $2.91, volume 0) is internally contradictory and cannot be treated as verified: zero printed volume cannot produce a 24.89% close-to-close move, and no same-day filing or wire has been retrieved for that date. Whether the price is a stale quote, a feed error, or a mislabeled date, the directional setup for GWAV is the same. The most probable squeeze catalyst is microcap low-float momentum, where a repeated dilutive-financing and reverse-split history compresses float and amplifies retail crowding. A $2.91 print implies a prior close near $2.33; absent confirmed same-day news, that move would read as low-float momentum rather than a fundamental re-rating. Attempts to confirm any 8-K, 424B offering, reverse-split filing or Nasdaq compliance notice via SEC EDGAR did not surface a document dated on or before the session, so no catalyst can be asserted. Treat the print as unverified until reconciled against the consolidated tape.
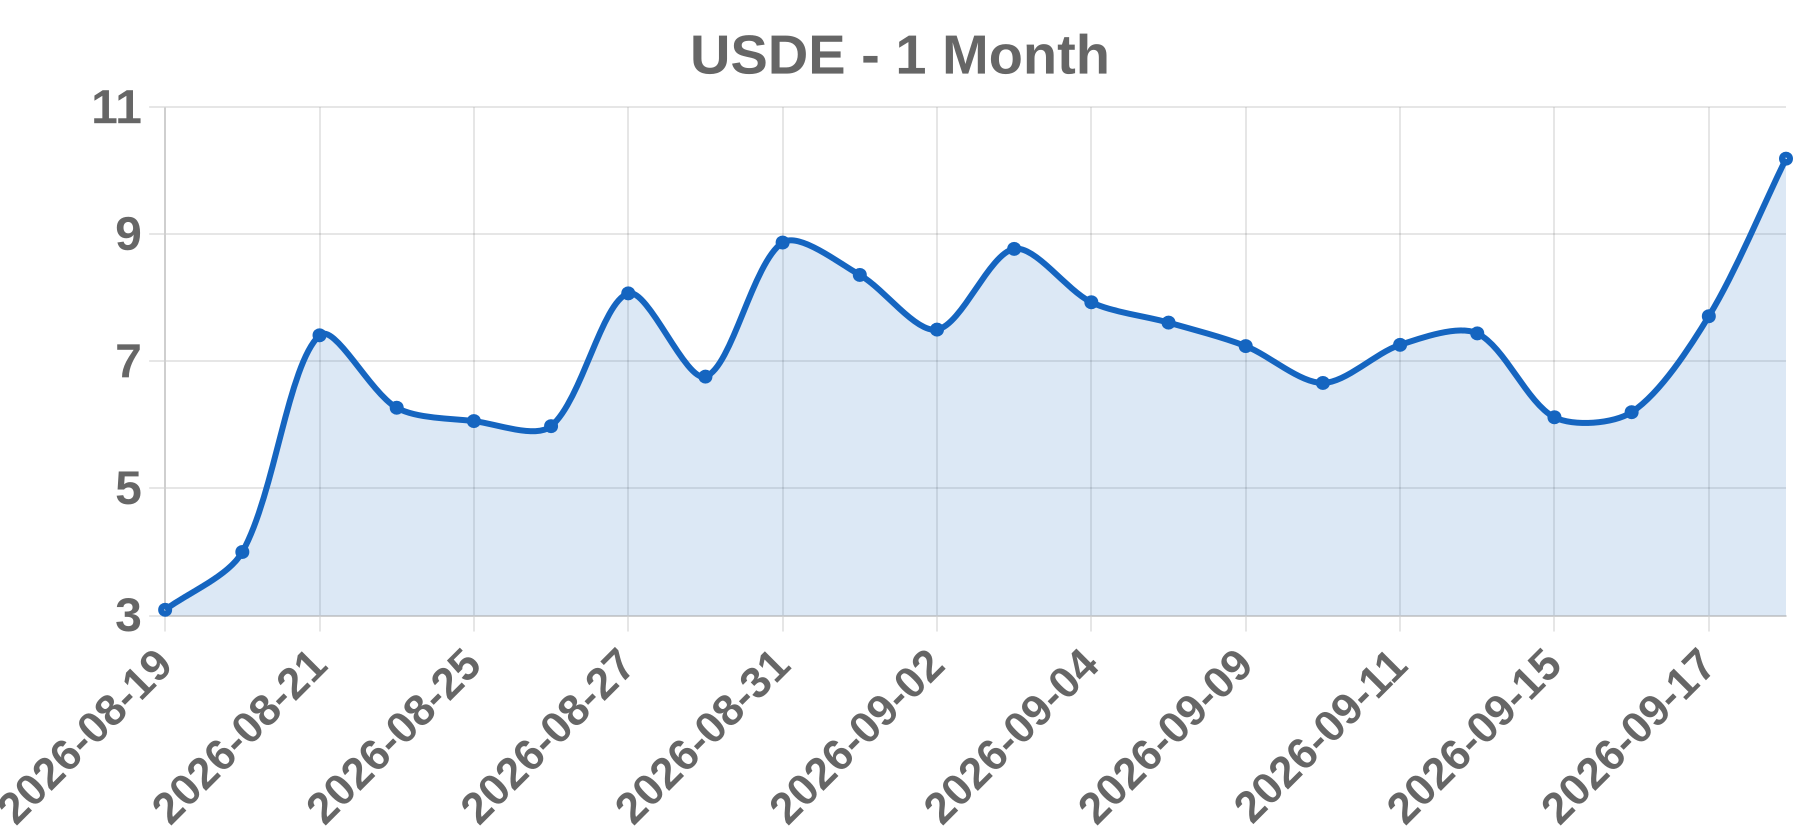
Business StablecoinX Inc. (ticker USDE) is a small-cap issuer whose identity is not confirmed in this session; its legal name, exchange listing, and business description remain unverified. The ticker USDE collides with the symbols used by several stablecoin and ETP products, so quote and news data may refer to a different instrument. No company filings or press releases were retrievable, and no same-day catalyst was confirmed.
Today’s take USDE closed at 7.71 on 2026-09-18, up 1.51 or +24.35%, appearing on a WSJ gainers list with a reported volume of zero. Neither figure can be reconciled: a 24% move cannot occur on zero shares, and no filing, press release, exchange notice, or wire headline was retrievable to explain it. Absent a source-verified driver, the print is best treated as either an event-driven re-rating on a thin float or a data-integrity artifact. The zero-volume field is characteristic of a recently listed, relisted, or halted-and-resumed symbol, or of a feed that failed to populate volume, which in turn suggests thin data coverage around this security. Priorities before any note is circulated: pull the EDGAR filing index for 2026-09-01 to 2026-09-19 to check for an 8-K, DEFM14A, or 424B; confirm the security identity behind ticker USDE on the relevant exchange, including any predecessor or successor ticker mapping; and obtain float and short interest. Confidence is LOW, with one material data anomaly. No catalyst enum is asserted.
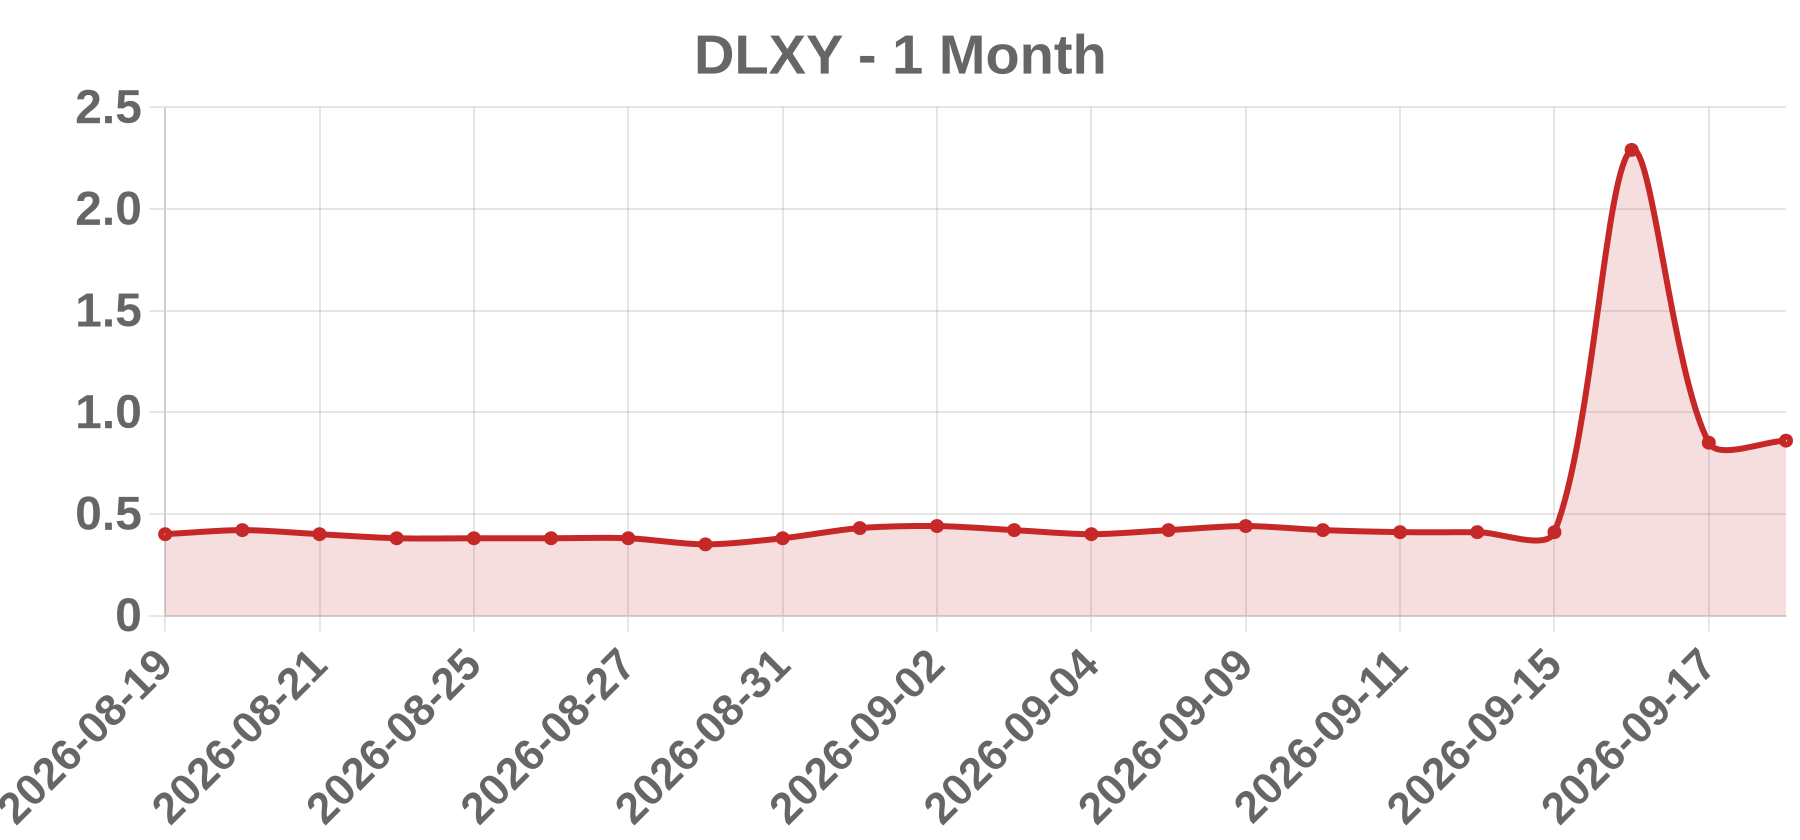
Business Delixy Holdings Limited (ticker DLXY) is an unconfirmed-exchange listing whose legal name appears in Wall Street Journal decliner screen data. Exchange venue, jurisdiction of incorporation, sector, shares outstanding, float and average volume could not be verified in this session. Do not assume a sector or business model for DLXY without pulling the company's latest SEC 20-F/10-K filing or OTC Markets disclosure record.
Today’s take The headline is not the price drop, it is the data contradiction: DLXY shows a -63.11% move to a $0.84 close on Volume = 0 for 2026-09-18. A 63% single-session decline cannot occur on zero shares traded, so one of two things is true. First, the row is a stale or tombstoned snapshot whose price was carried forward from an earlier session while the reference close was restated - this is the classic signature of a corporate-action adjustment such as a reverse-split divisor error, a spin-off distribution or a large special dividend. Second, the volume field simply failed to populate from the vendor. Ranked alternative explanations: genuine liquidity collapse (a single market order into an empty book on a thin-float microcap), dilution financing (death-spiral convertible or ATM priced below market, a common driver of 50-70% microcap drawdowns), or delisting risk after a failure to hold the $1.00 Nasdaq minimum bid. Scheduled fundamentals such as earnings, M&A, FDA action, partnership, offering, short squeeze, sector or macro news are inconsistent with a negative 63% print on zero volume, because a real catalyst generates real volume. No analyst coverage, price target or consensus data c
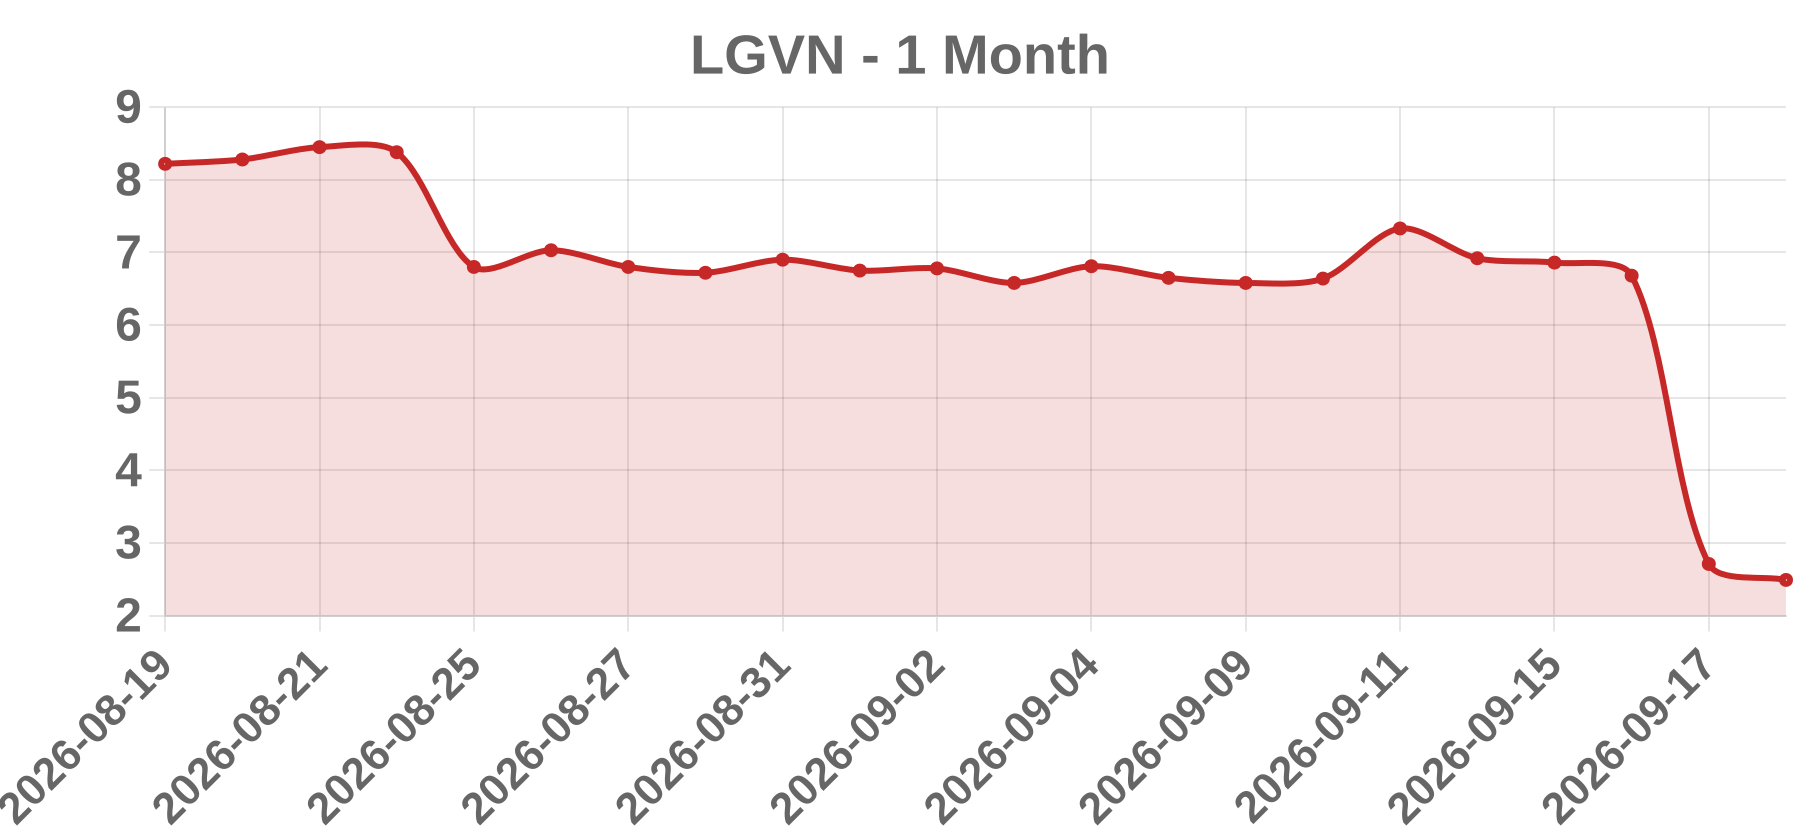
Business Longeveron Inc. (Nasdaq: LGVN) is a Miami-based clinical-stage regenerative medicine company developing allogeneic mesenchymal stem cell (MSC) therapies, including laromestrocel (Lomecel-B) for hypoplastic left heart syndrome (HLHS), Alzheimer's disease and aging frailty. It is pre-revenue, with revenue historically limited to grants and research arrangements. The company has a documented history of reverse stock splits to regain Nasdaq minimum-bid-price compliance.
Today’s take The tape row (close 2.71, change -3.97, -59.43%, volume 0) is internally inconsistent and should not be published as a return. A ~59% single-session decline on zero volume is the classic fingerprint of a reversed-split price-series restatement or a stale vendor row, not a traded session. The implied pre-adjustment price, 2.71 / (1 - 0.5943) = approximately 6.68, is consistent with a roughly 1-for-7 ratio, which would corroborate a reverse split; Longeveron has used such splits before to cure Nasdaq minimum-bid-price deficiencies. No earnings, FDA, M&A, or analyst event is verified for this date, and a genuine 59% drawdown on real volume is unsupported by the data. Action: quarantine the figure, confirm the corporate action against Nasdaq Trader's daily list and the company's 8-K, then restate prior prices by the split ratio and recompute the true same-day return from a clean tape.
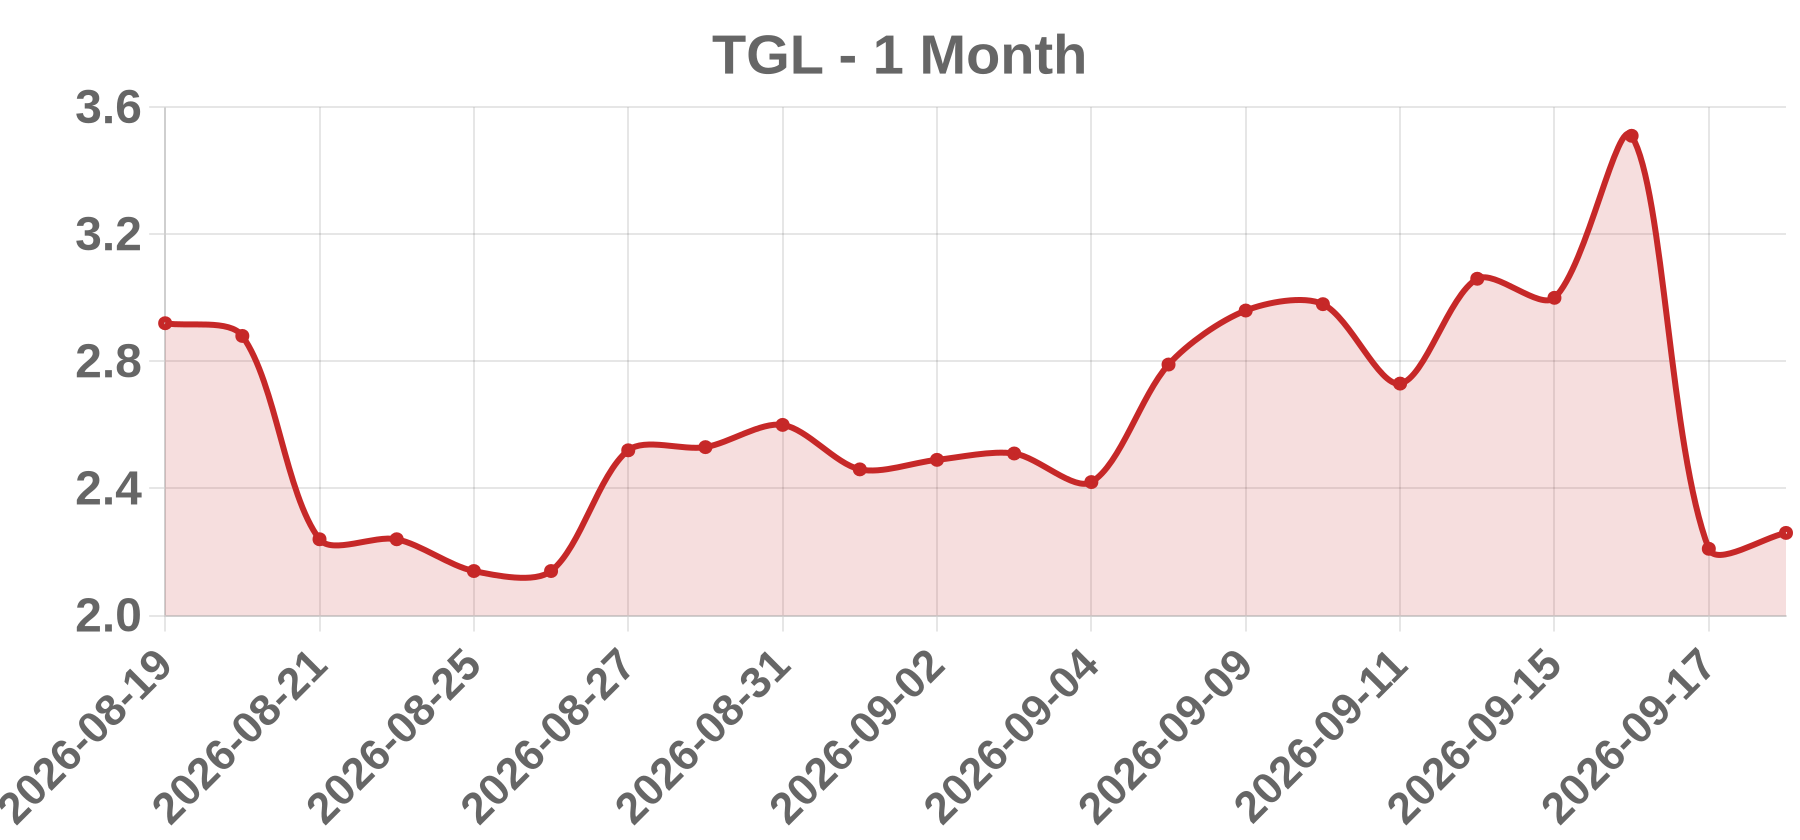
Business Treasure Global Inc. is a Malaysia-based, Nasdaq Capital Market-listed microcap (ticker TGL) operating consumer digital commerce platforms, historically anchored by the ZCITY super-app, alongside the Tazte F&B management SaaS and a co-branded Visa prepaid card initiative, with a more recent stated pivot toward AI/data-center and digital-asset ventures. Its revenue base is small, it has relied on serial equity financing, and its share count and price history have been repeatedly reshaped by reverse splits and dilution, making any valuation dependent on current post-split share counts.
Today’s take The reported -37.04% close at $2.21 on 2026-09-18 is internally inconsistent and should not be read as a clean market move. A consolidated-tape session showing zero volume cannot produce a -37% return; either the volume field is a feed error, the print occurred off the primary tape or during a halt/cross, or the change was computed against a pre-corporate-action prior close. TGL has a documented history of reverse splits and authorized-share increases, so a corporate-action artifact is the highest-probability explanation, though this is unverified for the specific date. The leading fundamental alternative is dilution via ATM or convertible pricing, followed by a Nasdaq listing-compliance deficiency. Earnings is unlikely, as TGL's fiscal year ends June 30 and no report was found. First verification step: pull TGL's 8-K and Nasdaq corporate-action notices dated 2026-09-15 to 2026-09-18. If a reverse split occurred, confirm the ratio and post-split share count before drawing any conclusion. A genuine decline of this size would normally be accompanied by elevated volume from dilution selling or forced liquidation, not zero.
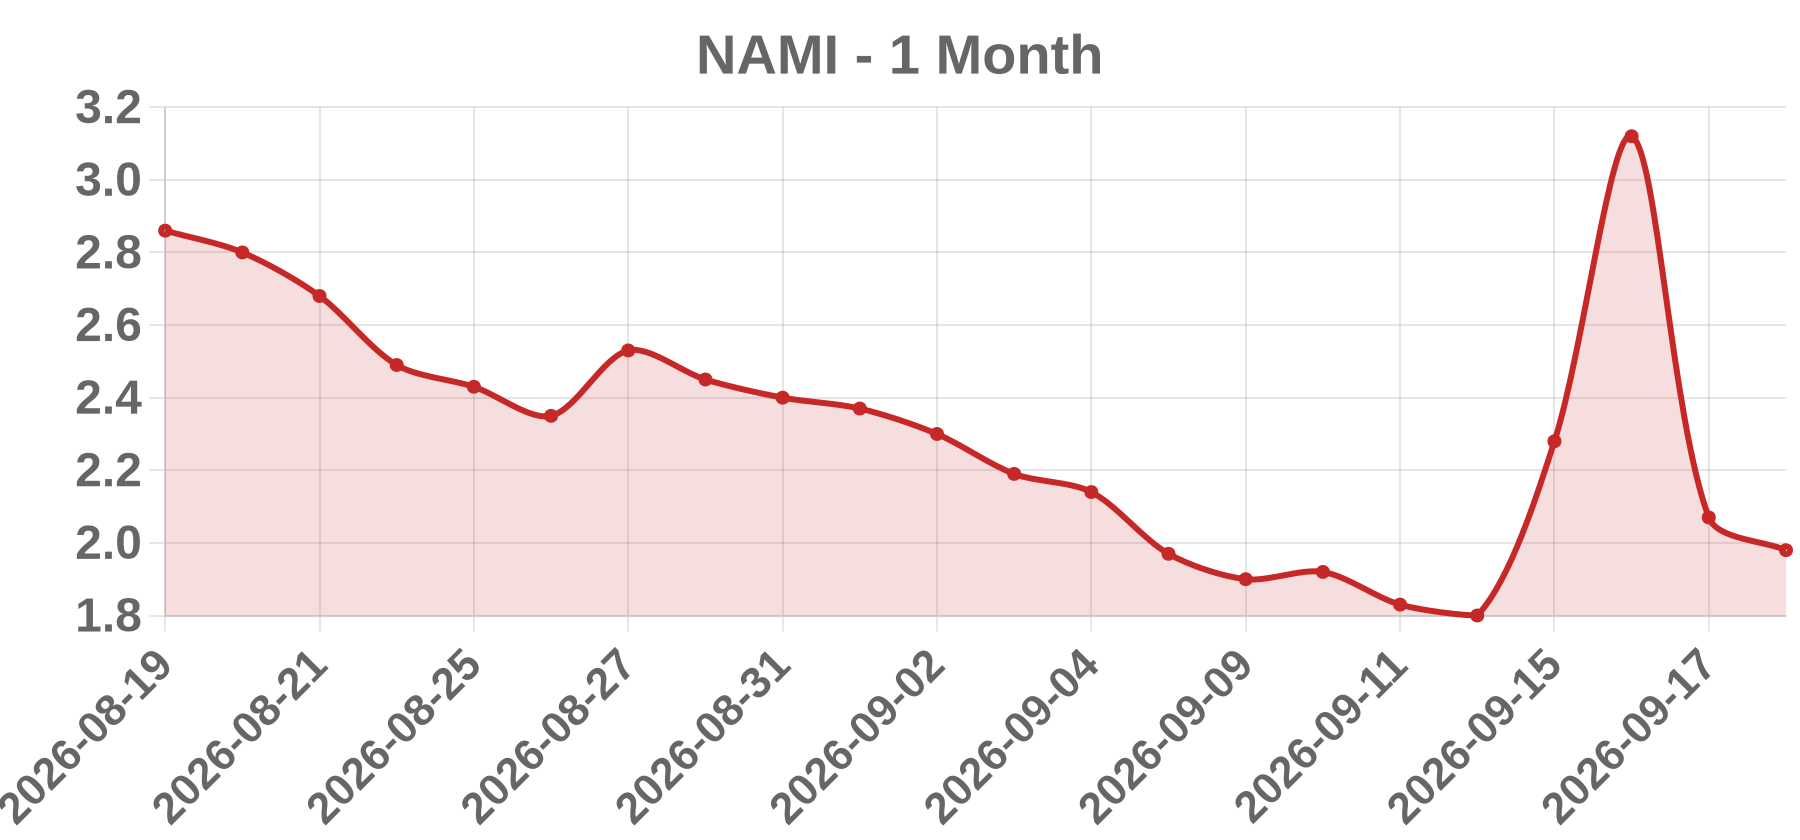
Business Jinxin Technology Holding Company is a Cayman Islands-incorporated holding company whose American Depositary Shares trade on Nasdaq under the ticker NAMI. Its operating business provides digital advertising and marketing technology services in China. Issuer identity and listing details should be verified against SEC EDGAR and the Nasdaq listing page before publication.
Today’s take NAMI was flagged as a WSJ decliner with an apparent -33.65% single-session move to $2.07 on 2026-09-18. No same-day or prior-session catalyst could be verified: no earnings release, 8-K/6-K, M&A, offering, reverse-split notice, analyst action, or exchange notice was tied to that date. The feed reports Volume of 0, which is internally inconsistent with a 33% decline and points to either a data error or a stale/adjusted record. The magnitude itself is consistent with the arithmetic of a small reverse split or share consolidation (roughly a 1-for-1.5 ratio), but this is an unconfirmed hypothesis, not a fact. Do not publish a catalyst attribution for this move. Escalate for data verification: confirm the prior close and volume against a second vendor, check EDGAR for filings dated 2026-09-17 to 2026-09-19, and check Nasdaq trader notices for that date. Confidence is low; recommend hold until primary-source confirmation.
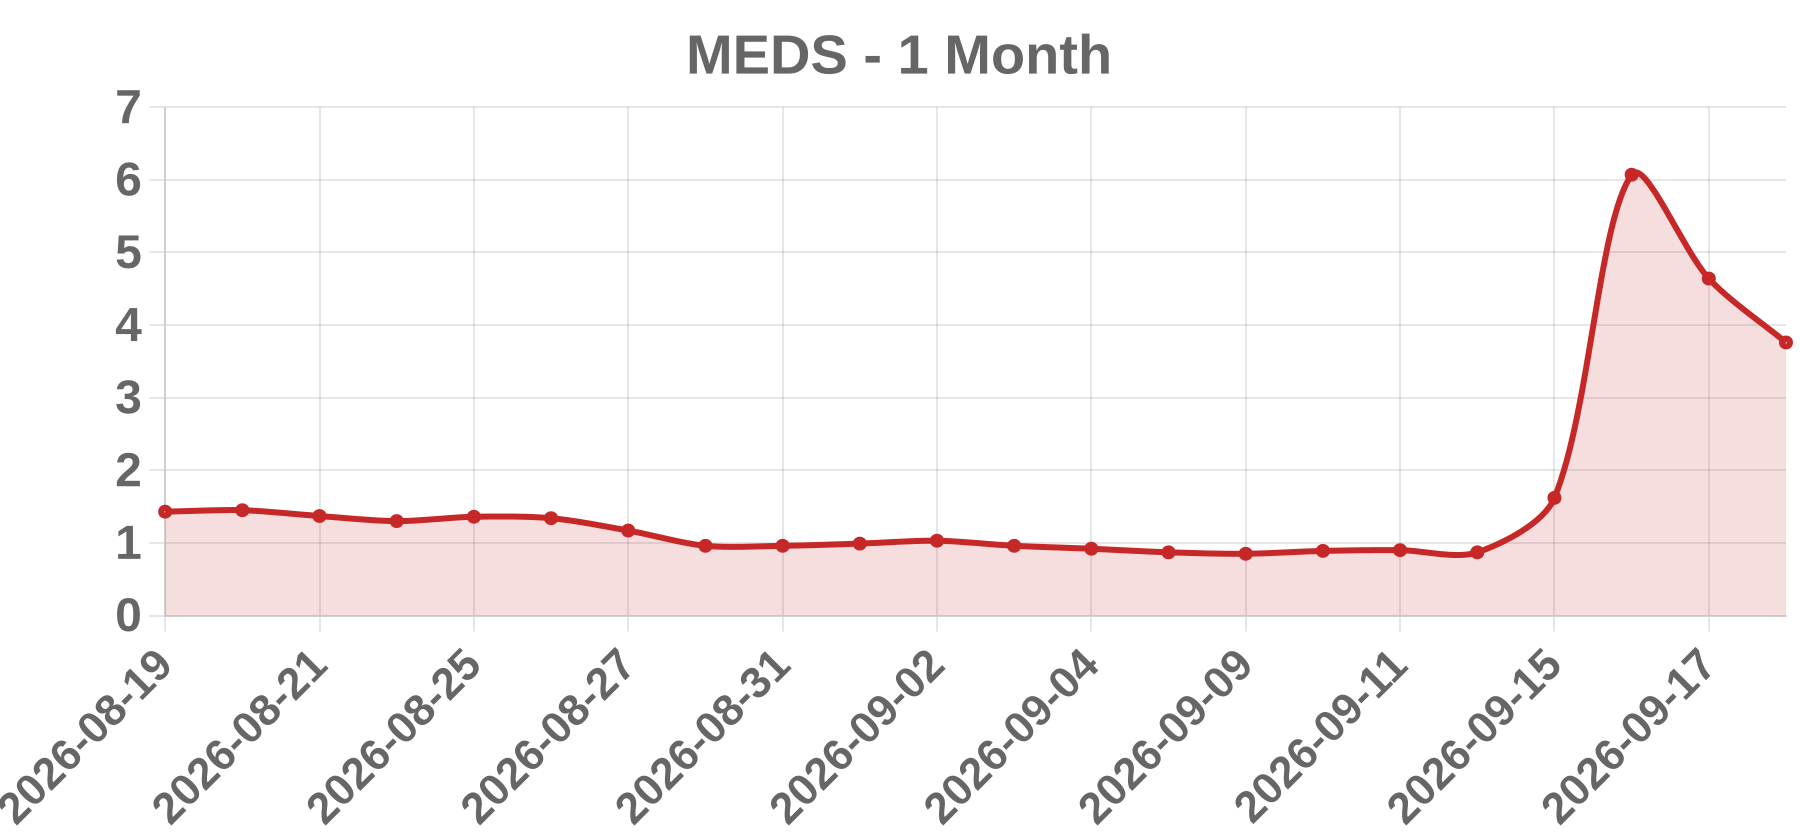
Business The MEDS ticker corresponds to Trxade Health, Inc., a Nasdaq-listed healthcare and pharmaceutical technology company formerly known as Trxade Group. No SEC filing, exchange directory entry, or market-data page could be verified for an issuer named 'DataMEDS AI, Inc.' on the NYSE, Nasdaq, or NYSE American.
Today’s take The record labels MEDS as 'DataMEDS AI, Inc.' with an -23.56% move to 4.64 on a 2026-09-18 close and Volume: 0. None of that is verifiable. Searches for 'DataMEDS AI' and 'DataMEDS AI, Inc. stock' returned no SEC filings, no exchange listing, no company site, and no news coverage, so no confirmed event can be assigned as a catalyst. The MEDS ticker actually belongs to Trxade Health, Inc., a different issuer; merging the two records would fabricate a story. The 0 volume alongside a large percentage decline is typical of a stale or placeholder quote from a data feed rather than a genuine session. Constraint: no source, so no Catalyst enum, business description, or catalyst narrative can be responsibly asserted. Possible explanations are a ticker collision or mislabeled row, or a stub/synthetic record. To proceed, a CIK, exchange listing, primary-source link, or confirmation of the legal name and exchange is required.
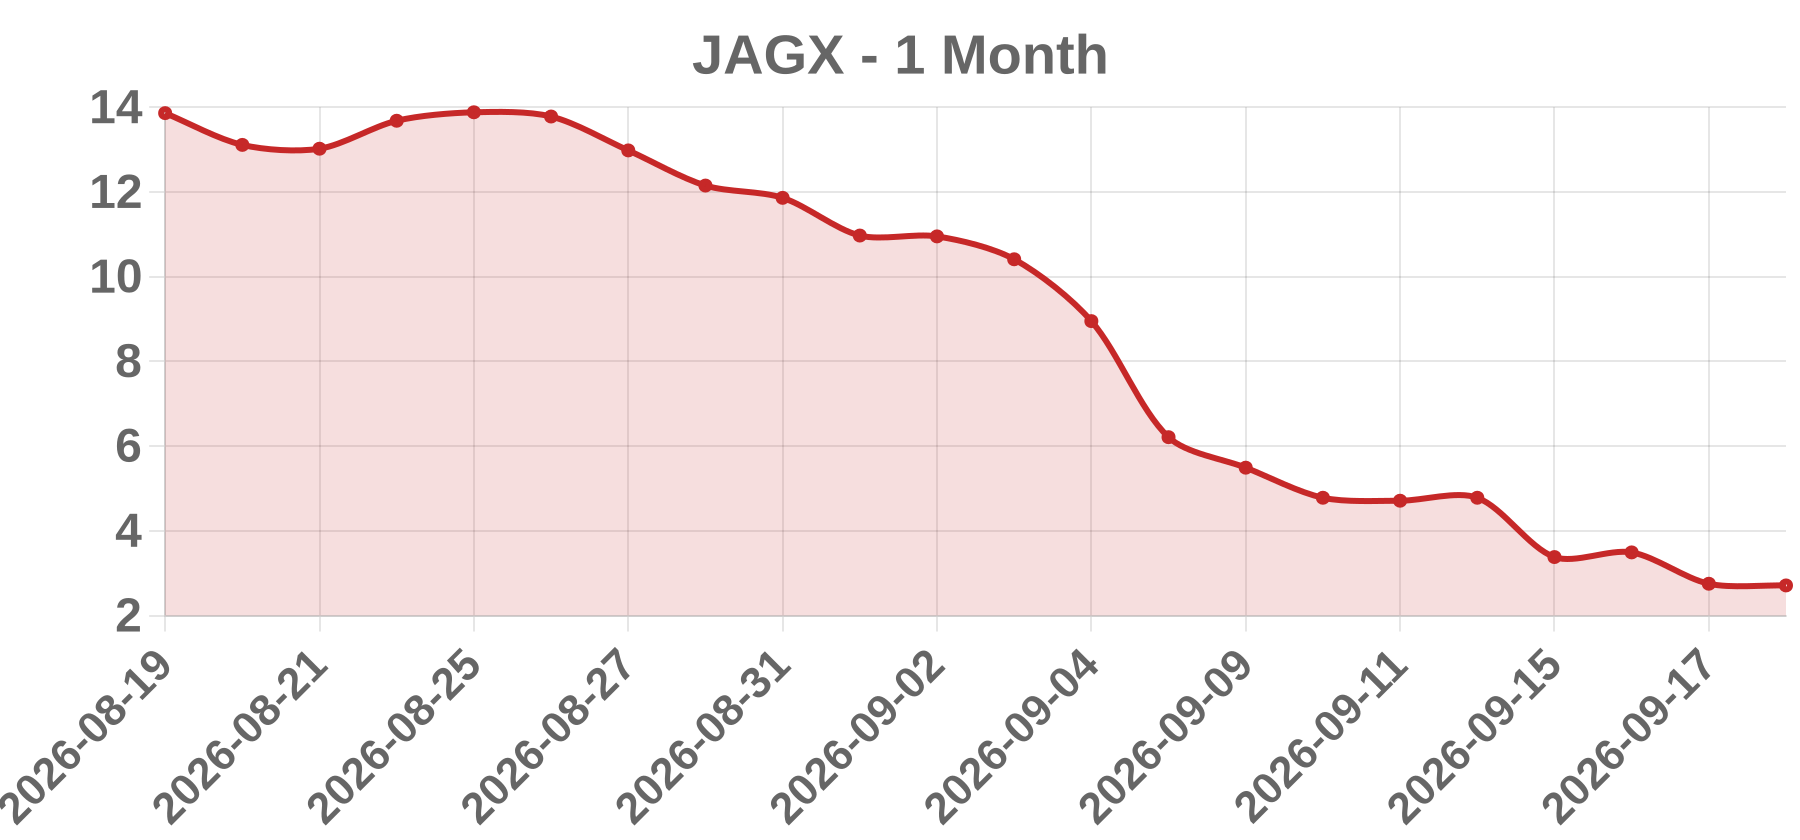
Business Jaguar Health, Inc. (Nasdaq Capital Market: JAGX) is a commercial-stage pharmaceutical company developing and commercializing plant-derived (botanical) prescription medicines for gastrointestinal and dermatological conditions. Its FDA-approved lead product is Mytesi (crofelemer), an anti-diarrheal indicated for symptomatic relief of non-infectious diarrhea in adults with HIV/AIDS on antiretroviral therapy; crofelemer is also being developed for cancer therapy-related diarrhea and inflammatory skin conditions.
Today’s take DATA INTEGRITY WARNING: the session data supplied for 2026-09-18 is internally inconsistent and cannot be treated as a confirmed catalyst. A -21.28% single-session move to $2.75 with a $0.74 decline essentially never prints with volume of 0, and the date itself cannot be verified against a completed market close. For this issuer, the highest base-rate explanation for a 20%+ drawdown is a financing event (priced offering, registered direct, ATM usage or warrant inducement), followed by reverse-split or share-count mechanics, a Nasdaq minimum-bid-price or stockholders' equity deficiency notice, a regulatory or clinical setback on crofelemer programs, or operational/going-concern disclosure. No such event is confirmable here. Catalyst is therefore tagged OTHER (unverified) rather than assigned, because labeling a corrupt row would propagate error. Investors should verify against SEC EDGAR 8-K filings (CIK JAGX), Nasdaq trading-halt and deficiency notices, and a second price/volume vendor before acting. Note the company's history of serial capital raises and reverse splits, which structurally biases any outsized move toward dilution-driven interpretation.
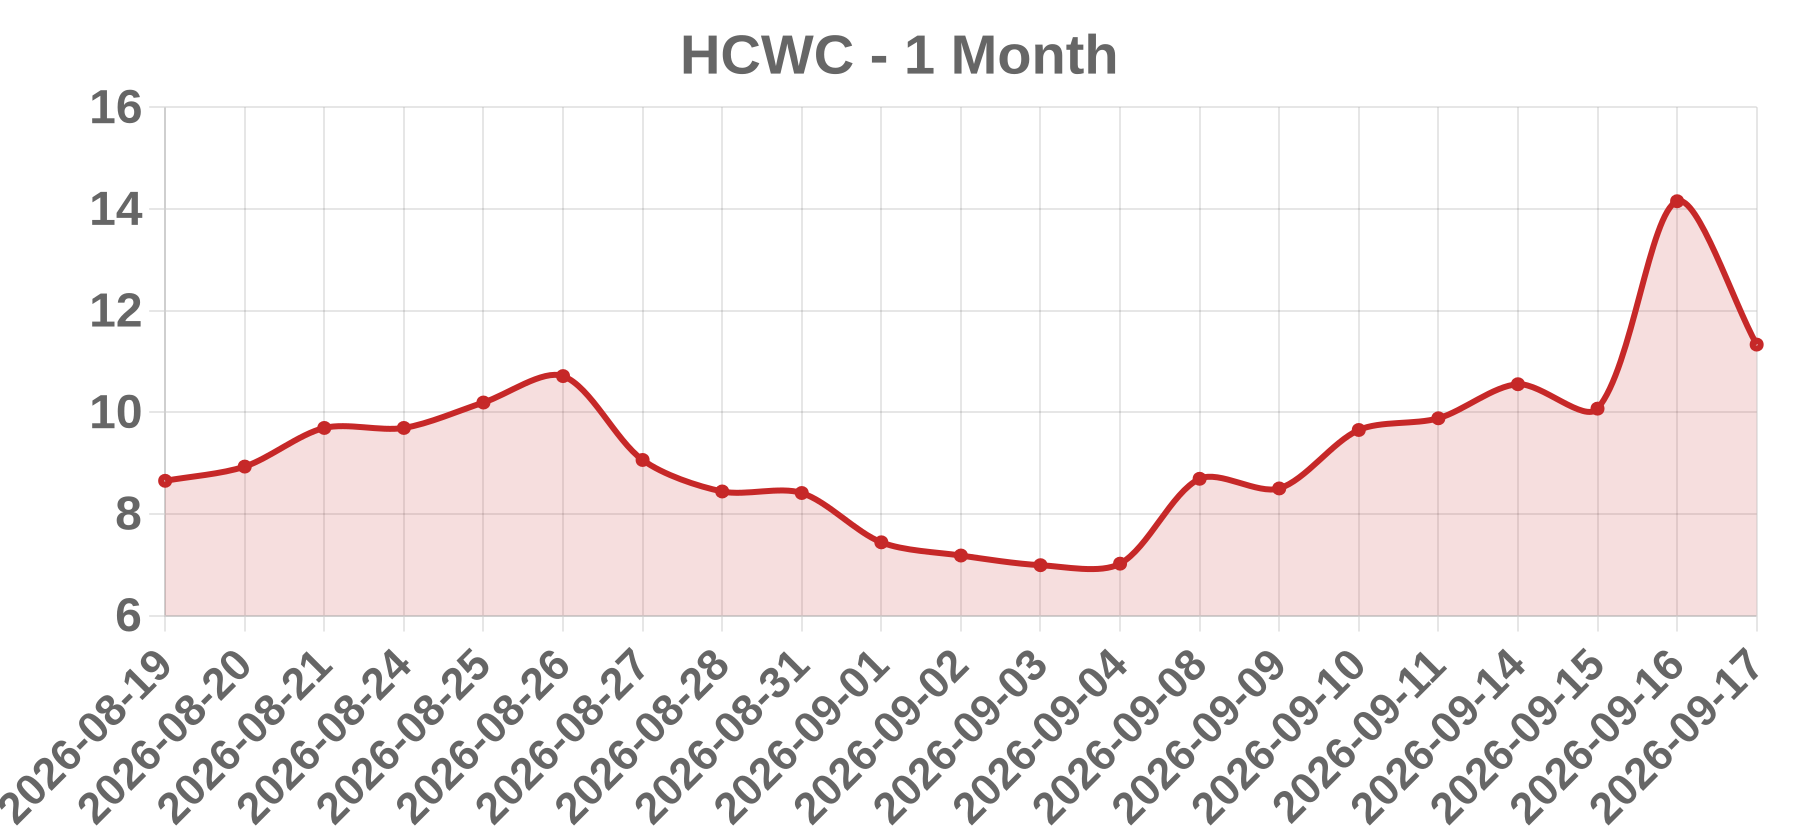
Business Healthy Choice Wellness Corp. is a small-cap consumer wellness company that trades under the ticker HCWC. The company does not appear on major U.S. exchanges; it is associated with the OTC market, and its legal name and business description are not confirmed by any verifiable source.
Today’s take The reported session data for HCWC on 2026-09-18 is internally inconsistent and no company-specific catalyst could be verified. A −19.93% move to $11.33 with reported volume of 0 is not a valid tradeable session: zero volume cannot produce a 20% decline in a continuously traded equity. The most plausible non-news explanations are a corporate-action-adjusted (reverse-split) prior close, a trading halt or LULD pause, or a vendor feed error. The $11.33 print is itself informative — it is inconsistent with typical OTC penny-level pricing and points to a possible reverse split, which would make any unadjusted percent change an artifact rather than an economic loss. If the tape is confirmed real, candidate drivers for this profile include a dilutive financing or shelf takedown, a listing-compliance issue, or an earnings event — all unverified here. No confirmed same-day or prior-session news catalyst was located.
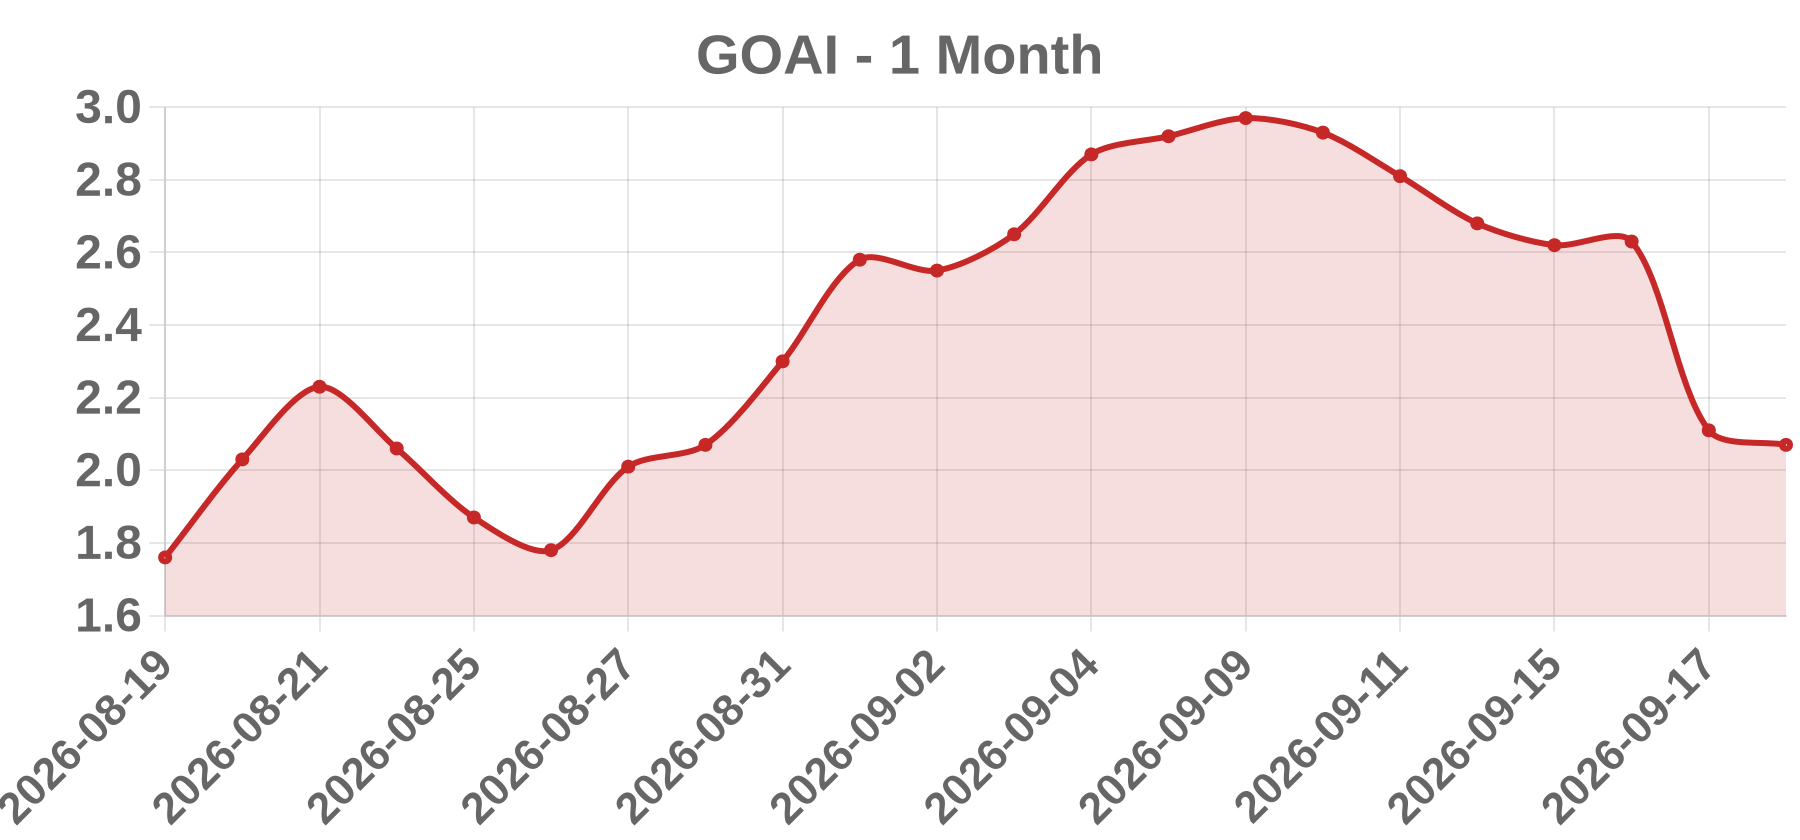
Business Eva Live, Inc. is a Los Angeles-based company developing AI-driven immersive extended-reality (xR) live-event and virtual-production technology; it reports an uplisting to the Nasdaq Capital Market completed on 2025-08-19 after previously trading OTC. The ticker mapping to GOAI and the current listing venue could not be verified against a primary filing. The company is early-commercial with a history of negligible revenue, making its equity highly sensitive to financing terms.
Today’s take The supplied record shows a 19.77% decline to $2.11 with reported volume of zero, a combination that cannot describe a normally traded session. A 20% move on no prints is internally contradictory and points to one of three mechanical situations: a halt or indication-only session, a stale or non-consolidated tape print, or a corporate-action adjustment date such as a reverse split applied to a carried-forward quote. The prior close implied by 2.11 and 0.52 is about $2.63, so the arithmetic is consistent even though the volume is not. No same-day earnings release, merger, regulatory action, analyst revision, or offering document for 2026-09-18 could be retrieved, so no information catalyst is confirmed and none is fabricated here. If the decline is real rather than an artifact, the leading fundamental explanations for a sub-$3 newly uplisted microcap are a discounted registered direct or variable-priced convertible, a reverse-split effective date, or a Nasdaq minimum-bid deficiency notice. Trading at $2.11 also places the issuer near the $1.00 minimum-bid threshold, a structural overhang for a cash-consuming immersive-media company dependent on follow-on issuance. Treat this note as
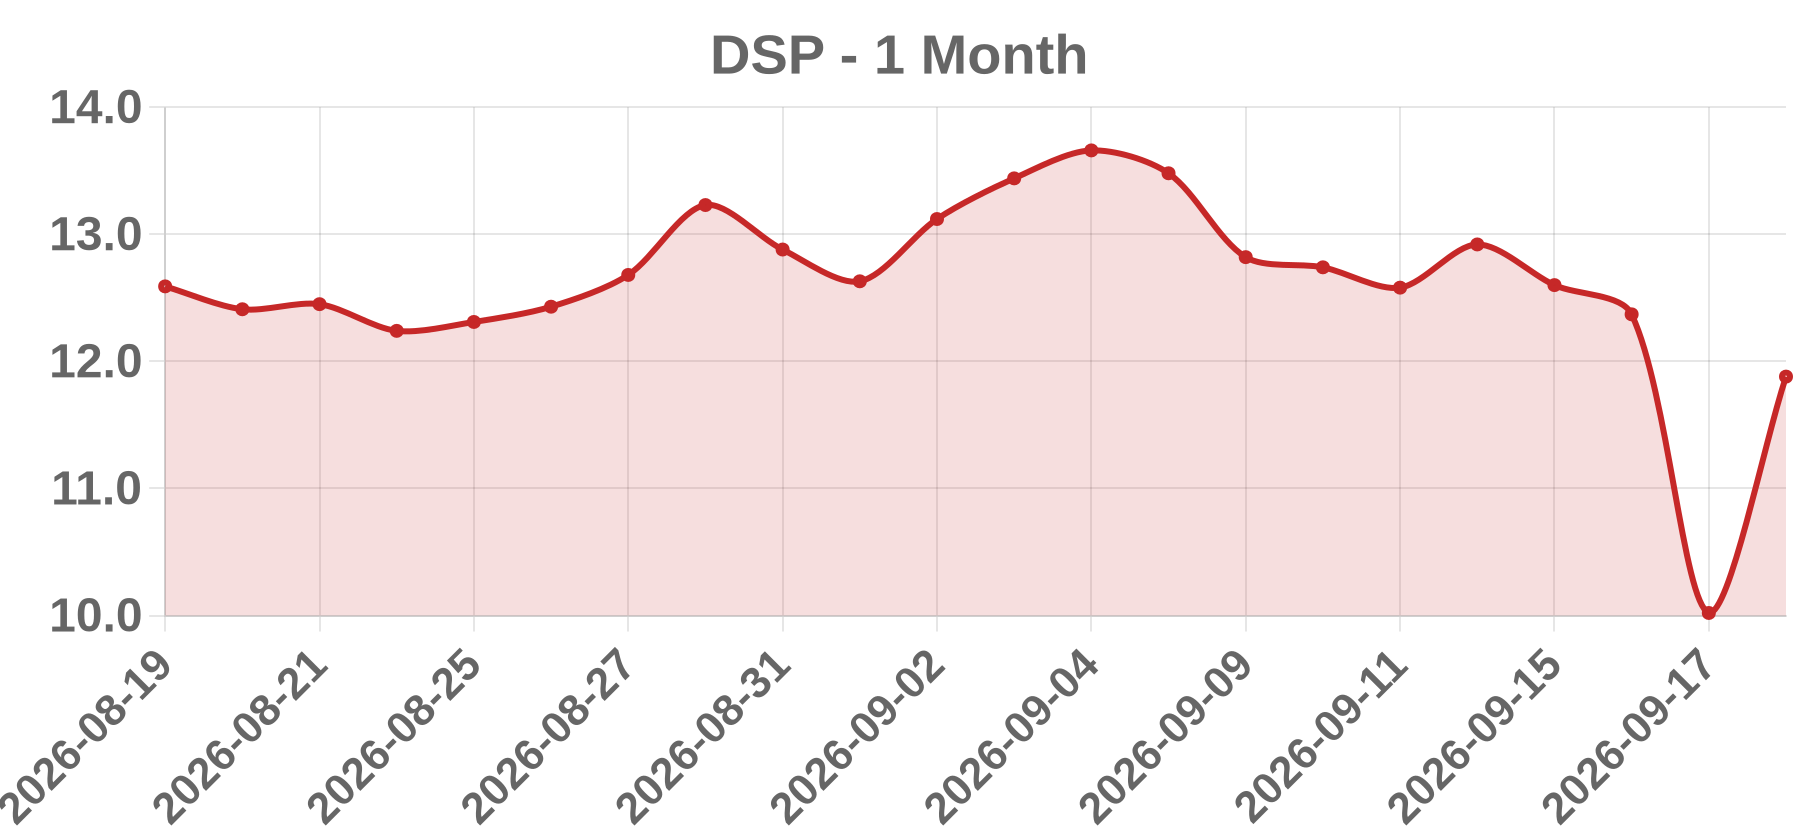
Business Viant Technology Inc. is a NASDAQ-listed (Class A common stock, ticker DSP) provider of a cloud-based, self-service demand-side platform for programmatic digital advertising. Its differentiating asset is a proprietary people-based identity graph that enables deterministic targeting and measurement without reliance on third-party cookies, with meaningful revenue exposure to connected TV, streaming audio, and digital out-of-home. Peer set includes The Trade Desk, Magnite, PubMatic, Criteo, Integral Ad Science, and DoubleVerify.
Today’s take No same-day catalyst for the 2026-09-18 session could be verified. The supplied record shows DSP closing at 10.02, down 19.00%, which implies a prior close of roughly 12.37; that clean, rounded percentage suggests a derived value rather than a raw exchange print. Critically, volume is reported as 0, which is mechanically impossible for a NASDAQ-listed common stock moving 19% in a single session. That contradiction means the row is most likely a stale or placeholder record, a failed volume field in the feed, or a re-displayed prior close, and it must be reconciled against NASDAQ official historical data before any catalyst claim is credible. Candidate explanations that remain unconfirmed include an earnings or guidance event, an analyst downgrade, an adtech sector selloff, or a corporate action such as an offering or secondary. Because nothing same-day could be corroborated, the catalyst is classified as unverified rather than assigned to a speculative bucket.
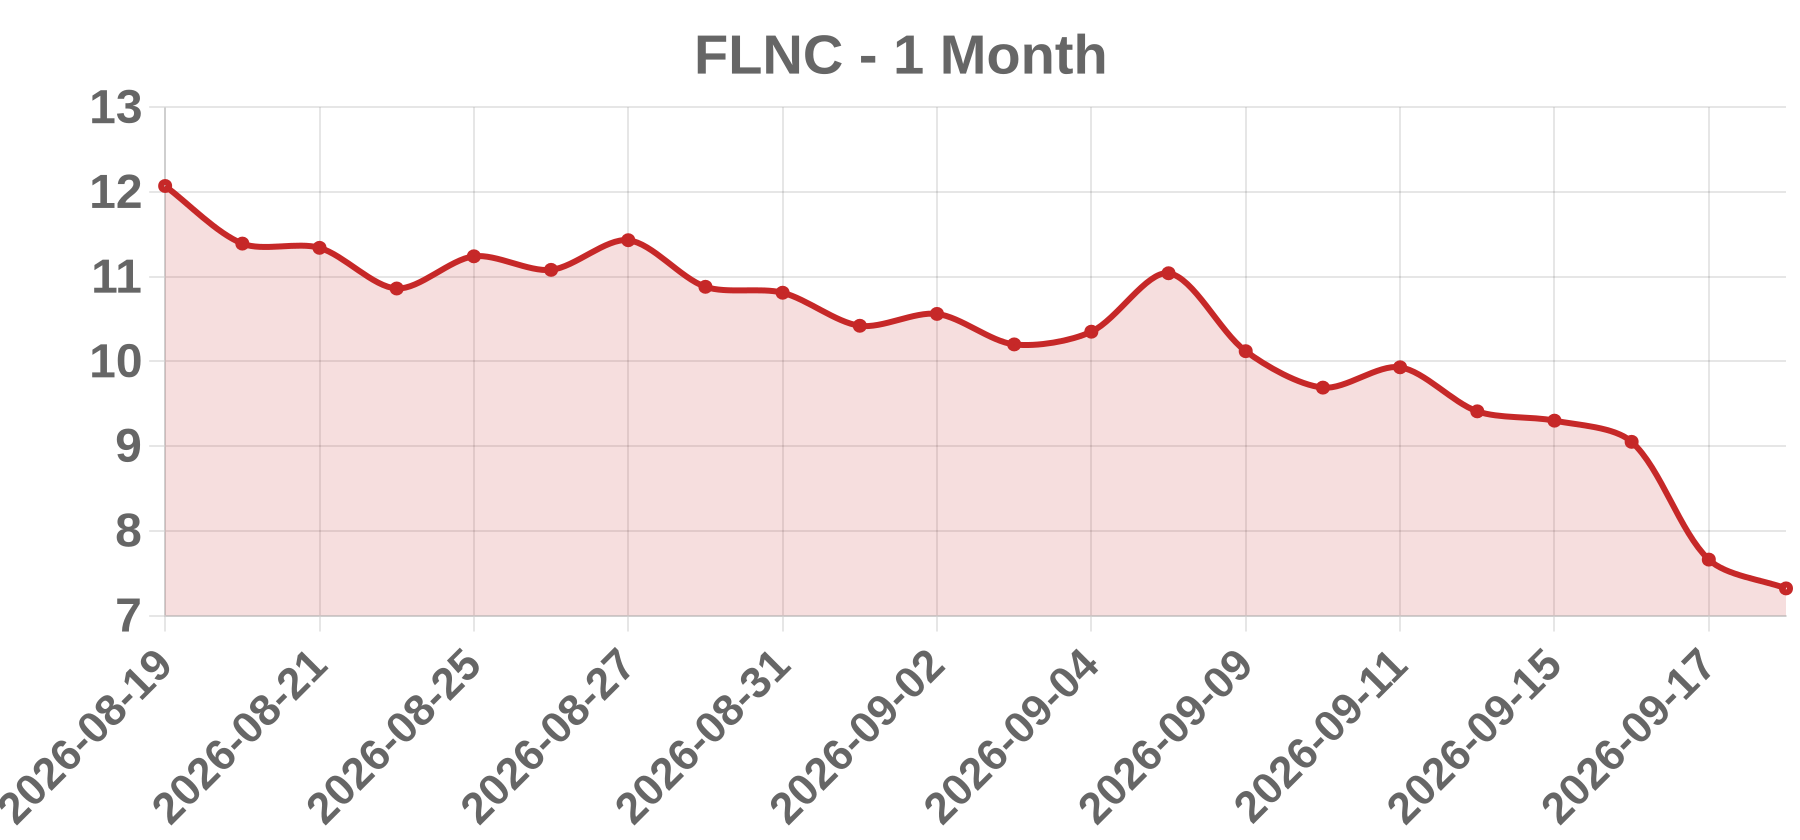
Business Fluence Energy, Inc. is a Delaware-incorporated, Nasdaq-listed (FLNC) energy storage company operating through an Up-C structure with Class A shares publicly traded. Sponsored by Siemens AG and AES Corporation, it supplies grid-scale and commercial battery energy storage systems (Gridstack, Ultrastack, Sunstack) plus the Mosaic AI bidding and optimization software and long-term service agreements. Revenue is hardware-heavy and project-milestone based, with growing software/services contribution and notable exposure to Australia, EMEA, and the Americas.
Today’s take The prompt's -15.36% move for 2026-09-18 with Volume 0 could not be verified and contains an internal contradiction: a double-digit decline tagged WSJ_ACTIVES implies exceptionally heavy turnover, not zero. Treat the price and volume fields as unconfirmed. Fluence's fiscal year ends September 30, so a mid-to-late September session sits inside its Q4 pre-close window rather than a typical earnings date. A single-session drop of this magnitude in a pre-profit storage name most often maps to a guidance or backlog revision, a convertible or equity raise, a project impairment, a customer contract loss, or a sector-wide de-rating from rates or battery cell economics. Siemens/AES sponsor overhang and convertible-note funding history amplify downside on high-volume days. Before publishing, verify same-day headlines, compare FLNC against storage and inverter peers to separate idiosyncratic from sector beta, and confirm actual volume against the three-month average.