US common stocks / ADRs: top 10 by volume; top 10 gainers (by % change, volume as tie-breaker); top 10 losers (by % change, prefer liquid names). Deep notes cover the de-duplicated set across the three boards.
30 names on this page · volume 10 · gainers 10 · losers 10
Order: volume board → gainers → losers; each ticker appears once. Summaries of public information only — please verify primary sources.
1/10PCG PCG
+5.95%
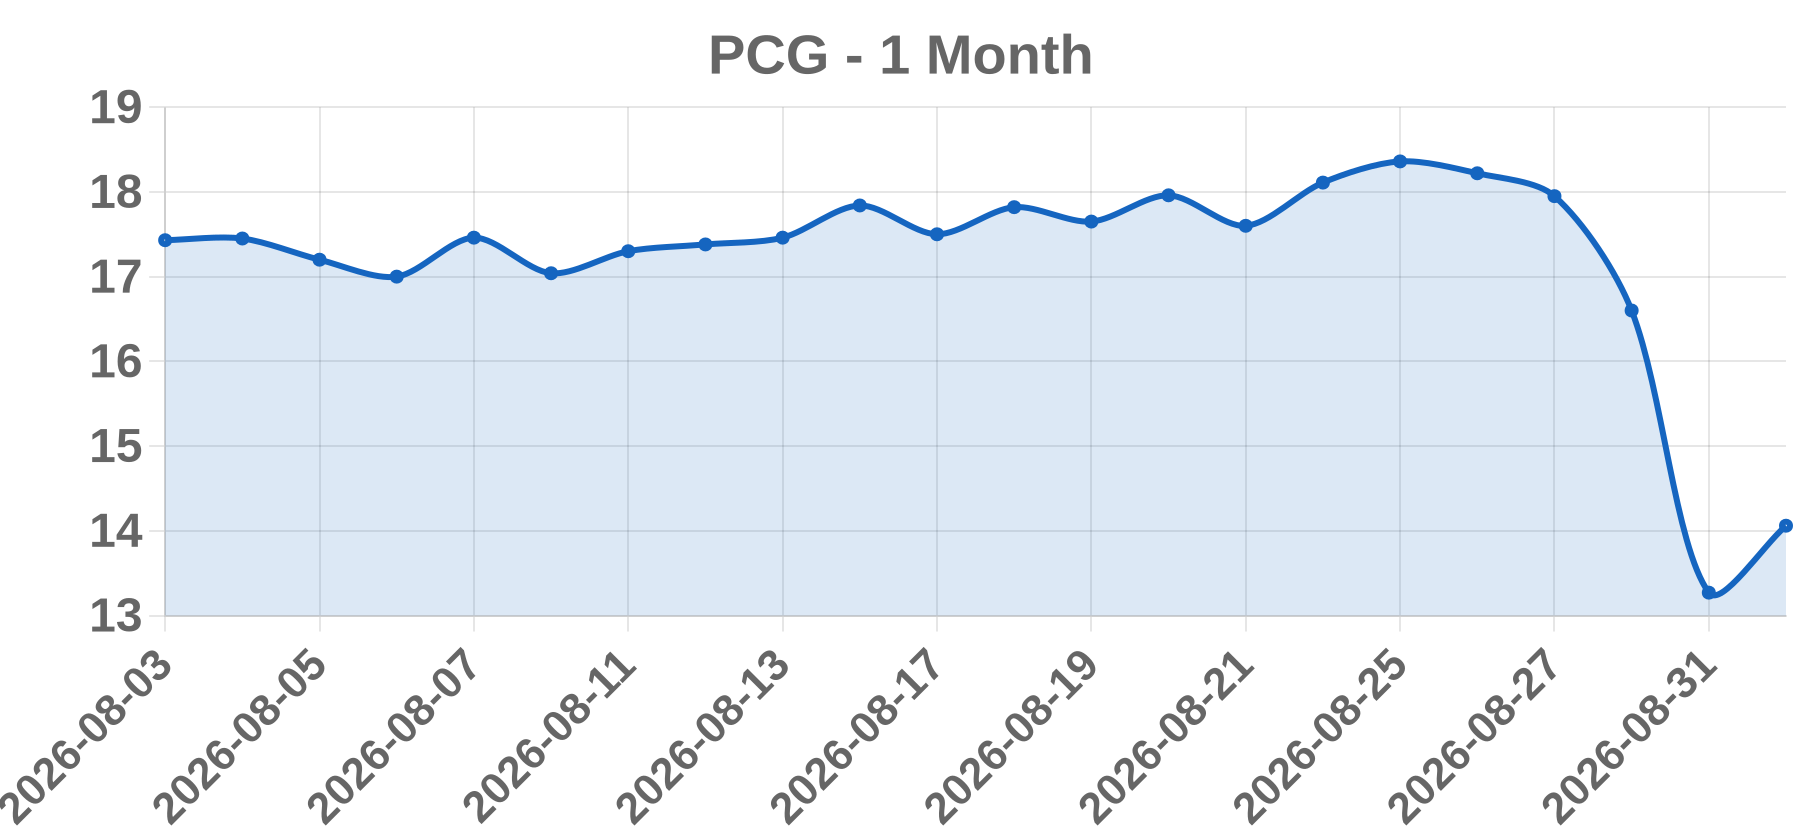
Close 14.06 · Vol 144.51M · Type: Sector
Approx. 1-month price (illustrative)
Business PG&E Corporation is a holding company listed on the New York Stock Exchange (NYSE: PCG) whose primary operating subsidiary is Pacific Gas and Electric Company, a regulated combined natural-gas and electric utility. It generates, transmits, and distributes electricity and delivers natural gas across northern and central California, serving roughly 5.3 million electricity and 4.6 million gas customers in 47 of the state's 58 counties.
Today’s take PCG closed at $14.06 on Sept 1, 2026, +5.95%, a heavy-volume technical rebound following an ~20% single-session crash the prior day (Aug 31: $13.27 close, -20.06%, 153M shares). The selloff was triggered by California lawmakers rejecting Gov. Newsom's wildfire-liability reform (SB 492), which omitted the proposed $6 billion per-incident liability cap and left utility wildfire exposure uncapped beyond 2030. On Sept 1, the stock opened at $13.30 near its $13.05 52-week low, rallied to an intraday high of $14.79, and closed at $14.06. Even as the stock rebounded, same-day news stayed negative: BofA downgraded PCG to Neutral from Buy, cutting its target to $13 from $24, joining Mizuho (Neutral, $16) and BMO (Market Perform). No earnings, guidance, or upgrade catalyst explains the move — it reflects volatile repositioning/short-covering, with beta ~0.28 and a consensus still 'Buy' ($20-25 targets).
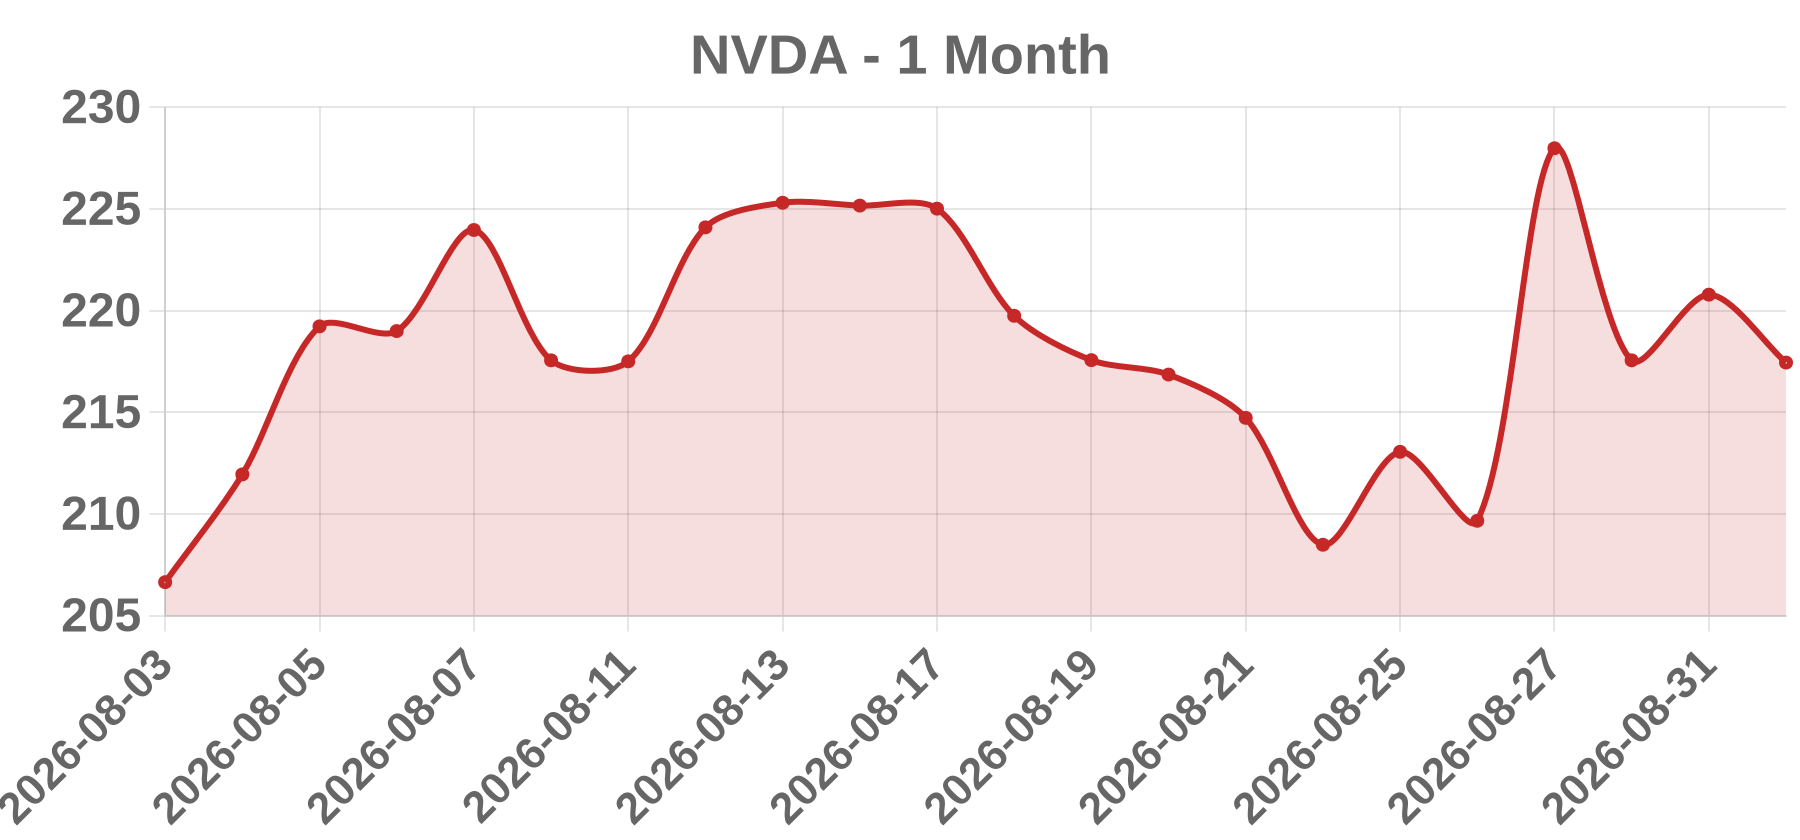
Business On September 1, 2026, NVIDIA (NVDA) fell 1.51% to close at $217.44 on volume of ~109.3 million shares. The session was dominated by a broad macro-driven risk-off environment rather than company-specific negatives. A fresh wave of U.S. military strikes on Iranian Islamic Revolutionary Guard Corps targets (following recent IRGC attacks on commercial shipping in the Strait of Hormuz) spiked crude oil roughly 5% to above $90/bbl, rekindling inflation concerns. Concurrently, an ongoing global bond selloff pushed the 10-year Treasury yield to about 4.8%, a nearly two-decade high, further pressuring long-duration growth valuations. These twin forces — higher oil and higher yields — drove a broad tech/semiconductor selloff: AMD fell ~2%, Intel ~3%, with NVDA declining in line. Sector-specific over
Today’s take NVDA's ~1.5% decline on September 1, 2026 was primarily a beta-driven pullback within a broad macro risk-off, not a company-specific fundamental deterioration. The U.S.-Iran strike escalation spiked oil and lifted Treasury yields toward 4.8%, tightening financial conditions and reviving Fed-hike expectations — the dominant driver. As a high-beta (~2.2) mega-cap with heavy AI-complex exposure, NVDA absorbed the brunt of the sector rotation out of expensive, long-duration technology. Contributing company/sector factors included the NVHBM competitive narrative (Nvidia pushing into Broadcom/Marvell custom-silicon territory), and Texas' scrutiny of a possible ~700GW 'ghost demand' pipeline for data centers, which introduced incremental skepticism about the durability of the AI infrastructure supercycle. However, supportive news (the $3.5B MediaTek convertible investment to broaden its custom-XPU/ecosystem reach and the $35B Anthropic/Lambda compute deal) provided partial counterweights, keeping losses roughly in line with the sector rather than outsized. Net assessment: the move was macro- and sentiment-driven, consistent with a broadly weak tape for semis; the fundamentals remain intac
Business NIO Inc. (NYSE: NIO; HKEX: 9866; SGX: NIO) is a Cayman Islands-incorporated leader in the premium smart electric vehicle (EV) market, founded in November 2014 and headquartered in Shanghai, China. It designs, develops, manufactures and sells smart EVs under three brands — NIO (premium), ONVO (family) and FIREFLY (compact) — and operates one of the industry's largest battery-swap networks (4,000+ stations).
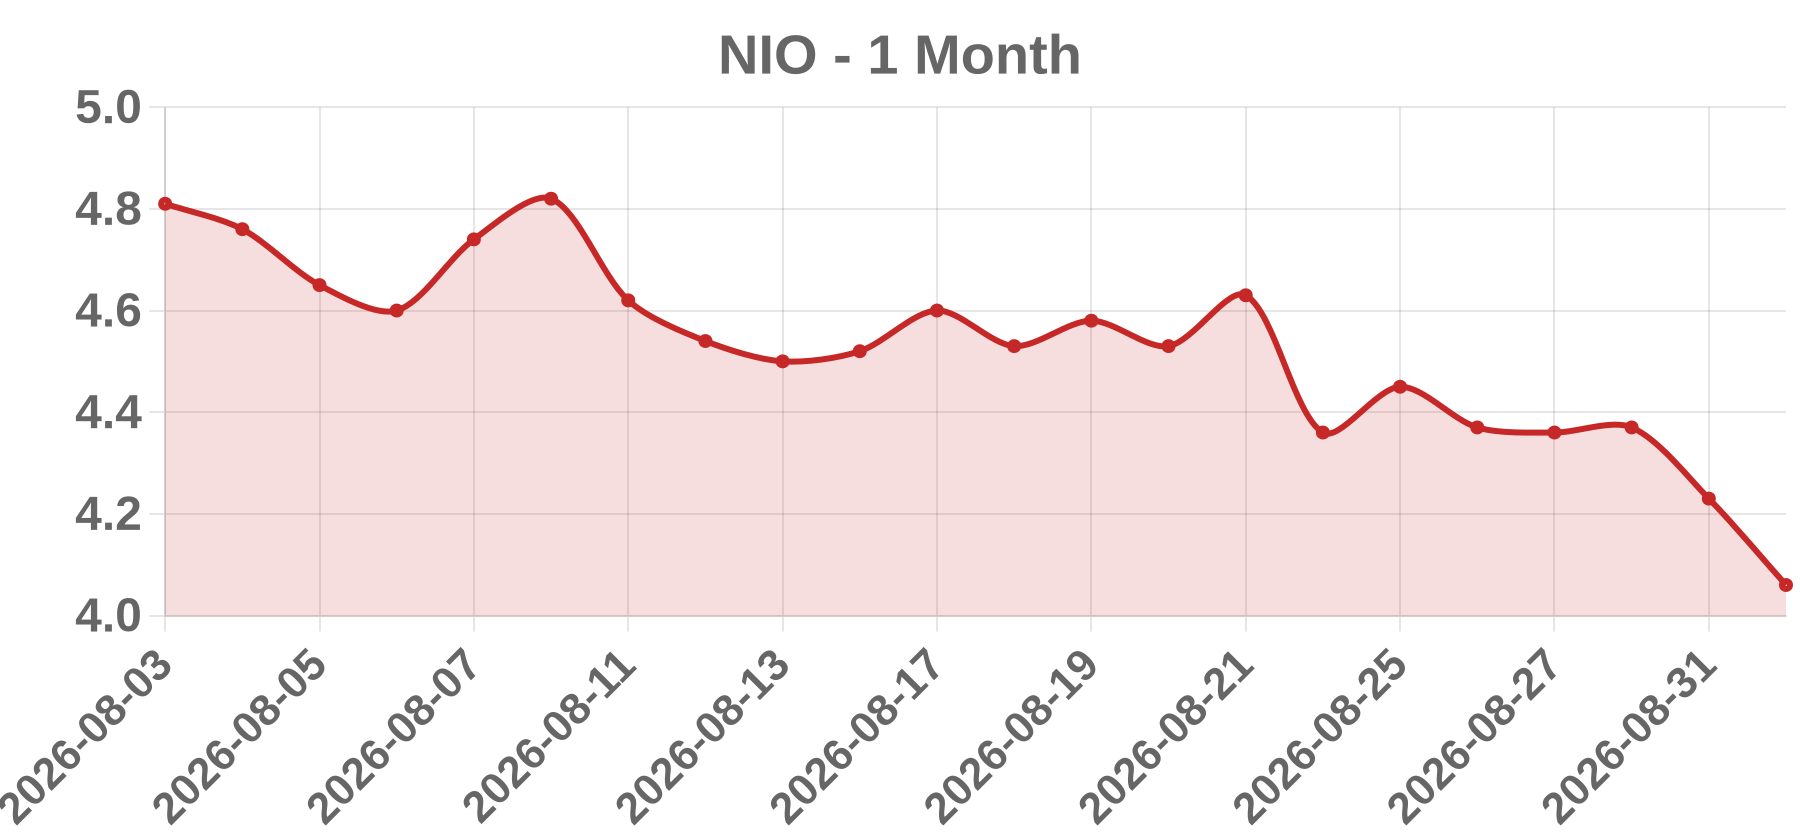
Today’s take NIO shares fell 4.02% on September 1, 2026 after the company released two pre-market disclosures: Q2 2026 results and the August delivery update. Q2 revenue of RMB32.14B ($4.74B) grew 69.1% YoY but missed the ~$4.78B consensus. The key negative was Q3 guidance: 108,000-111,000 deliveries (~11% below the ~123,000 consensus) and Q3 revenue midpoint trailing Street estimates by ~5%. August deliveries of 35,836 units (+14.5% YoY) missed, with the ONVO sub-brand slumping 46.4% YoY to 8,810 units — its third straight monthly decline — while the core NIO brand doubled to 21,174. Vehicle margin of 18.5% improved from 10.3% YoY but slipped from 18.8% in Q1, and gross margin fell to 18.4% from 19.0%, signaling price-war and cost pressures. Offsets included a third straight adjusted net profit (RMB26.1M) and RMB56.7B cash, while the stock hit a fresh 52-week low of $3.99 and HK shares plunged >10% to a 13-month low.
Business Intel Corporation (NASDAQ: INTC) designs, develops, manufactures, markets, and services computing and related products globally across three reportable segments: Intel Products (client computing, data center and AI, network and edge), Intel Foundry (advanced chip manufacturing), and All Other. The company competes with TSMC in foundry services and focuses on AI infrastructure, HBM memory manufacturing, and US fab capacity expansion.
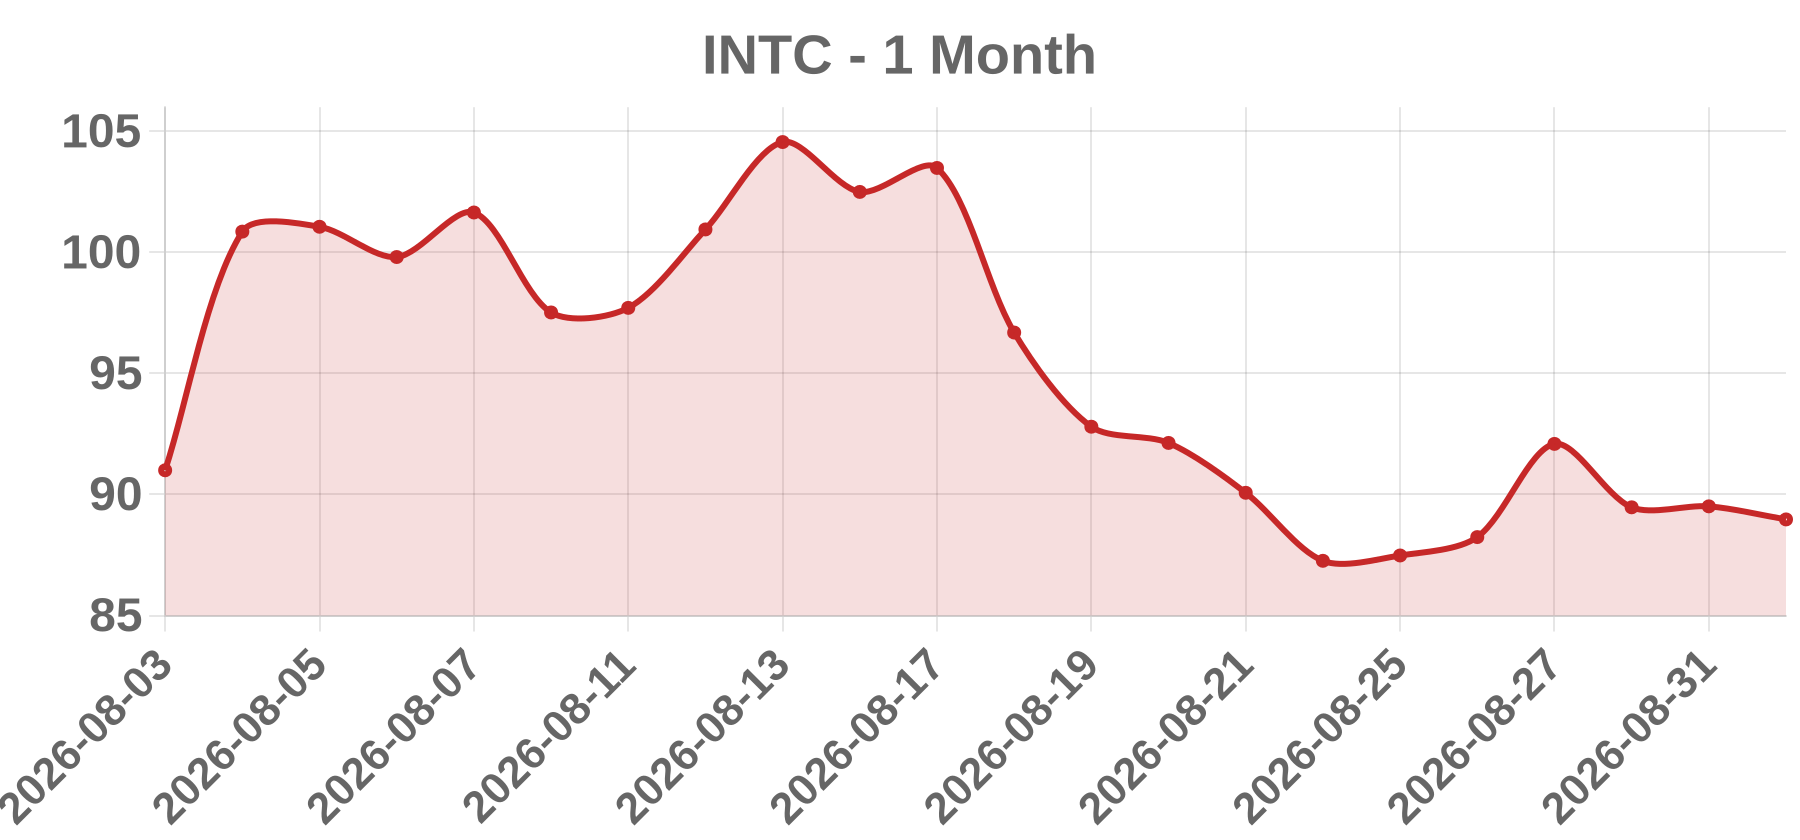
Today’s take Intel fell 0.60% ($0.54) to close at $88.97 on Sept 1, 2026, driven by macro headwinds rather than company-specific news. A global bond selloff lifted the 10-year Treasury yield to a multi-year high (~4.8%), stoking inflation fears and a high likelihood of a September rate hike, triggering broad risk-off in the semiconductor complex. The PHLX Semiconductor Index fell ~3%. Peers were hit harder: AMD closed down 2.36% ($459.61), Qualcomm down 2.27% ($166.61), and Nvidia down ~2.3%. Intel actually OUTPERFORMED the group, recovering in after-hours trading. Context: the prior session (Aug 31) Intel rose premarket on reports SK Hynix was weighing Intel Foundry for HBM4E base dies (SK Hynix later disputed parts). A lingering overhang was the ~$20B equity offering priced at $95/share (Aug 10-12), leaving the stock ~6.8% below offer price. The decline was purely sector/macro-driven beta, with Intel showing relative resilience.
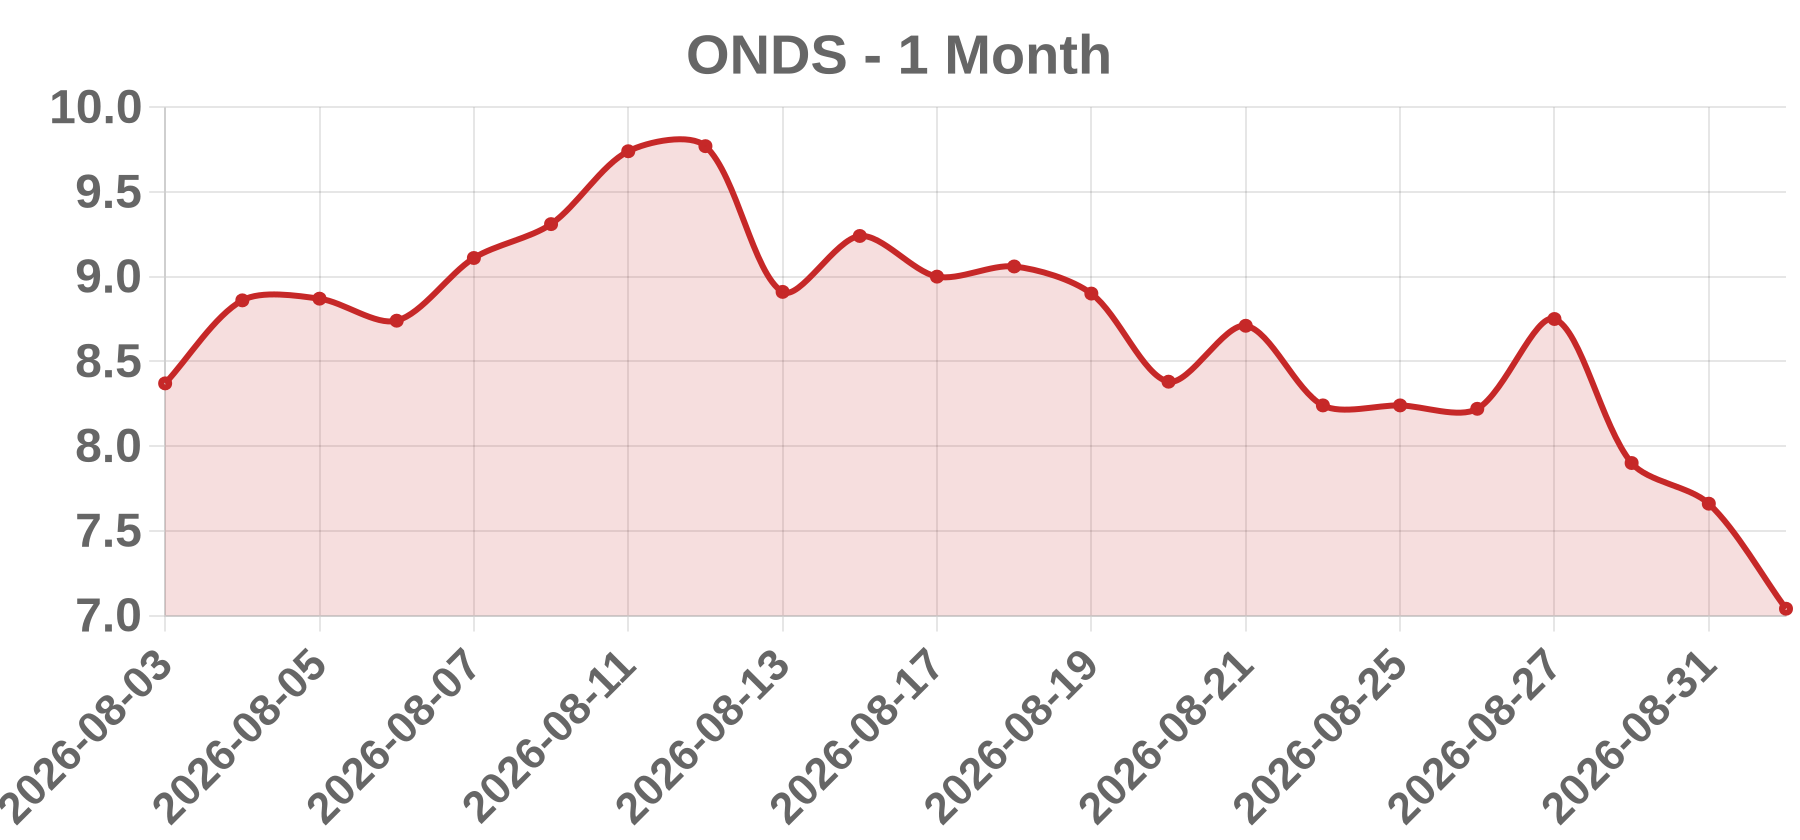
Business Ondas Holdings Inc. (NASDAQ: ONDS), headquartered in West Palm Beach, Florida, is a defense-technology and autonomous-systems company. It operates through two segments: Ondas Autonomous Systems (AI-powered defense, counter-UAS, ISR drones and unmanned platforms via brands such as Optimus, IonStrike/DZYNE, World View and Cyberhawk) and Ondas Networks (software-defined wireless broadband for mission-critical industrial networks).
Today’s take On Sept 1, 2026 ONDS closed at $7.04, down 8.03% (-$0.61), after opening ~$7.43 and grinding lower all day with no single same-day headline. The session decline was driven primarily by risk-off selling cascading through the drone/defense complex (Red Cat -3%, per 24/7 Wall St), extending a ~22% YTD slide. It was compounded by record-high short interest of 42% of float (~$1.89B, up from 4% a year ago; S3 Partners crowded score ~90), fresh equity-supply overhangs (an Aug 10 prospectus supplement registering 584,649 resale shares tied to the Cyberhawk/World View acquisitions, plus multiple Form 144 insider sale filings), and lingering sentiment from the Aug 13 Q2 miss (net loss $0.19 vs. $0.13 consensus; ~$89.7M net loss) and skepticism over the aggressive implied $244M Q4 revenue test hidden in FY2026 guidance of $525-550M.
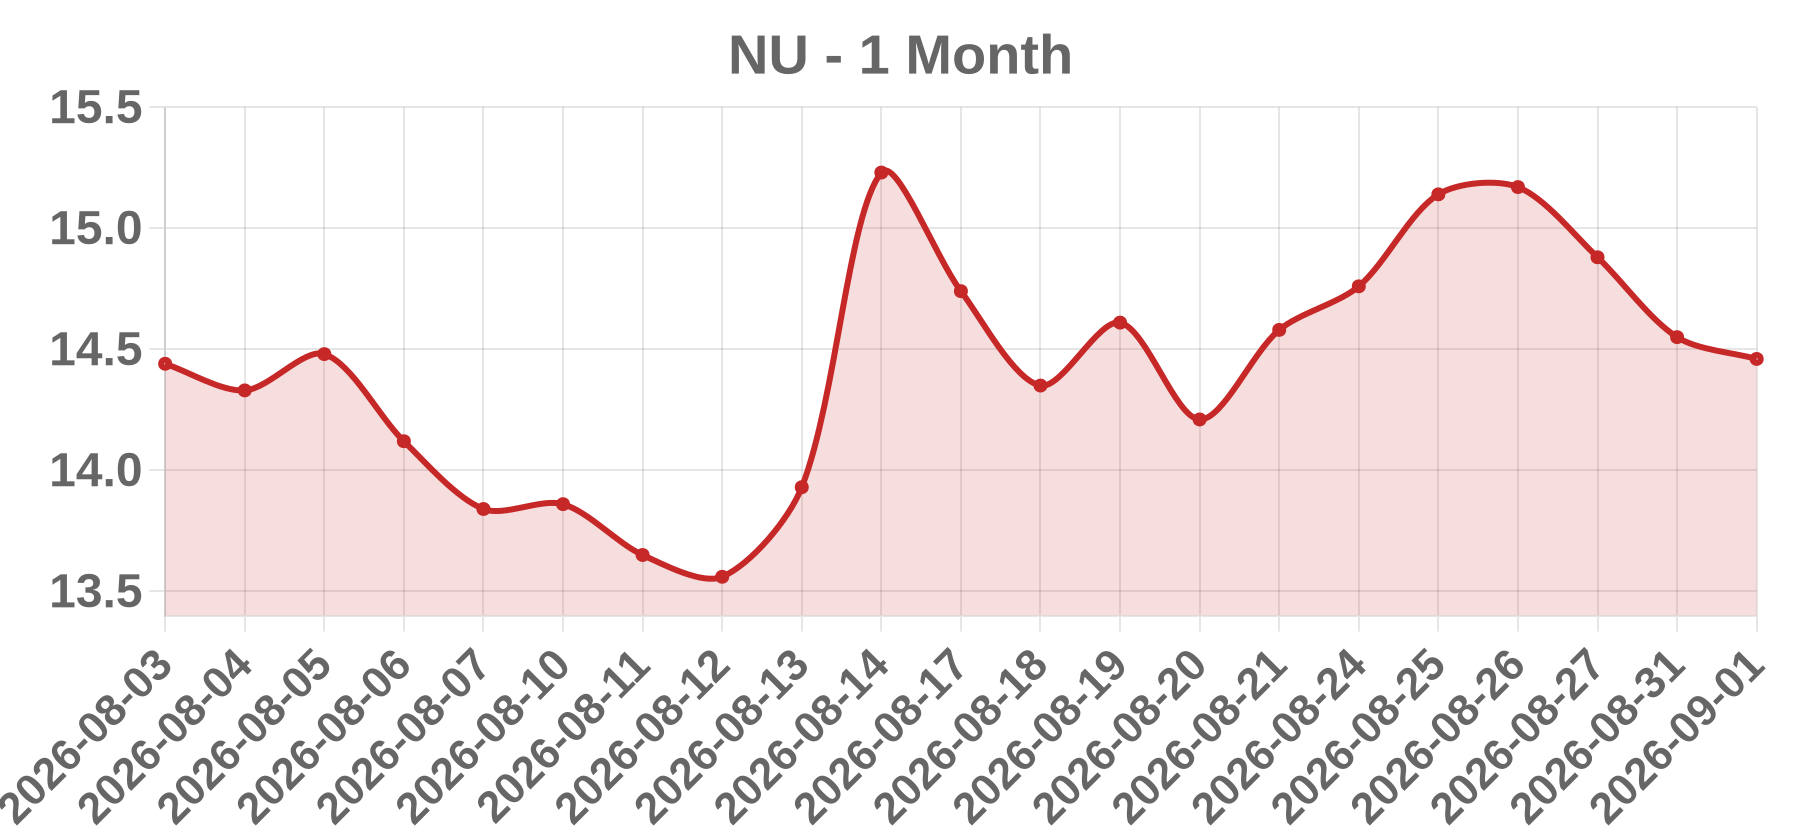
Business Nu Holdings Ltd. (NYSE: NU; Cayman Islands-incorporated, headquartered in São Paulo, Brazil) is the holding company for Nubank, one of the world's largest digital financial services platforms, operating across Brazil, Mexico, and Colombia. It offers digital accounts, credit/prepaid cards, payments, lending, investments, and insurance, serving ~139 million customers as of Q2 2026. Class A ordinary shares listed on the NYSE since December 2021.
Today’s take The Sept 1, 2026 session (close $14.46, -0.62%) was a continuation of the post-Q2-earnings valuation/credit-quality repricing rather than a discrete same-day event. NU opened down ~1.2% premarket at $14.37 as markets weighed its trailing P/E of ~19.81x against banking peers Itaú (9.55x) and Inter & Co (8.11x), alongside a rising 90-day-plus delinquency ratio of 6.9% (from 6.5%). Q2 2026 (released Aug 12) delivered record net income of $1.06B (+49% YoY) and revenue of $5.88B (+39% FX-neutral), but credit expansion into new segments lifted credit risk. The stock had fallen 3.9% to $14.30 on Aug 28 on bad-loan concerns, rebounded 1.75% on heavy volume Aug 31, then resumed its slide Sept 1. Analyst average target ~$17.47 with mixed ratings.
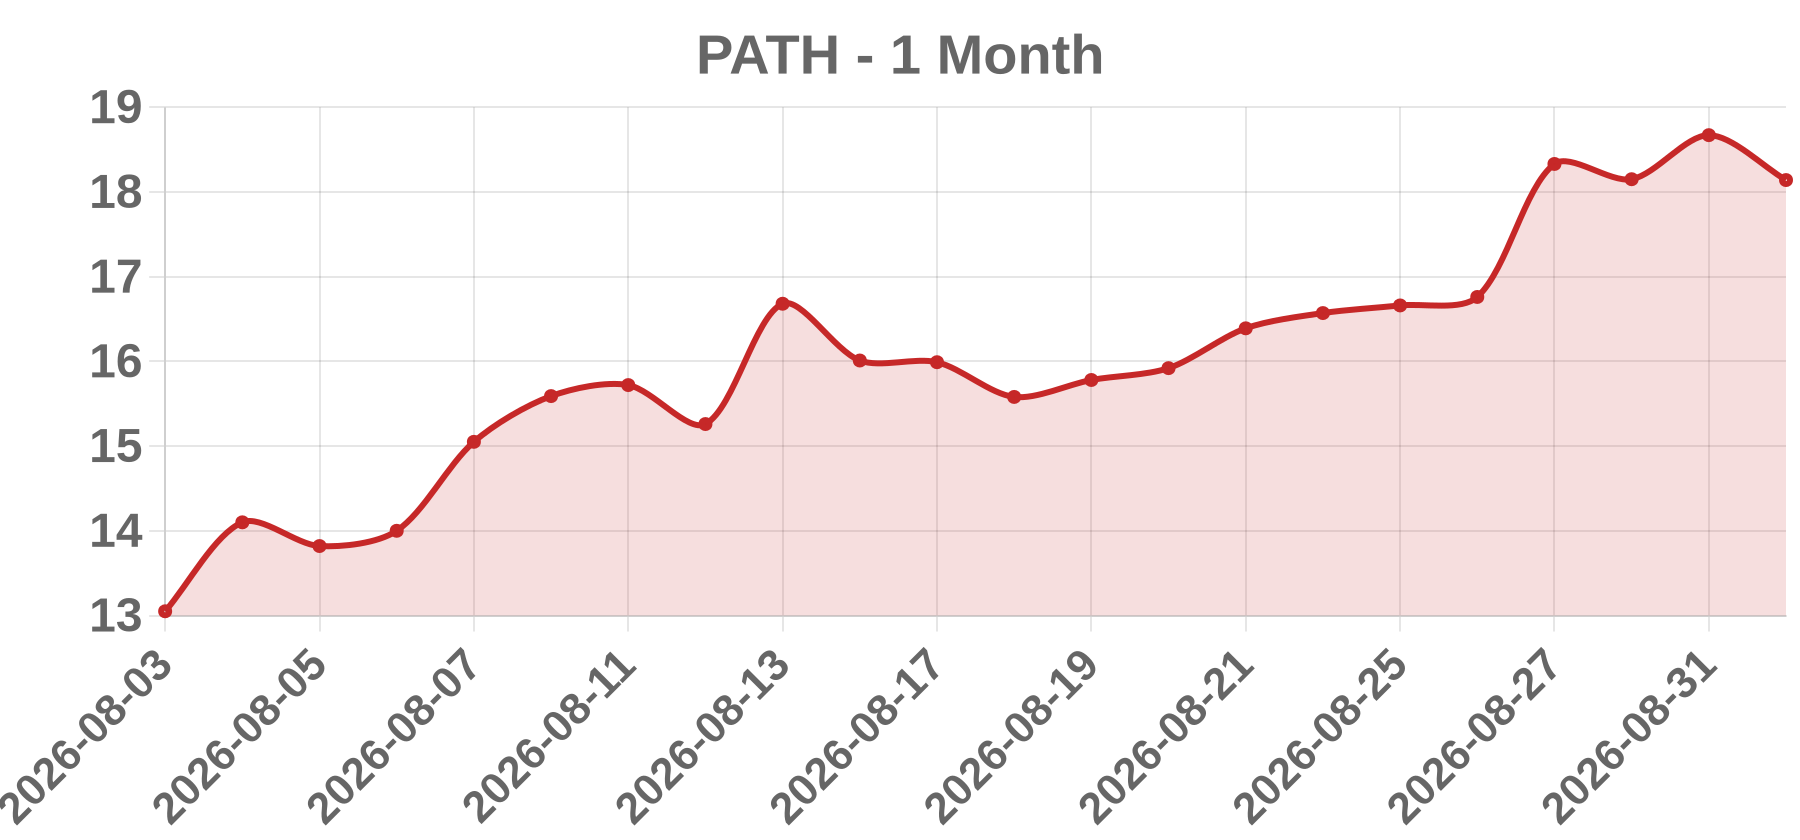
Business UiPath, Inc. (NYSE: PATH, founded 2005, HQ New York) is a global leader in business orchestration and automation, historically known for Robotic Process Automation (RPA). Its end-to-end 'agentic automation' platform unifies AI agents, software robots, people, and AI models to orchestrate, govern, and test enterprise workflows via a multi-tenant SaaS (Automation Cloud), serving regulated industries like banking, healthcare, government, and telecom. ~52% of Q1 FY27 revenue was international.
Today’s take PATH fell 2.84% (-$0.53) to close at $18.14 on Sept 1, 2026 — a profit-taking drift on a day with no company-specific negative news. The setup is binary: Q2 FY2027 results were due after the close Thursday, Sept 3 (webcast 5:00pm ET), with consensus ~$0.15 EPS and ~$397.6M revenue, right at the midpoint of management's $395–400M guidance (implying a ~5% sequential drop from Q1's $418.4M). The stock had run up ~42-46% in the prior month and ~29% above the average analyst target of $14.33 (20 analysts: 14 Hold, 2 Buy, 1 Sell), leaving it 'priced for perfection.' UBS raised its target to $19 from $12 on Aug 31 (maintaining Neutral) yet even that was only ~2.6% above price. Investors focused on net-new ARR, retention, and FY-ARR guidance ($2.058–2.063B) — with Q1 having missed EPS — so positioning was cut into the event.
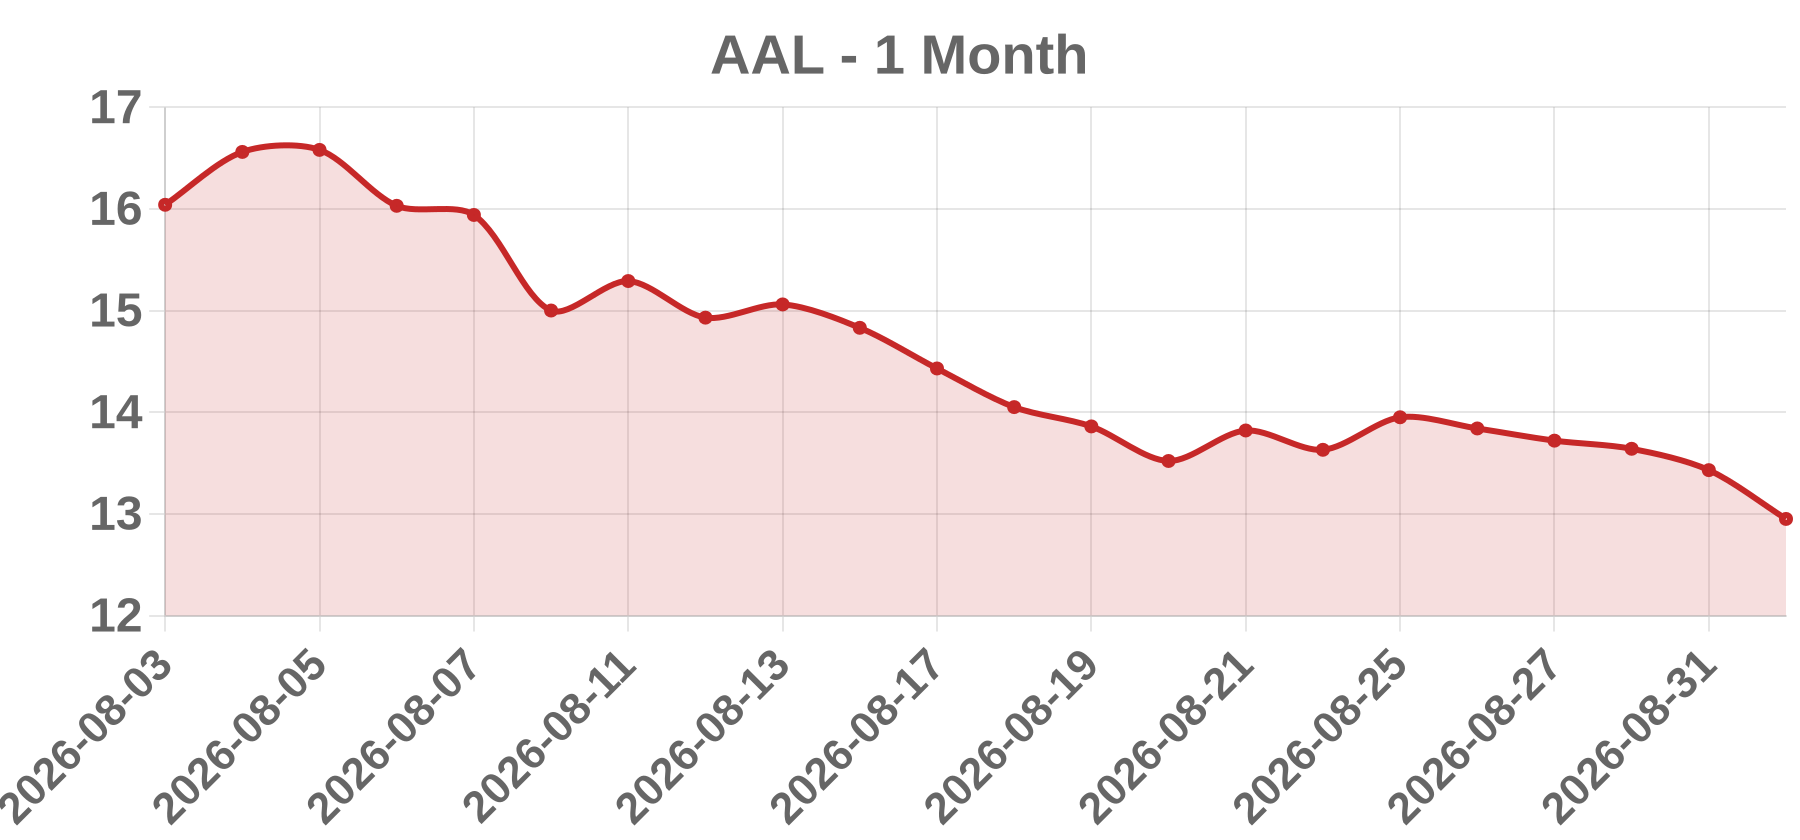
Business American Airlines Group Inc. is a holding company that, through its principal wholly owned mainline operating subsidiary American, operates a network air carrier providing scheduled passenger and cargo air transport across the United States, Latin America, Atlantic, and Pacific regions. Headquartered in Fort Worth, Texas and founded in 1926, it runs hubs in Dallas/Fort Worth, Charlotte, Chicago, Los Angeles and Miami, plus regional subsidiaries and the AAdvantage loyalty program. It trades on NASDAQ under ticker AAL.
Today’s take On Sept 1, 2026 (Tuesday), AAL fell 3.57% to close at $12.95 as Brent crude surged 2.7% to $92.29/bbl following U.S. military strikes on Iranian missile launchers near the Strait of Hormuz. Fuel is AAL's largest cost; with Q2 2026 record revenue of $16.7B (+16.3%) producing just $71M GAAP net income (0.4% net margin), each $0.10/gal fuel increase adds ~$120M in pretax costs — about 1.7x its entire quarterly net income. Q2 fuel expense ballooned 83.3% to $4.88B. Peers also fell (Delta -1.01%, United -1.64% premarket), confirming a sector-wide oil shock rather than idiosyncratic news. Contextual pressure included weak FY2026 guidance (-$0.65 to +$0.65 EPS), a capacity guidance downgrade, a rejected United merger bid, and analyst target cuts (TD Cowen $24→$16; CFRA Sell/$12). The discrimination came from fuel-sensitivity, with AAL sliding harder than the S&P 500 (-0.49%) and Industrials (-1%).
Business Nokia Oyj (NYSE: NOK) is a Finnish multinational telecommunications, network and technology company. It provides network infrastructure, mobile networks, cloud and network services, including AI-driven network automation solutions, to operators, enterprises and governments worldwide. Nokia trades on the NYSE as an American Depositary Receipt (ADR).
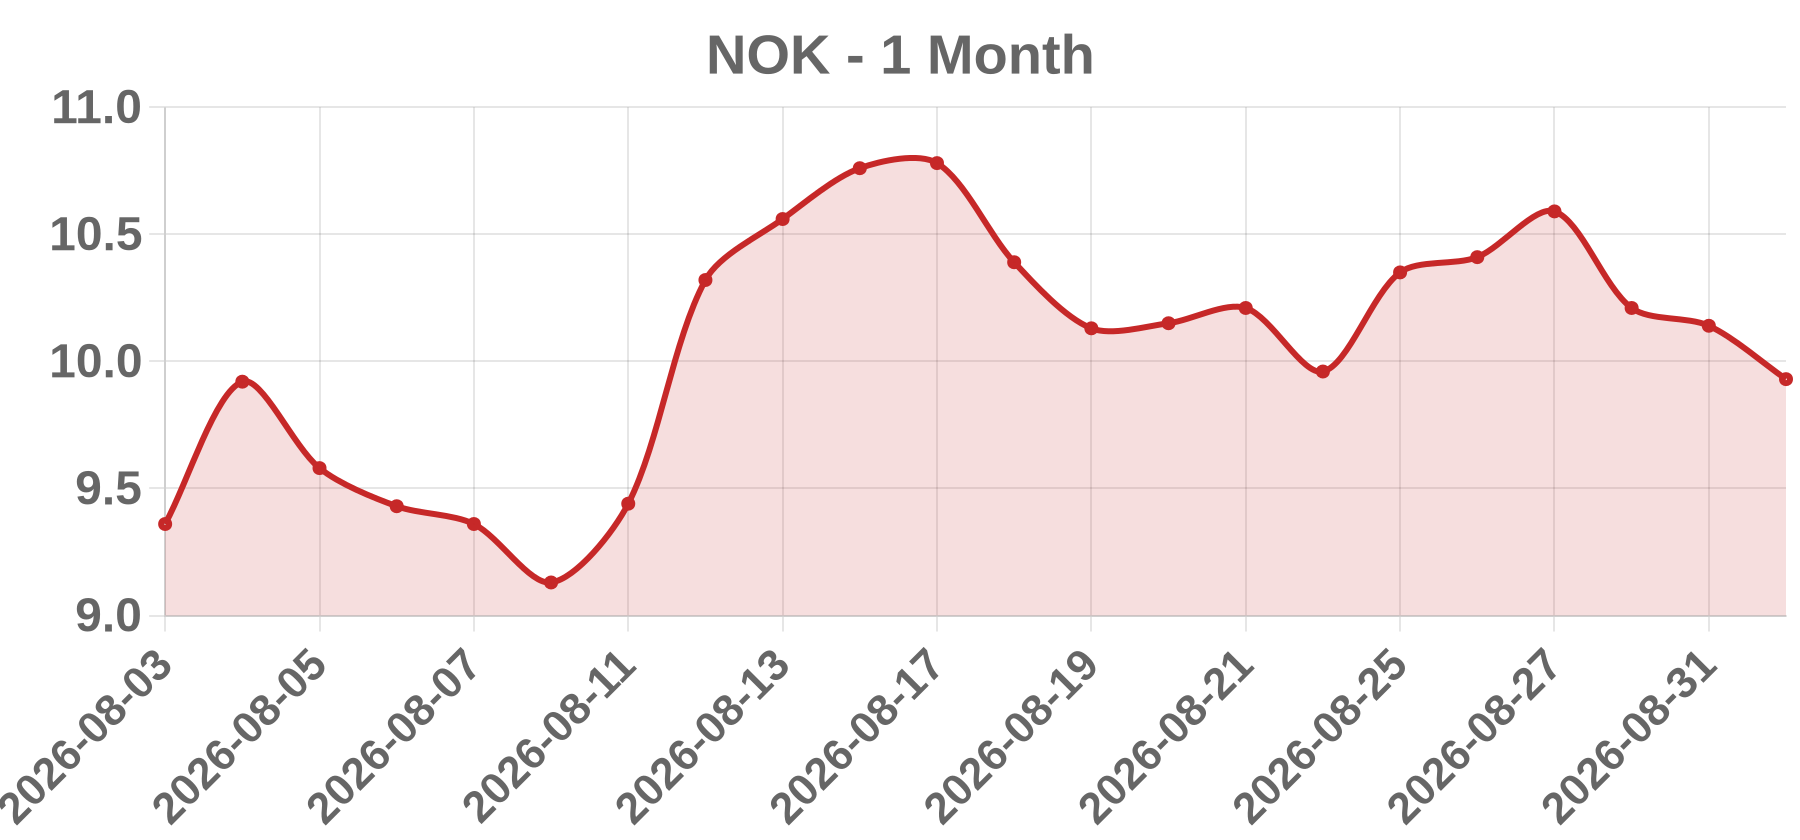
Today’s take On Sept 1, 2026, Nokia ADRs fell 2.07% to close at $9.93 (low $9.75, open $10.06), pressured by broad weakness across network-equipment peers: Arista -2.26%, Cisco -1.24%, and Ericsson -0.74%, with Nokia underperforming Ericsson by ~2.2 percentage points. The moves came despite Nokia's positive Saudi Riyadh R&D center opening for AI-driven network automation. The key overhang was execution risk: Nokia's €2.8 billion AI/cloud order intake must convert into profit and cash, yet Q2 2026 showed comparable operating margin of only 9.0%, a negative reported margin of -1.0% on accelerated restructuring, and free cash flow of -€732 million; only ~50% of orders are expected to convert to revenue within 12 months. A prior-session catalyst was Celestial Acquisition Corp.'s (TSXV: CES.P) August 31 termination of its business combination agreement with Nokia subsidiaries (Nokia Solutions and Networks Oy, Nokia of America, Modulate Space Corporation), citing an inability to finalize financing under current market conditions.
Business Apple Inc. is a California-incorporated global consumer-electronics and technology company listed on the NASDAQ under ticker AAPL. Its business spans hardware (iPhone, Mac, iPad, Wearables/Home/Accessories) and Services (App Store, Apple Music, iCloud, Apple TV+, payments). Apple generated over $416 billion in annual revenue in fiscal 2025, roughly four times its level when Tim Cook took over as CEO in 2011, and carried a market capitalization around $4.6-4.7 trillion.
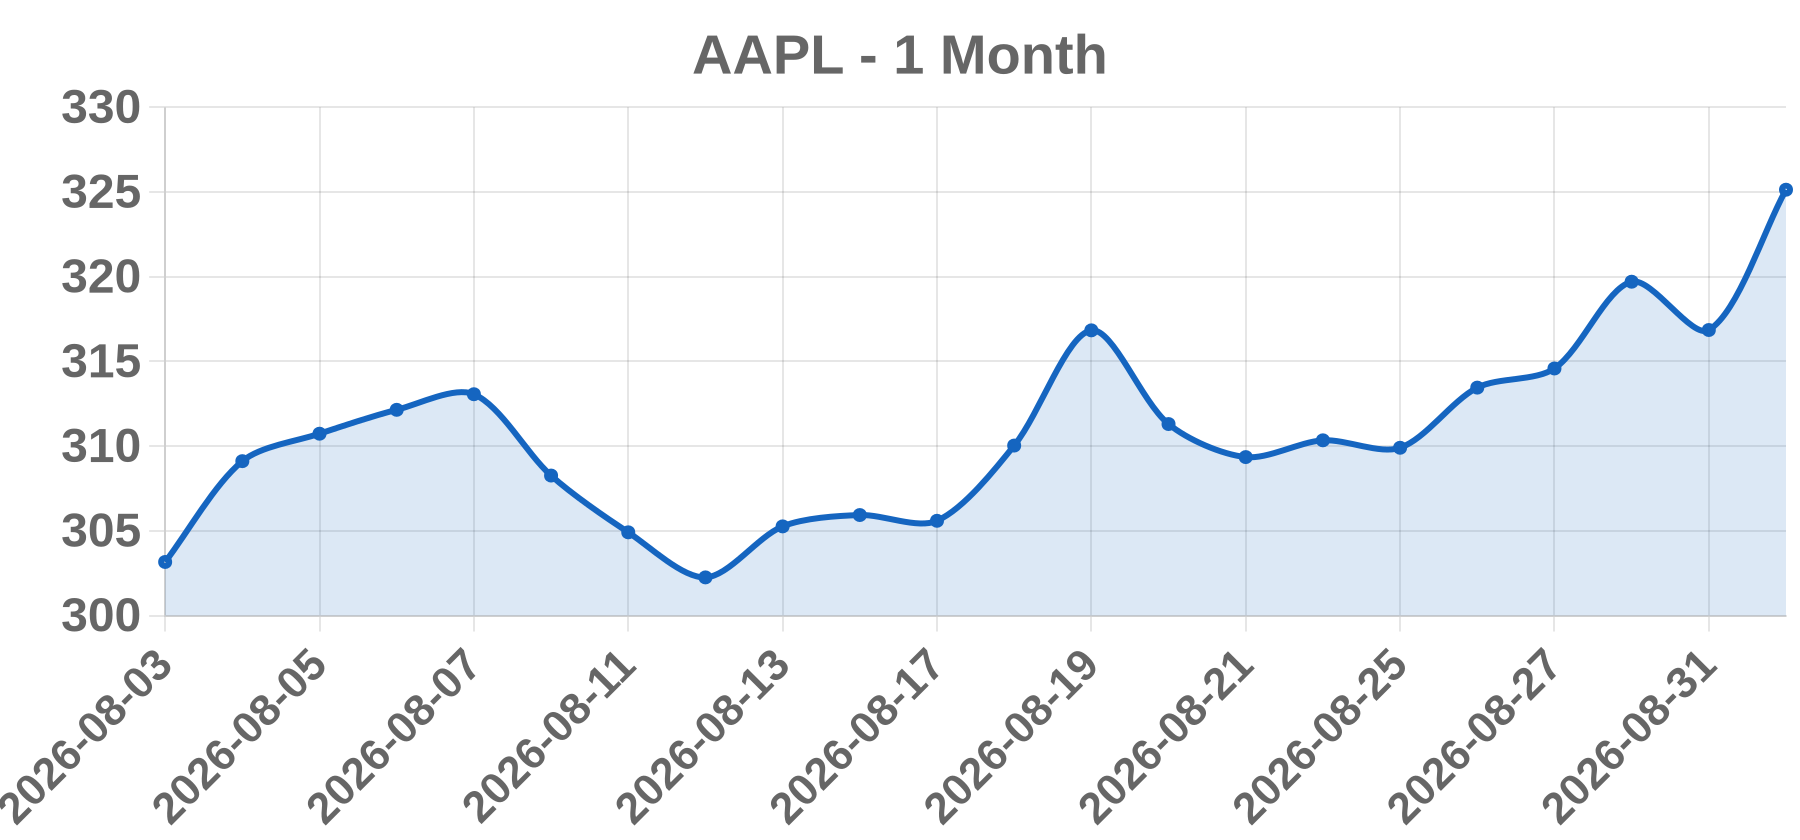
Today’s take The +2.61% advance ($316.85→$325.13, intraday high $327.30) was driven by the formal CEO transition on Sept 1, 2026: hardware-engineering chief John Ternus (at Apple since 2001) succeeded Tim Cook after a 15-year tenure, Apple's first CEO change since 2011. Cook becomes executive chairman, smoothing continuity; this orderly handover, plus Ternus's instant board seat, reassured investors of execution stability, lifting Apple ~2.5-3% even as the S&P 500 (-0.7%), Nasdaq (-1.0%) and Dow (-0.7%) all fell amid rising oil, a ~4.8% 10-year yield and hawkish Fed signals. Sell-side reinforced the move: Rosenblatt (Barton Crockett) raised its target to $303 from $300 (Hold) 'ahead of the iPhone launch' and amid the transition, while JPMorgan kept Buy ($340) and BofA Buy ($380) on an AI 'device domination' thesis. Forward catalyst is the confirmed Sept 9 event widely expected to unveil Apple's first foldable iPhone. Market cap rose to ~$4.74 trillion from $4.62 trillion (~$120B increase).
Business Sono Group N.V. (Nasdaq: SSM) is a Netherlands-incorporated company listed on the Nasdaq Capital Market that currently operates as a digital asset treasury company focused on Bitcoin holdings and structured yield via an institutional covered-call strategy. It is pivoting to rebrand as Sports One, a permanent-capital vehicle to acquire minority stakes in NFL, NBA, MLB and NHL franchises alongside a sports-intelligence data platform.
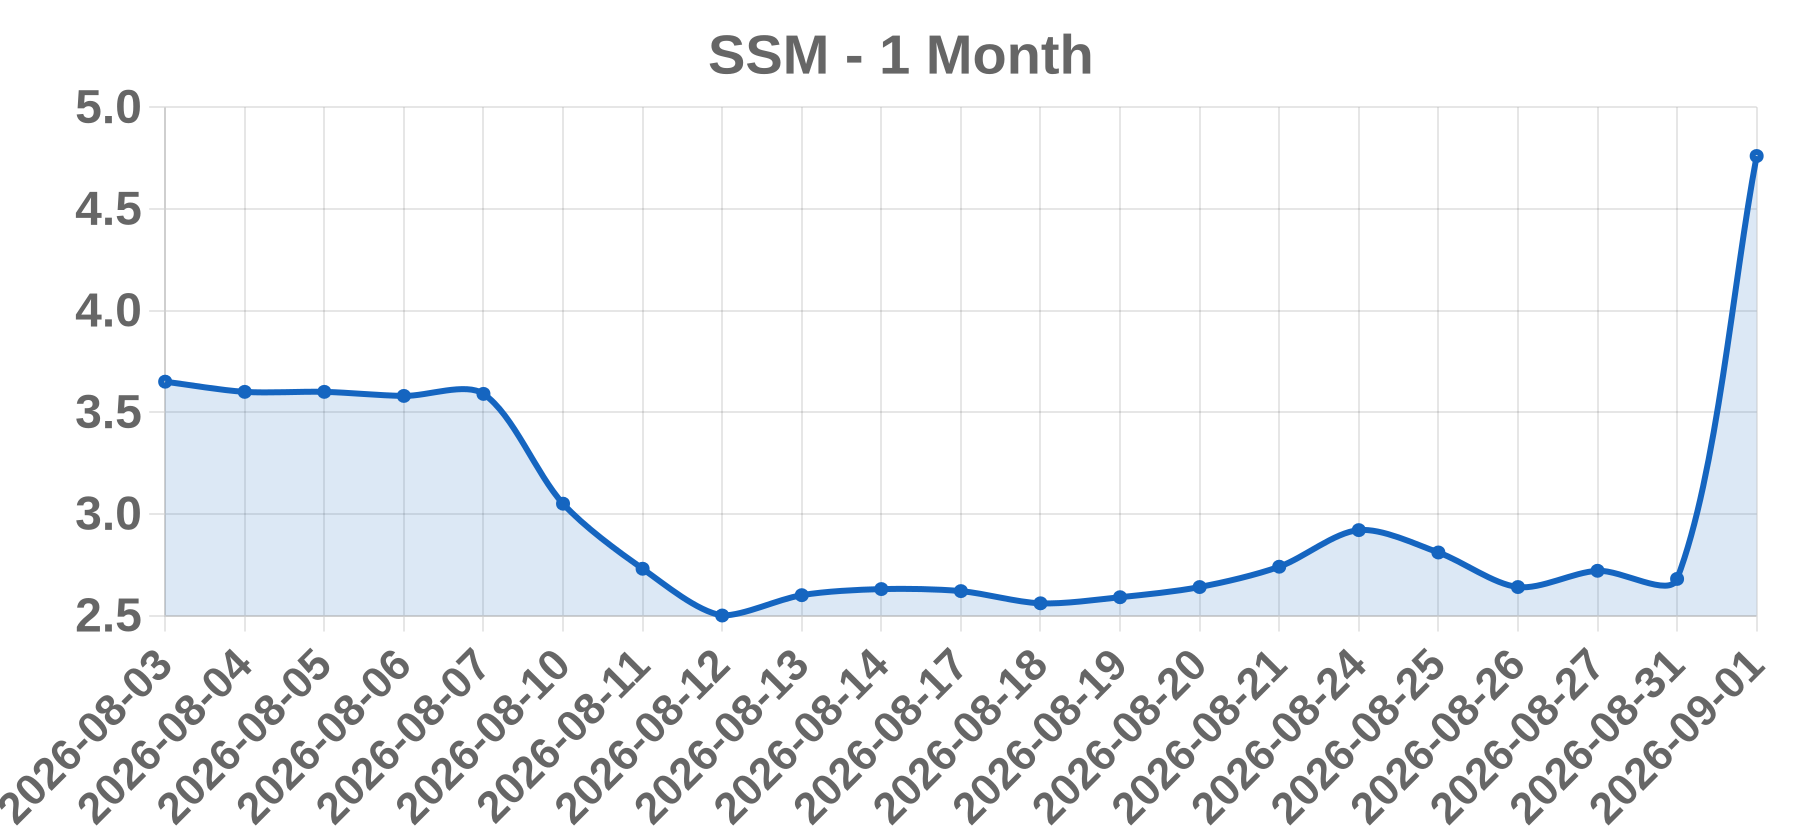
Today’s take On Aug 31, 2026, Sono Group and privately held Sports One signed a non-binding LOI to combine, with Sports One shareholders to own a supermajority of the renamed company led by Sports One management. The full market reaction hit Sept 1: the stock opened at $3.775, peaked at $4.99, and closed at $4.755, up +$2.075 (+77.43%) from the $2.68 prior close. Deal details: an investor group (including Sports One affiliates) bought 283,500 ordinary shares (~19.9% of outstanding) at market price with no discount and no warrants under a 180-day lockup, and preferred holder YA II PN entered a call-option agreement enabling Sports One affiliates to acquire ~half of the preferred shares. The re-rating reflects converting a distressed bitcoin-treasury shell (~$6.97M market cap, ~1.46M shares) into a public permanent-capital sports-franchise owner—the four major U.S. leagues comprise 124 franchises worth over $500B, and any franchise investment remains subject to league approval. The deal is preliminary and still requires due diligence, definitive agreements, regulatory and shareholder approval.
Business bioAffinity Technologies, Inc. is a clinical-stage biotechnology company listed on the NASDAQ Capital Market (BIAF; warrants BIAFW) that develops noninvasive diagnostics for lung disease and cancer. Its lead asset, CyPath® Lung, is a noninvasive sputum-based test using flow cytometry and proprietary AI to detect cancer-associated cells in lung fluid, marketed as a CLIA Laboratory Developed Test via its subsidiary Precision Pathology Laboratory Services. In published trials, CyPath Lung demonstrated 92% sensitivity, 87% specificity, 88% accuracy, and 99% negative predictive value in high-risk patients.
Today’s take On Sept 1, 2026 (8:00 AM ET) bioAffinity announced it is advancing CyPath® Lung for surveillance of ~680,000 U.S. lung-cancer survivors who completed curative-intent treatment—a new recurrence-monitoring indication beyond early detection. This triggered a premarket surge of ~65.6% and a closing gain of +44.52% to $6.59, placing BIAF on both the Gainers and Actives tabs. The move was amplified by an extreme micro-float: a 1-for-15 reverse stock split effective Aug 24, 2026 left only ~592K outstanding shares, so ~45M shares turned over (3x–8x the ~5.9M three-month average). Fundamental risks remain: shares are -74% YTD, Spark (AI analyst) rates BIAF Underperform ($5.50 PT) citing cash burn, deteriorating revenue, and a looming Nasdaq minimum-bid delisting threat.
Business Rising Dragon Acquisition Corp. (NASDAQ: RDAC) is a Cayman Islands blank-check company (SPAC) incorporated in March 2024 and based in Taiyuan, China. It was formed to acquire a private business and take it public, with a pending business combination with HZJL Cayman Limited, a Hangzhou-based company.
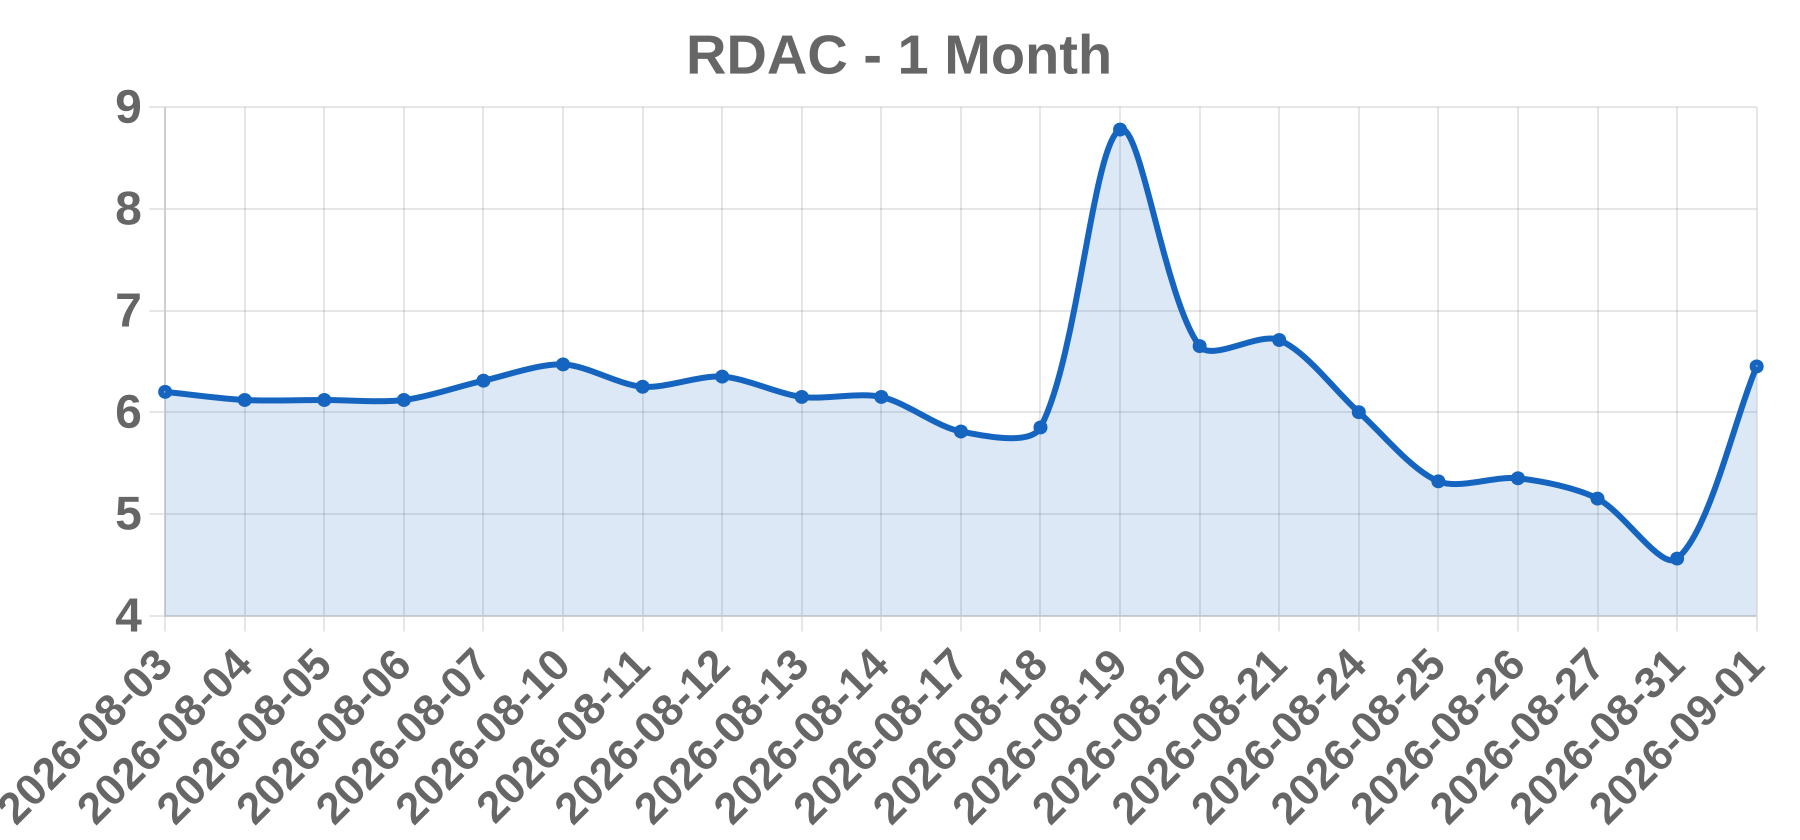
Today’s take On Sep 1, 2026, RDAC closed at $6.45, up +41.45%, after trading in a massive $4.58-$8.58 range on 24.15 million shares — a ~1,100x surge from the prior session's 21,202 shares. The stock rose 31.4% to $5.99 in pre-market after declining 5% on Monday (Aug 31). No company-specific fundamental catalyst existed: FMP explicitly attributed the move to 'continued volatility in the low-float SPAC.' RDAC has only 802,240 float shares (49.25% insider ownership) among 3.44M outstanding, making it extremely prone to speculative swings. Short interest was negligible (~1,928 shares, 0.06%), ruling out a short squeeze. The pattern mirrors an Aug 19, 2026 spike (+50% to $8.78 on 16.5M shares) following a Nasdaq MVLS compliance notice. A November 2025 shareholder vote redeemed 5,715,609 shares, sharply shrinking the tradable float. This session was a pure low-float retail momentum/volatility event.
Business Swvl Holdings Corp. (Nasdaq: SWVL) is a technology-driven mobility company providing mass transit and shared-mobility solutions for enterprises and governments across Egypt, Saudi Arabia, UAE, Kuwait, Qatar, the UK and the US. Its platform delivers optimized routing, real-time visibility, and operational efficiency across large-scale transportation networks, with offerings spanning B2C rider networks and B2B corporate, school, municipal and healthcare transport.
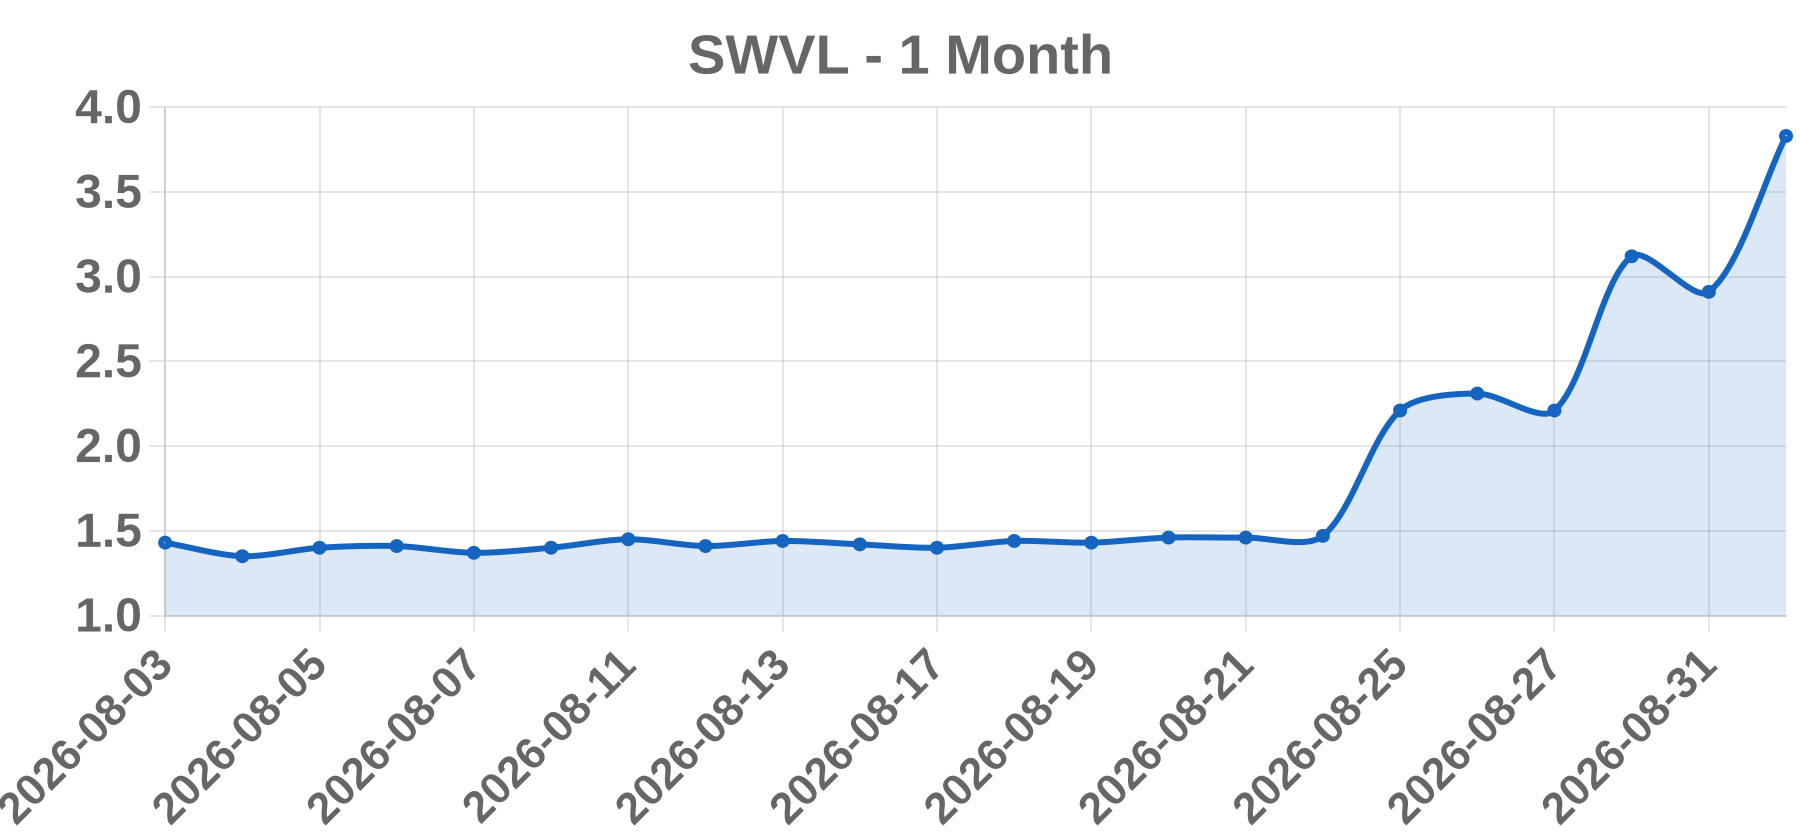
Today’s take Swvl surged +31.62% (+$0.92) to $3.83 on Sept 1, 2026, after announcing its first working capital facility in the UAE with Zelo, a tech-enabled financing platform backed by International Holding Company (IHC). The non-dilutive facility provides dedicated liquidity to launch and scale new enterprise accounts in Swvl's fastest-growing market, where it achieved ~5x revenue growth since its December 2024 UAE relaunch. This directly addresses investor concerns about equity overhang following the prior week's ~$14.5M PIPE led by the Sawiris-backed Coefficient LP at ~$1.46/share. With ~9.96M shares outstanding (~$38M market cap), the small float magnified the move. Shares opened at $2.82, ranged $2.81-$3.95, and closed near the day's high. Volume of ~999.8K shares was ~2x the prior session and ~50-100x recent average daily volume, confirming news-driven demand. The facility supports converting a growing enterprise pipeline (including a five-year $5.5M UAE contract) into revenue without diluting shareholders.
Business Fervo Energy Company (Nasdaq: FRVO) is a Houston, Texas-based enhanced geothermal energy developer founded in 2017. It builds, owns, and operates enhanced geothermal systems (EGS) using oil-and-gas techniques such as horizontal drilling and distributed fiber-optic sensing to generate firm, carbon-free baseload power, monetized through long-term power purchase agreements (PPAs) with utilities and large energy buyers. Fervo completed its Nasdaq IPO in May 2026 at $27.00/share, raising roughly $1.89 billion to fund its flagship Cape Station project in Utah and expansion in Nevada.
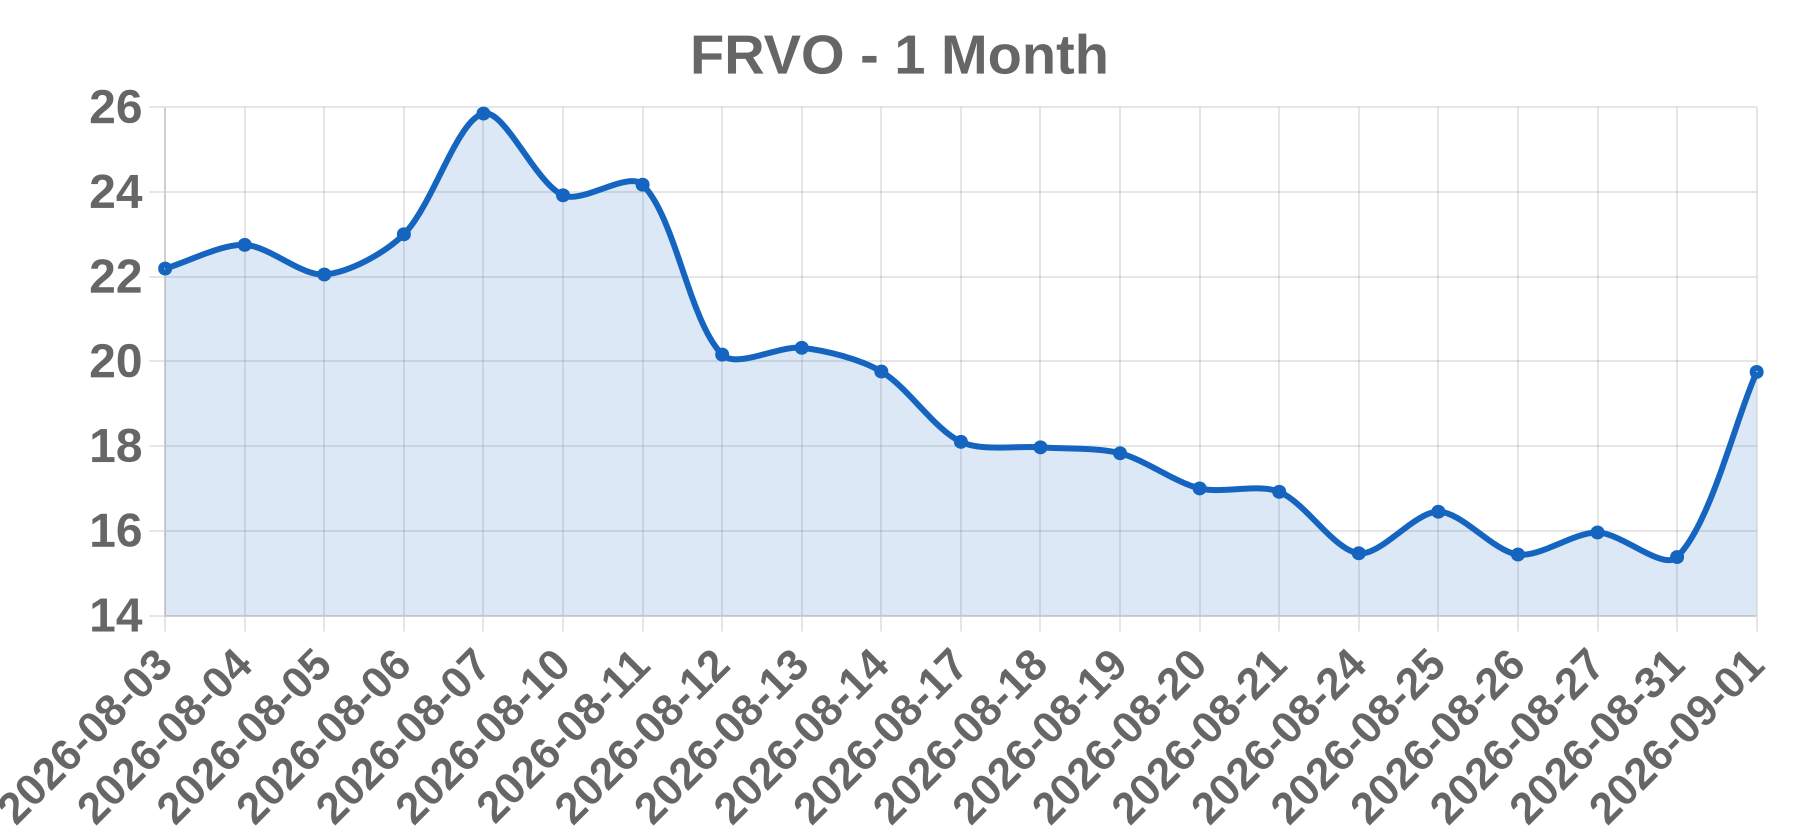
Today’s take On the 2026-09-01 session FRVO surged +28.41% to $19.75 (prev close $15.38), posting its best day since late July, after the company announced a landmark 396-megawatt (MW) enhanced-geothermal power purchase agreement (PPA) with Alphabet's Google for its Cape Station EGS GeoCluster in Beaver County, Utah (expected online 2028). Marking the largest enhanced-geothermal PPA globally, the deal gives Google an option to expand offtake by ~600 MW toward nearly 1 GW by June 2030, supporting a potential Utah data center. RBC Capital analyst Christopher Dendrinos maintained an Outperform rating and $46 price target (~200% upside), noting the agreement arrived earlier than expected and lifts total contracted power to ~1,064 MW with ~1.1 GW of development visibility through 2030. The bounce was amplified by prior weakness — the stock had hit a 52-week low of $14.60 days earlier and was down ~46% since its May IPO — making the company-specific positive news a sharp relief rally.
Business System1, Inc. (NYSE: SST) is a Los Angeles-based digital marketing and internet-utilities company. It operates flagship consumer internet properties including MapQuest (navigation app), CouponFollow, Startpage.com, Info.com, HowStuffWorks, and Answers, alongside an AI-powered ad-tech marketing platform that monetizes third-party publisher traffic.
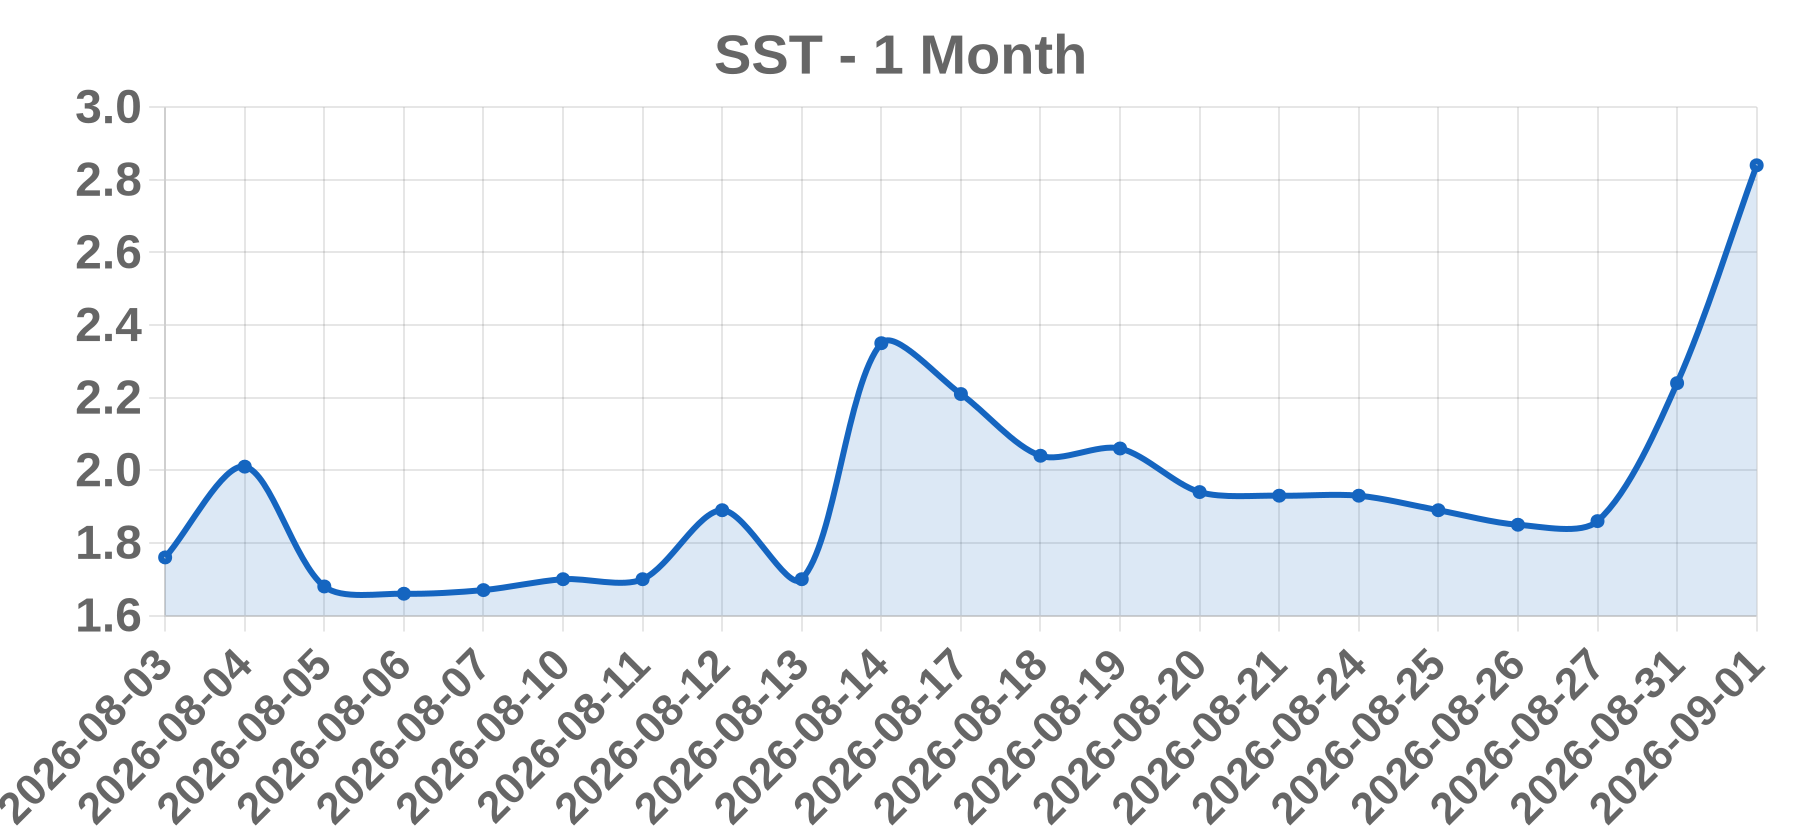
Today’s take The Sept 1, 2026 session was the continuation day of a two-session viral rally. On Aug 31, MapQuest publicly refused to rename Lake Ontario to 'Lake America,' reversing Google's compliance with the US executive order. This sparked a viral download surge (usage ~50x normal, over 184,000 global downloads per Sensor Tower, 162K US downloads). On Sept 1 at ~11:36 AM EDT, System1 issued a Business Wire press release confirming MapQuest had reached No. 1 overall free app in both the US and Canada Apple App Stores — its highest ranking in the brand's 30-year history. While Aug 31 closed +18.52% at $2.24 (~9M shares), Sept 1 closed at $2.84 (+26.79%, ~2.1M shares), with the confirming corporate headline reinforcing momentum. The move was sentiment/momentum driven on a deeply distressed small-cap (market cap ~$20-26M, revenue down ~61% YoY to $30.2M in Q2 2026, stock ~40% down YTD entering the session). It was not earnings- or M&A-driven, though the unresolved Brave Bison takeover proposal added to the speculative narrative.
Business Greenwave Technology Solutions, Inc. (NASDAQ: GWAV) operates 13 scrap metal recycling and hauling facilities across Virginia, North Carolina, and Ohio. The company collects, classifies, and processes ferrous and non-ferrous metals, supplying 100% domestically-sourced scrap metal to major steel producers.
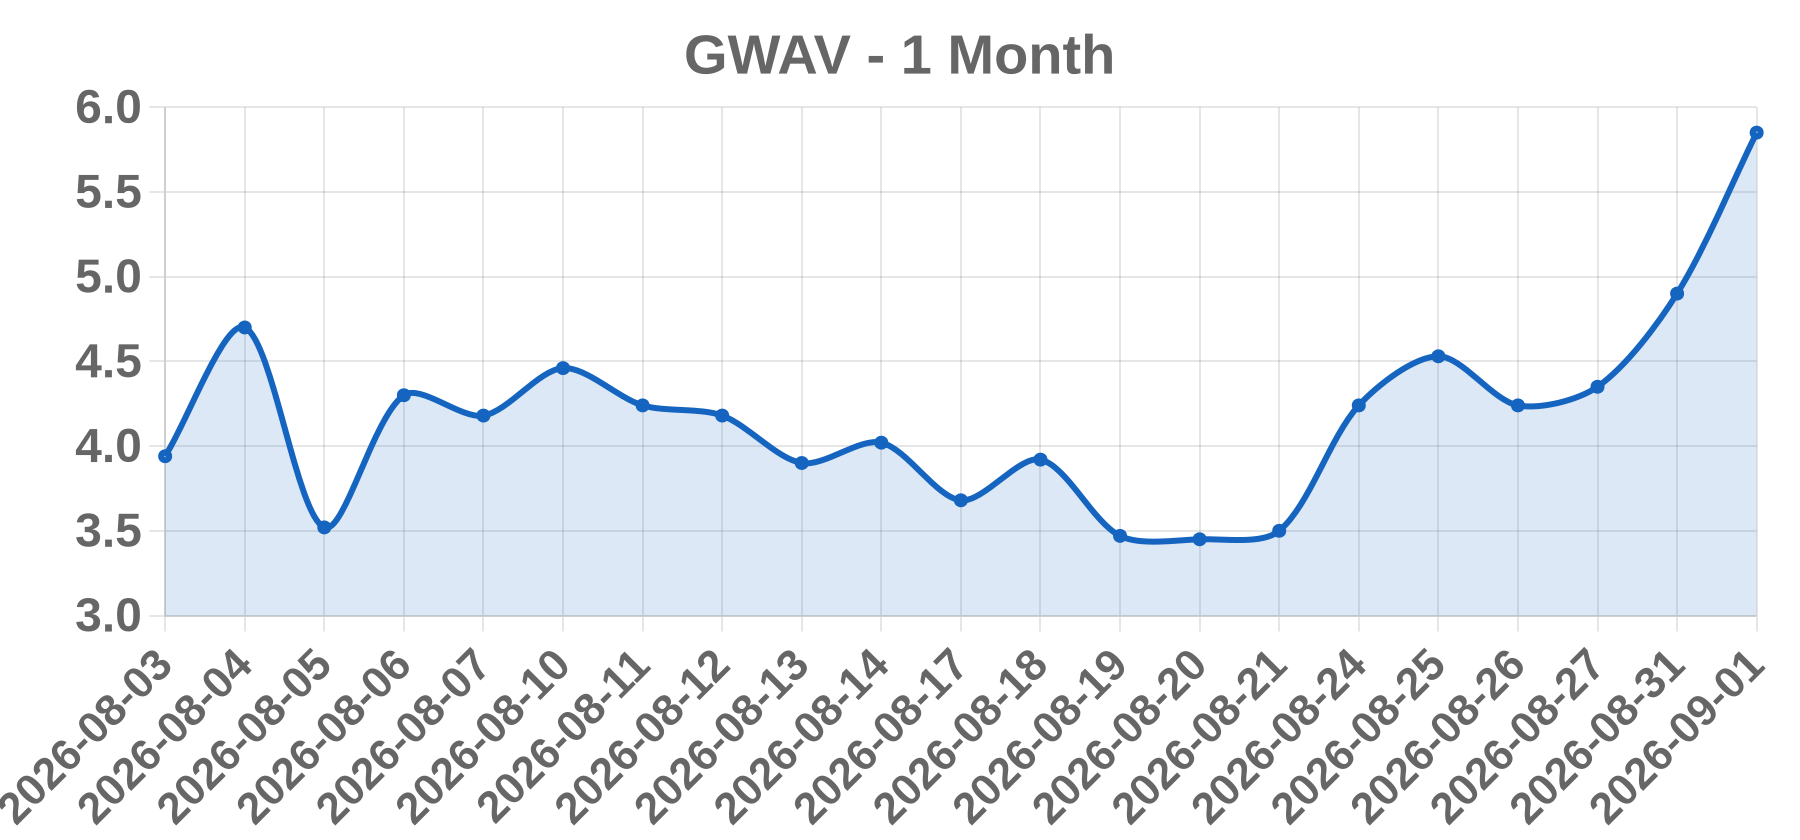
Today’s take GWAV surged +19.39% to $5.85 on Sep 1, 2026 with volume of 58,792 shares (~3x the 10-day average of ~18.8K). The rally extended a multi-week run from a ~$2.39 July low, driven by the Aug 27 8-K disclosing an Exchange Agreement (dated Aug 24) with DWM Properties LLC, an entity controlled by CEO Danny Meeks. Greenwave extinguished $8.0M of related-party debt ($5.39M promissory note + $2.61M other amounts) in exchange for 2,152,853 common shares, materially strengthening the balance sheet. This followed strong Q2 2026 results (Aug 18): revenue grew ~45% YoY to $16M and net loss narrowed ~34% to $3.24M, supported by tariff tailwinds boosting domestic scrap metal demand. The stock closed at its session near-high with momentum accumulation; however, shares pulled back to $5.61 (-4.02%) in after-hours. Risks remain: going concern doubts, $23.1M working capital deficit, and ongoing Nasdaq compliance matters.
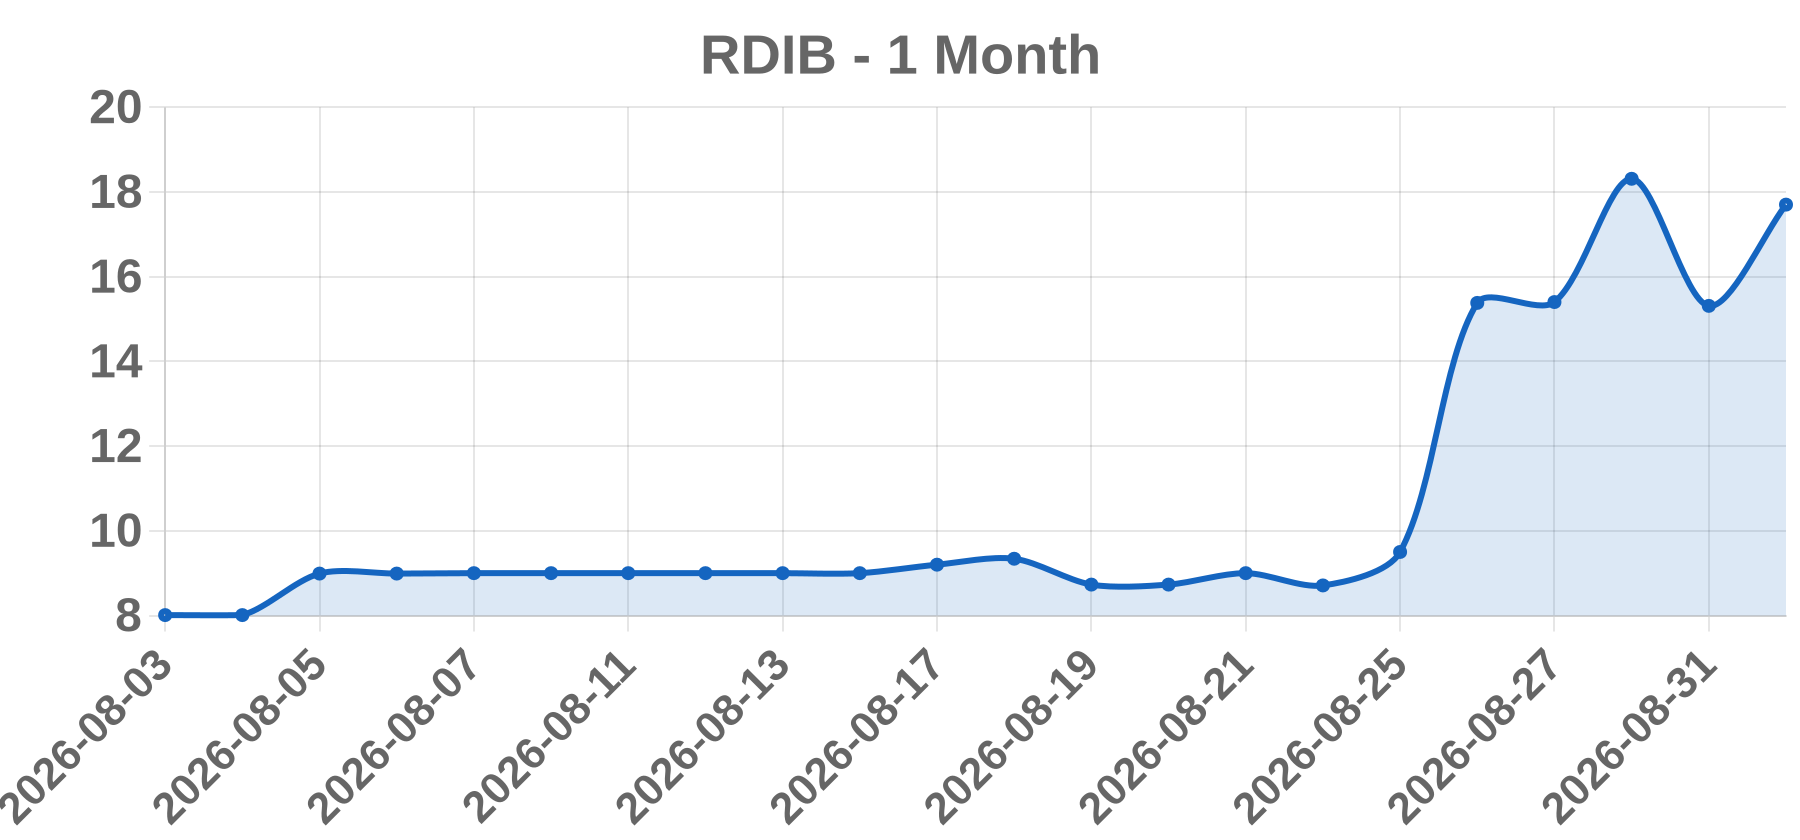
Business Reading International, Inc. is a diversified entertainment and real-estate company operating cinema brands (Reading Cinemas, Angelika Film Center), live theatre and commercial/retail real estate across the US, Australia and New Zealand. It trades on Nasdaq under a dual-class structure with Class A (RDI) and Class B (RDIB) non-voting shares.
Today’s take On Sept 1, 2026, RDIB closed at $17.70, up +17.22% (+$2.60), continuing a violent speculative/short-squeeze episode that began after Reading International reported record Q2 2026 results on Aug 13. Q2 revenue rose ~11% to $66.9M, operating income reached $7.5M (best since Q2 2018, +159% YoY), and net income swung to $2.3M (+185% vs. a year-ago loss). In the thinly-traded dual-class B share, volume spiked from fewer than ~3,700 shares/day to 8.4M shares on Aug 26 (+61.89%), pushing the stock from ~$9 (Aug 25) to a 52-week intraday high of $24.00 on Aug 28. Sept 1 showed extreme intraday amplitude ($13.05 low to $19.58 high, roughly a 50% range) on ~119K shares vs. prior average well under ~10K. No new company-specific news occurred on Sept 1; the move is an extension of momentum/squeeze dynamics on a micro-cap with days-to-cover, following strong fundamental results.
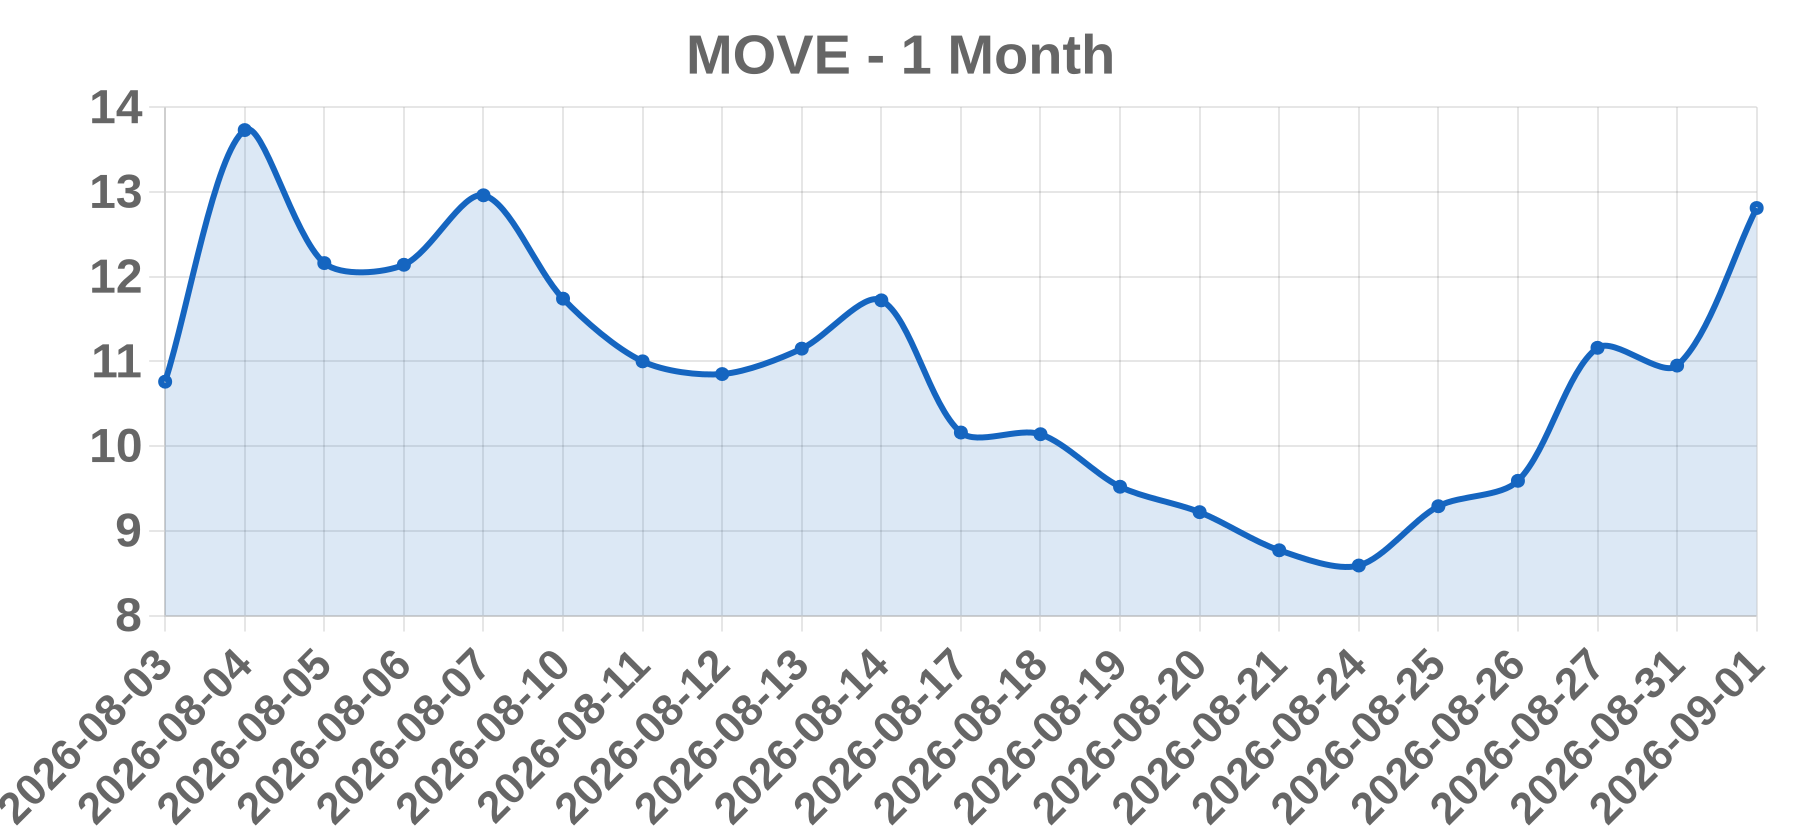
Business Corvex, Inc. (Nasdaq: MOVE), formerly Movano Inc., is an AI infrastructure developer and operator providing GPU-accelerated cloud computing for AI workloads, including Amplified AI Cloud, Token Factory, and Assured AI offerings.
Today’s take On Sept 1, 2026, MOVE surged 16.99% to $12.81 (opening ~$9.99, intraday range $9.80-$12.93), marking a continuation of the momentum rally sparked by the prior session's Aug 31 announcement that Corvex would expand critical IT power capacity ~5x from 1.5 MW to 8 MW by year-end (path to 13x/20+ MW in 2027), deploying ~3,000 new NVIDIA GPUs across its Mid-Atlantic and Midwest data centers. The expansion is funded by a $33M PIPE at $7.75/share led by Goldman Sachs, Morgan Stanley and Oppenheimer, expected to close Sept 2, which would lift pro forma cash to ~$55M and support GPU-as-a-Service, take-or-pay customer contracts. The session also rode broad AI-infrastructure sector strength (Fervo-Google geothermal deal, AI stocks rallying). Volume of ~808K shares was well above the ~286K average for this small-cap, reflecting heavy speculative retail interest.
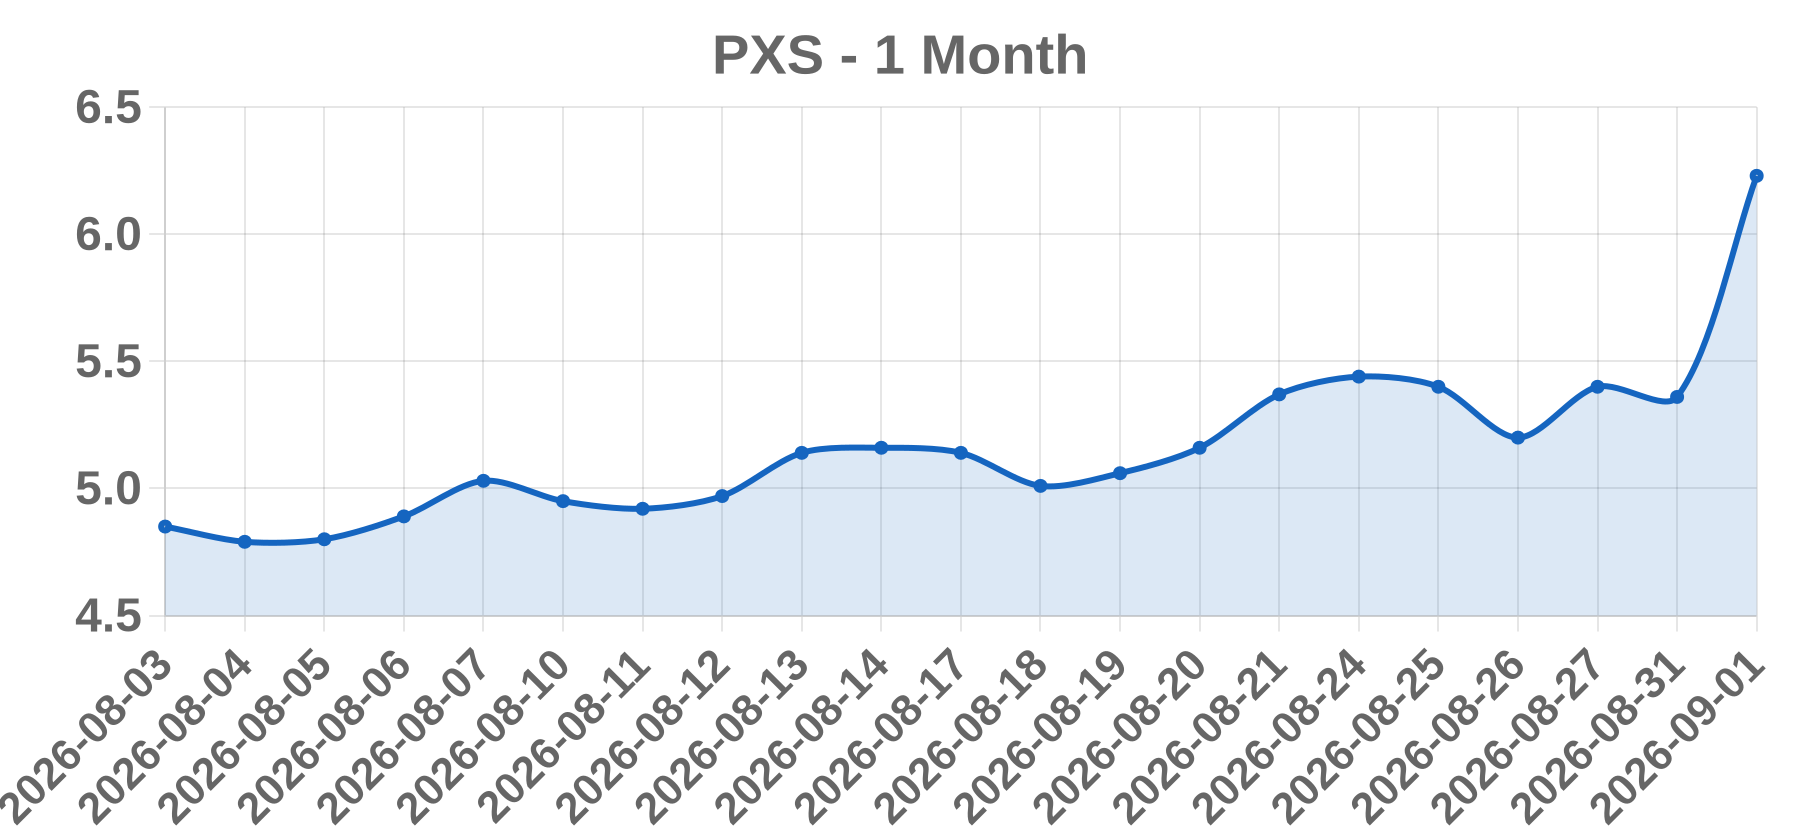
Business Pyxis Tankers Inc. (NASDAQ: PXS) is a Greece-based international maritime transportation holding company that owns and operates a modern fleet of mid-sized vessels across two segments: eco-efficient MR2 product tankers carrying refined petroleum products and liquid bulk, and dry-bulk carriers (Ultramax and Kamsarmax) with scrubbers. The company blends time charters for cash-flow visibility with spot exposure, with ~10.24M shares outstanding, ~59.8% insider ownership, and a ~4.12M-share public float.
Today’s take PXS surged +16.23% to $6.23 on Sept 1, 2026, after reporting Q2 FY2026 results after market close on Monday, Aug 31, 2026. The company posted EPS of $0.27, beating consensus of $0.20 by $0.07, and swung from a $2.0M net loss a year ago to $2.8M net income. Net revenues rose 32.6% YoY to $12.134M, topping the ~$11.380M consensus estimate. Growth was driven by higher charter rates: dry-bulk TCE rates surged 57.7% to $20,245/day and MR tanker rates rose 5.9%, with average MR TCE of $21,899/day. The stock gapped from a prior close of $5.36, traded in a $5.78–$6.44 range, and settled at $6.23 (intraday high +20% from prior close). Technicals show RSI ~80.6 (overbought), 52-week gain of +123%, and after-hours drift down to ~$6.11 (-1.93%). With only a 4.12M float and low short interest (~0.63%), thin-float dynamics amplified the earnings-beat move by roughly 12x normal volume.
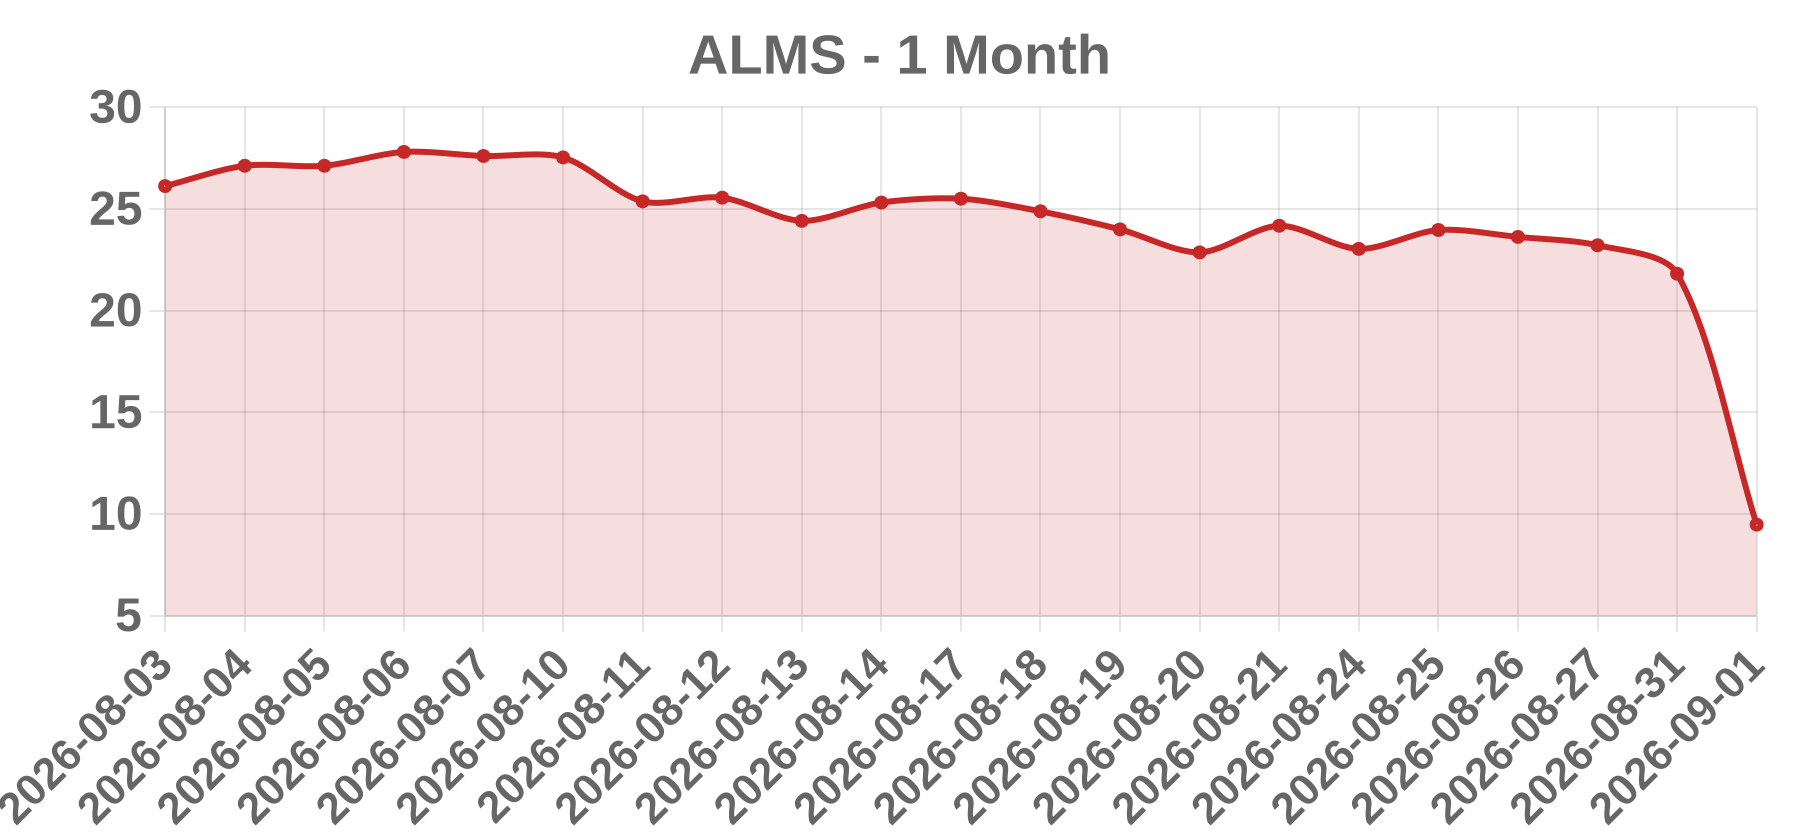
Business Alumis Inc. (Nasdaq: ALMS) is a South San Francisco-based late-stage biopharmaceutical company developing next-generation oral tyrosine kinase 2 (TYK2) inhibitors. Its lead candidate envudeucitinib (formerly ESK-001) targets plaque psoriasis and systemic lupus erythematosus, while A-005 is a CNS-penetrant TYK2 inhibitor for Parkinson's disease and neuroinflammatory conditions.
Today’s take On Sept 1, 2026, Alumis announced topline results from its Phase 2b LUMUS trial (408 patients) of envudeucitinib in moderate-to-severe systemic lupus erythematosus (SLE). The trial MISSED primary and key secondary endpoints in the overall population, sending the stock down a record 56.58% (-$12.34) from a prior close of $21.81 to $9.47. A prespecified IFNGS-high (high-interferon gene signature) subgroup showed compelling responses — a 52.6% BICLA response on the top dose vs 24.4% in IFNGS-low patients — and Alumis plans regulatory discussions for a Phase 3 program. Wells Fargo cut its price target to $25 from $51 (Overweight); H.C. Wainwright maintained Neutral/$25. Alumis remains on track for an NDA in plaque psoriasis in Q4 2026 following positive Phase 3 ONWARD results, and held ~$502M in cash (runway into Q4 2027) as of June 30, 2026.
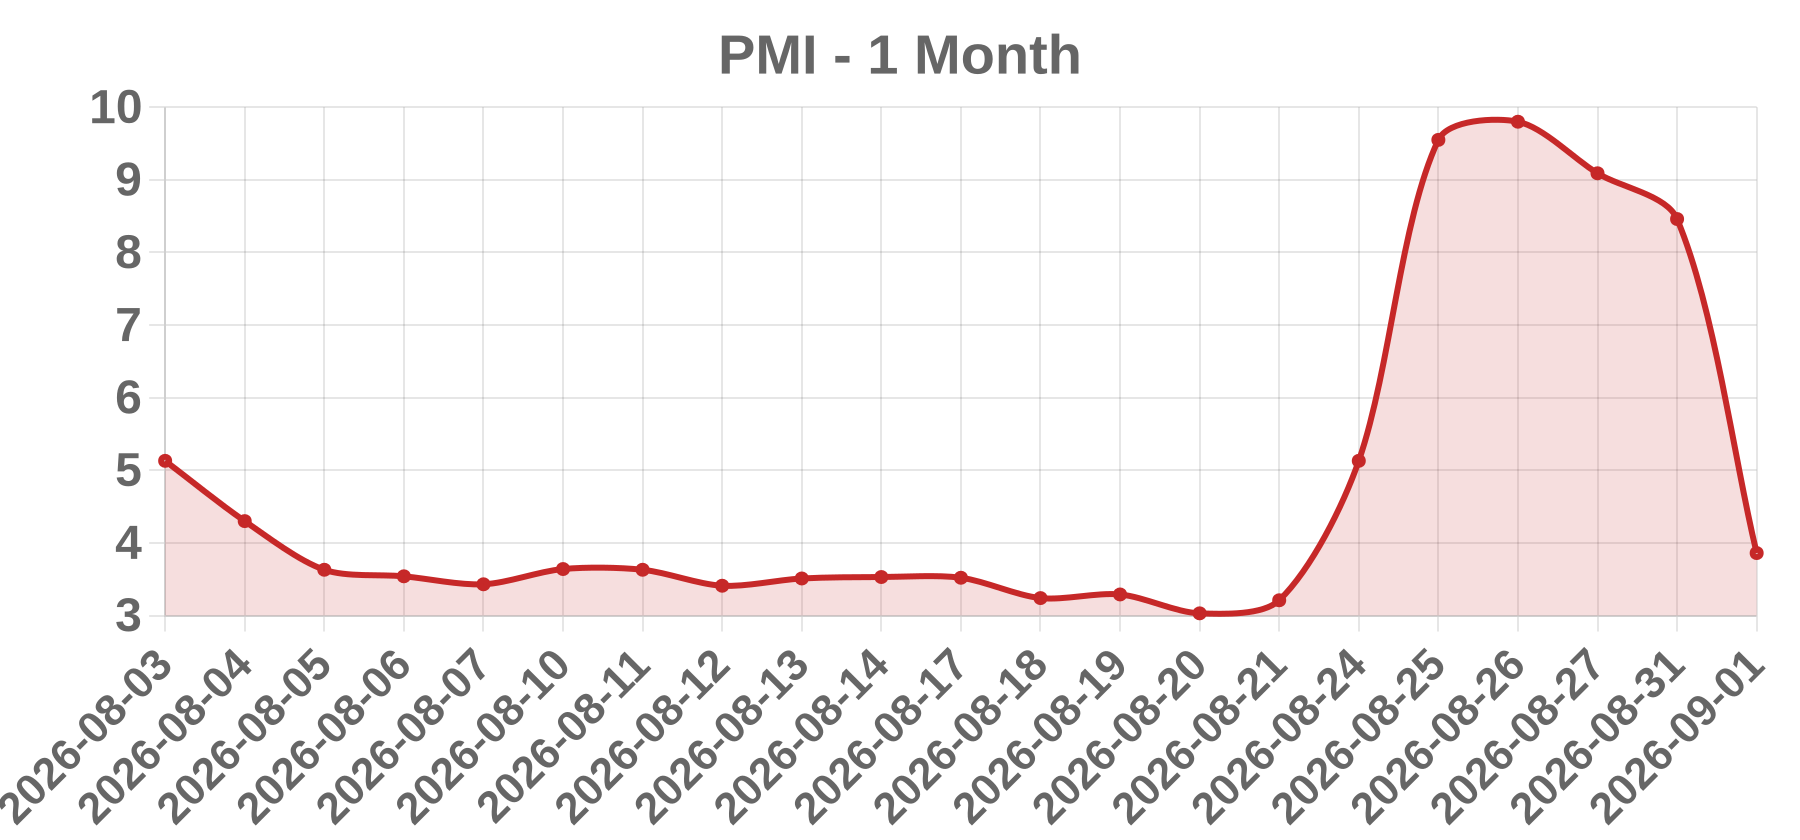
Business Picard Medical, Inc. (NYSE American: PMI), parent of SynCardia Systems LLC, is a Tucson, Arizona-based medical technology company that designs, manufactures and commercializes the SynCardia Total Artificial Heart (TAH) - the only total artificial heart approved by both the U.S. FDA and Health Canada for end-stage heart failure patients.
Today’s take PMI collapsed 54.37% (-$4.60) on Sept 1, 2026, closing at $3.86 after opening at $8.24, spiking to a high of $8.97, then crashing to a low of $3.80 - an enormous intraday unwinding on ~1.55M shares (per Yahoo). This was the culmination of a speculative momentum reversal, not a single company event. The prior session (Aug 31) had already closed -3.86% at $8.46 after a late-August surge that briefly lifted the stock >35% in one session. The stock had rallied on Q2 earnings momentum (Aug 19-23), then gave everything back. Structural overhangs amplified selling: repeated dilutive 2026 equity offerings (large common/warrant deals), razor-thin cash with meaningful current liabilities/going-concern risk, and an accepted NYSE American compliance plan (1-for-50 reverse split effective Aug 3, 2026; compliance period through Nov 8, 2027). With no KQ earnings catalyst until late September, thinly traded momentum traders rotated out into a weak macro tape (S&P -0.5%, Nasdaq -0.9%), triggering the >50% intraday crash.
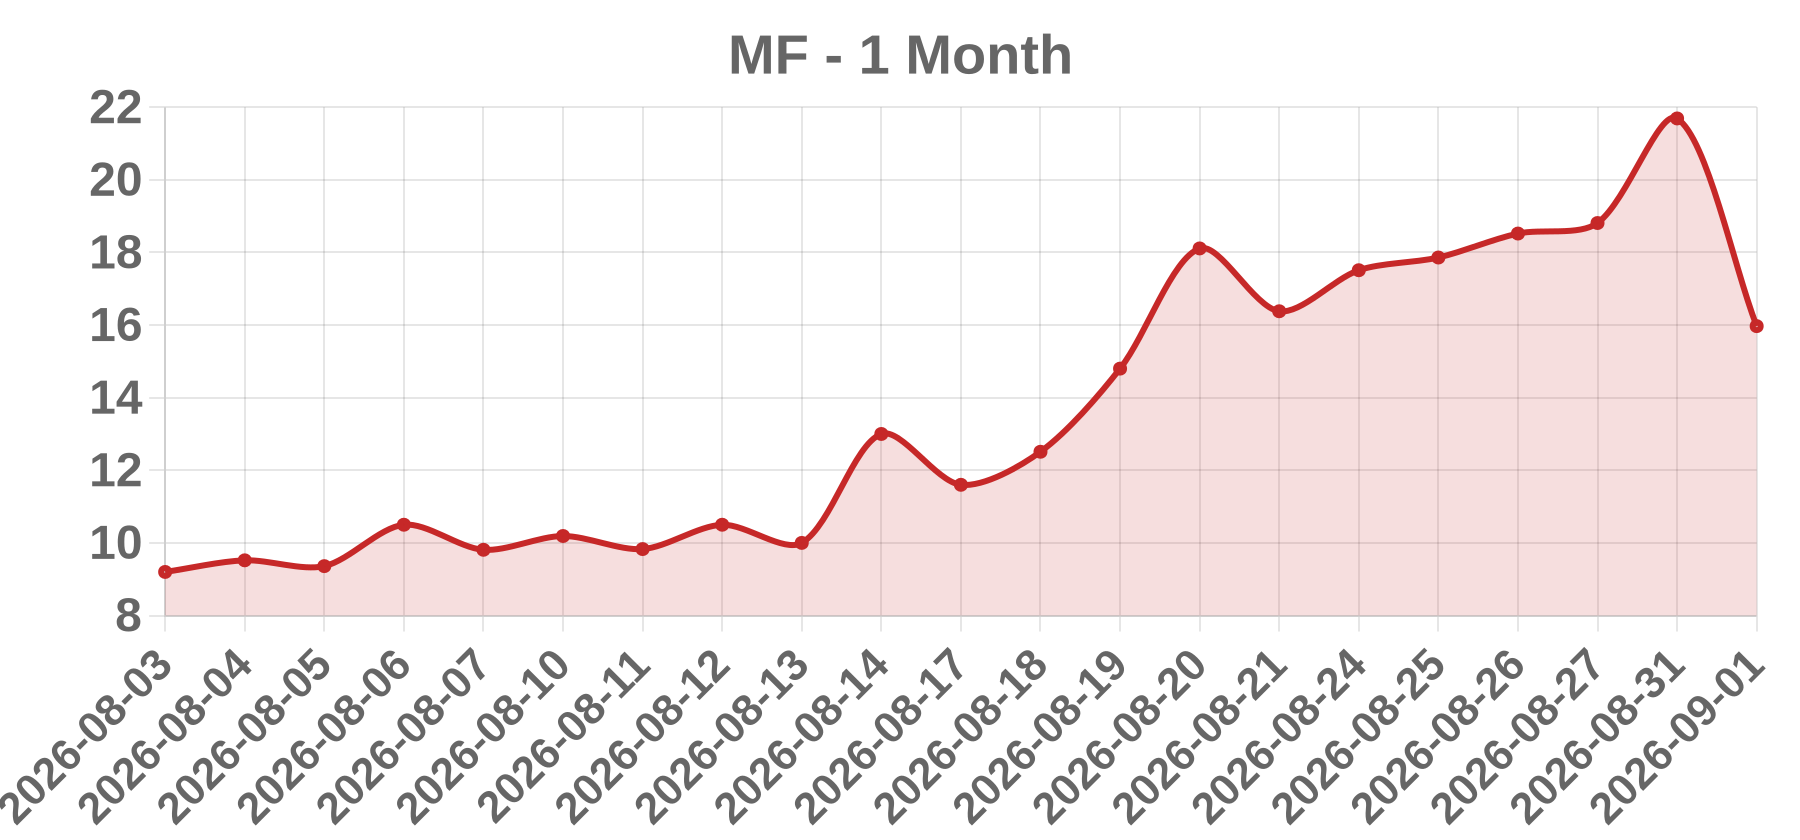
Business MindForge Inc. (NASDAQ: MF), formerly U-BX Technology Ltd. (ticker UBXG), is a Cayman Islands holding company headquartered in Beijing, China, providing AI-driven value-added and insurance risk-assessment services to insurance carriers and brokers. The shares trade on the Nasdaq Capital Market under the MF symbol since July 20, 2026.
Today’s take On 2026-09-01, MF collapsed 26.37% to close at $15.97, opening at $22.08, hitting a high of $22.56, then falling to a low of $15.56 on volume of 279,292 (~2.4x the ~116K daily average). There was NO company-specific fundamental catalyst (no earnings, M&A, FDA or regulatory news) on that session. The move represents a classic speculative blow-off-top: the stock had run vertically from ~$10 in early August to $21.69 (+11.29% on 8/31) after a 30% surge on Aug 14, lifting shares roughly 70% in two weeks on thin volume. MindForge (rebranded from U-BX Technology in July 2026) is a low-float, highly volatile Chinese small-cap with shrinking revenue ($94.3M FY2023 to $29.7M FY2025), ~0.9% gross margin, deep accounting losses, multiple reverse splits (1-for-16 Nov 2024, 1-for-25 May 2026) and heavy equity issuance and share-based compensation. The 9/1 plunge reflects speculative longs taking profits and momentum reversing in a 'meme-style' unwind, not a change in business fundamentals.
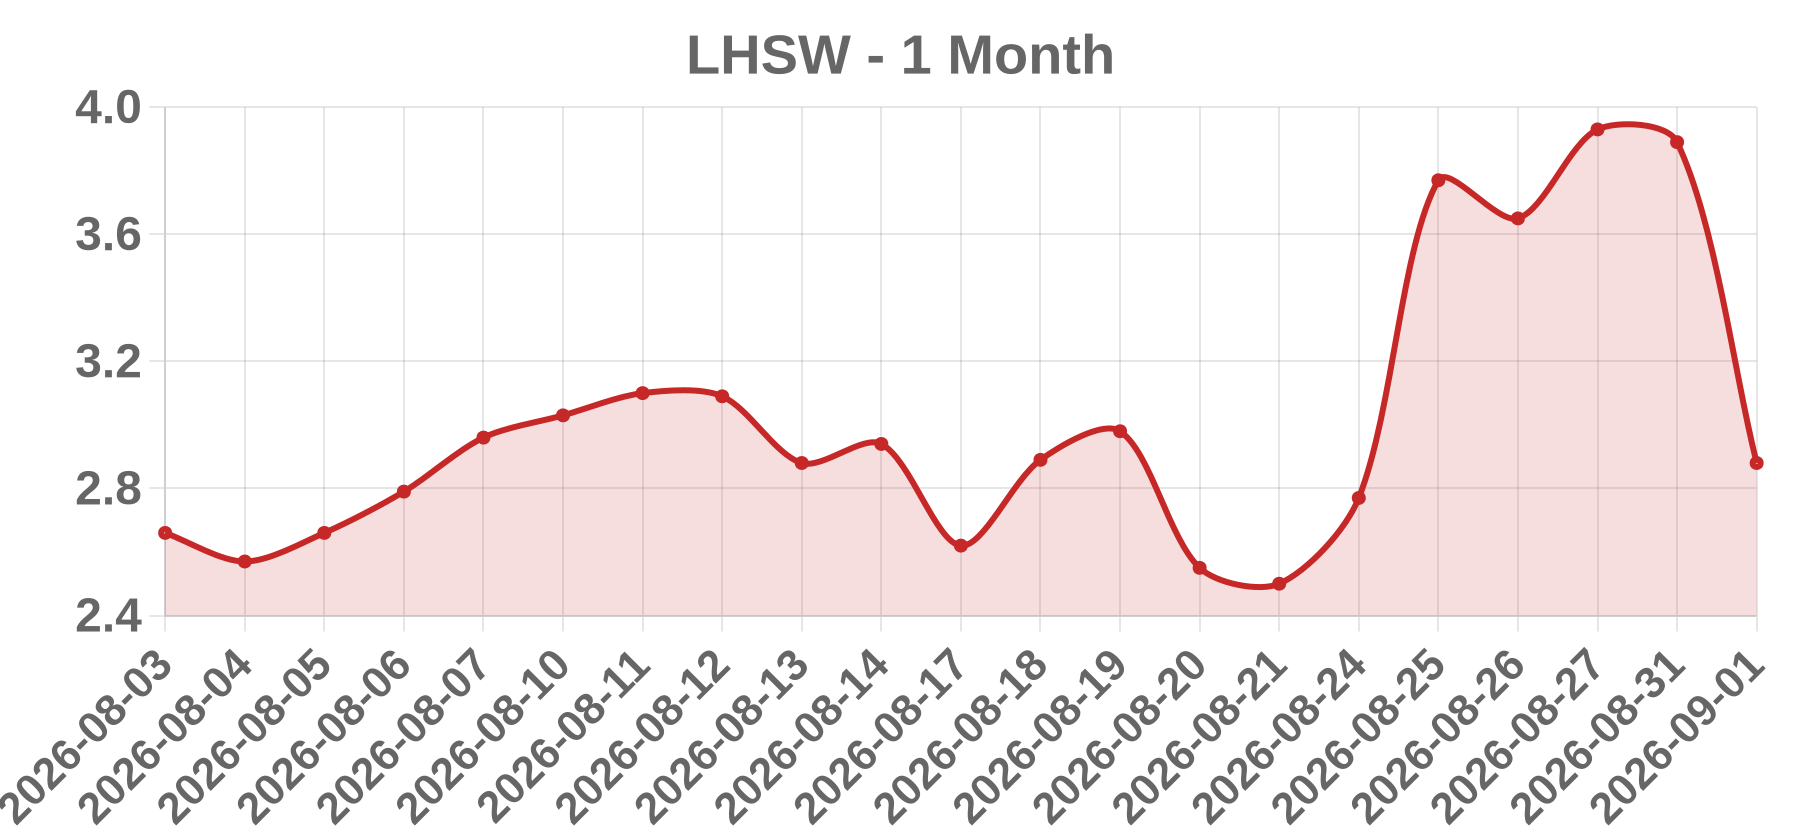
Business Lianhe Sowell International Group Ltd is a Shenzhen, China-based provider of industrial machine vision and AI products (face recognition, AI behavior analysis), intelligent weak-current systems (building intelligence, intelligent transportation), and nine-axis linkage spray-painting robots. Listed on the Nasdaq Capital Market (IPO April 3, 2025 at $4.00), the low-float small-cap has been swept into speculative AI-robotics momentum drives across 2026.
Today’s take The -25.96% drop to $2.88 on Sept 1, 2026 is best characterized as a high-beta momentum unwind rather than a company-specific negative event; no negative disclosure dated Sept 1 was found. LHSW had run up sharply on AI-robotics contract flow — a +36.10% surge on Aug 25 (to $3.77 on 695,663 shares), +7.67% on Aug 27, +5.85% on Aug 28 (to $4.16), peaking at $4.27 intraday on Aug 31 before closing down 6.49% at $3.89. The Sept 1 session opened lower at $3.73, touched $3.78 high, then collapsed to a $2.55 low, closing at $2.88 — erasing most of the prior week's speculative gains on ~472K shares, well above the 35K-155K typical quiet-session range. The stock had just reported fiscal 2026 revenue of $43.27M (+18%) with a $5.65M net loss on Aug 13, and remains an extremely volatile, low-float (3.27M shares) Chinese small-cap that has printed daily moves of +277.78% (Jul 6) and -41.32% (Jul 7), among others, underscoring its speculative character.
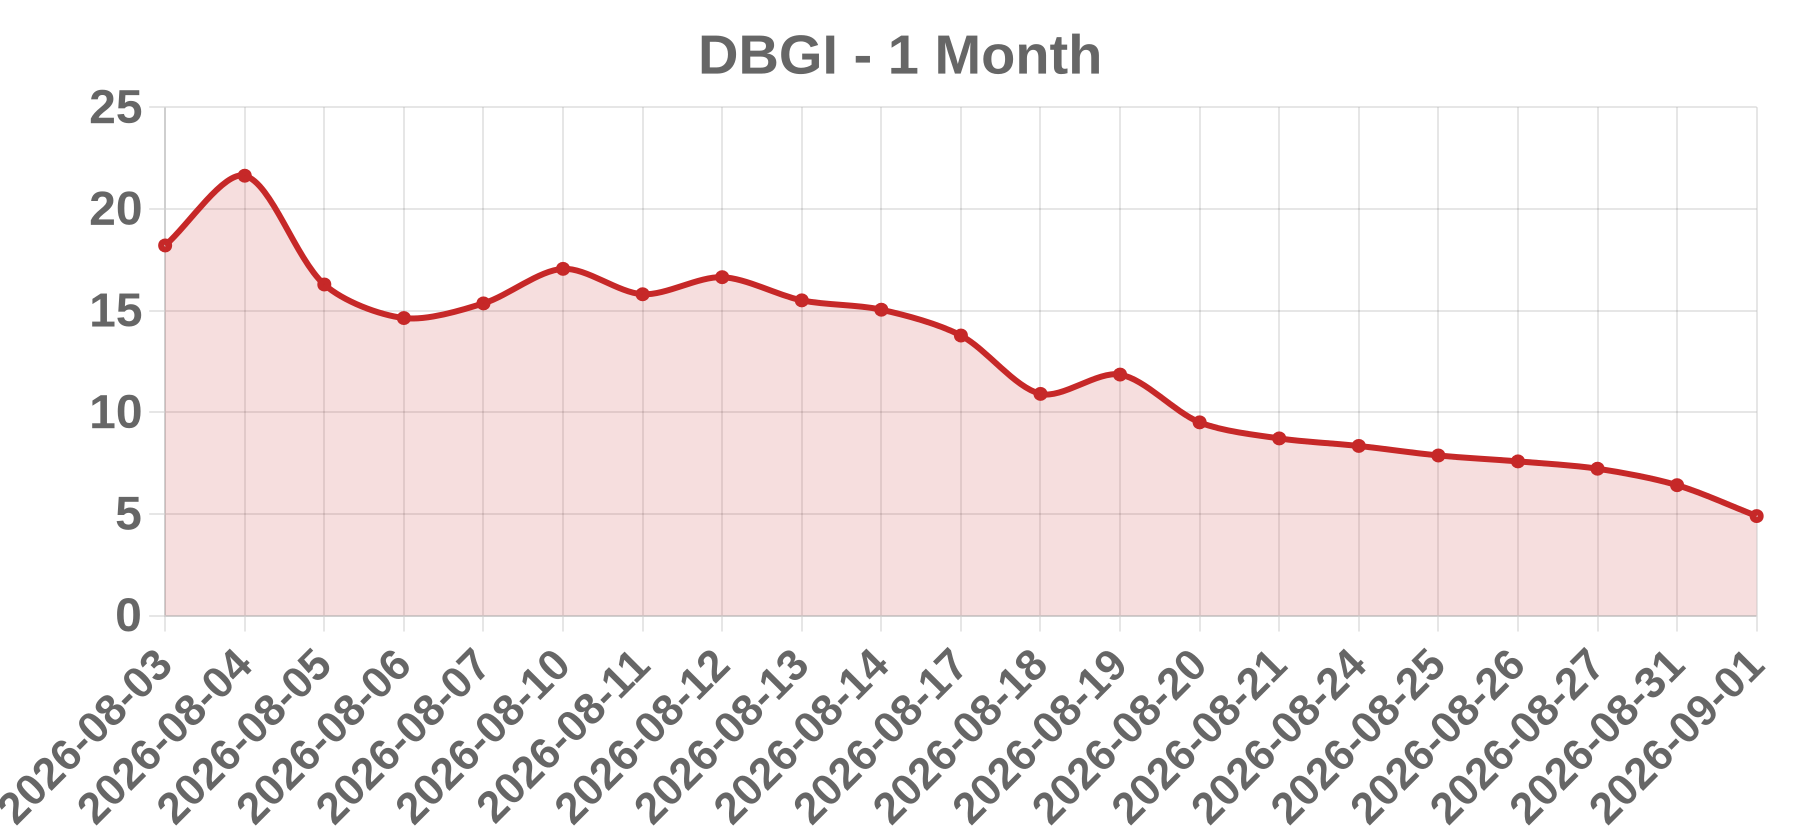
Business Digital Brands Group, Inc. (NASDAQ: DBGI) is an Austin, Texas-based apparel and e-commerce company that manages a portfolio of lifestyle brands (Bailey 44, DSTLD, Sundry, Stateside, Avo) sold via direct-to-consumer and wholesale channels. The company has pivoted heavily toward government/collegiate apparel programs, anchored by a $165 million U.S. Program.
Today’s take DBGI closed at $4.89, down $1.51 (-23.65%) on 2026-09-01, after trading in a wide intraday range from $6.415 high to $4.50 low on heavy volume of 354,969 shares — equal to roughly 64% turn of its ~557K-share post-split float. The move came despite a positive announcement on Aug 31/Sep 1 that DBGI executed a binding contract guaranteeing $3.3 million in cash flow from September through December 2026, the first tranche of a larger $165M U.S. Program. The stock sold off sharply on profit-taking and skepticism over revenue convertibility of the collegiate/government program, compounded by extreme thin-float volatility. This price action sits well below the $77.58-per-share all-cash acquisition proposal DBGI reported receiving in August 2026, signaling investors heavily discounted that proposal.
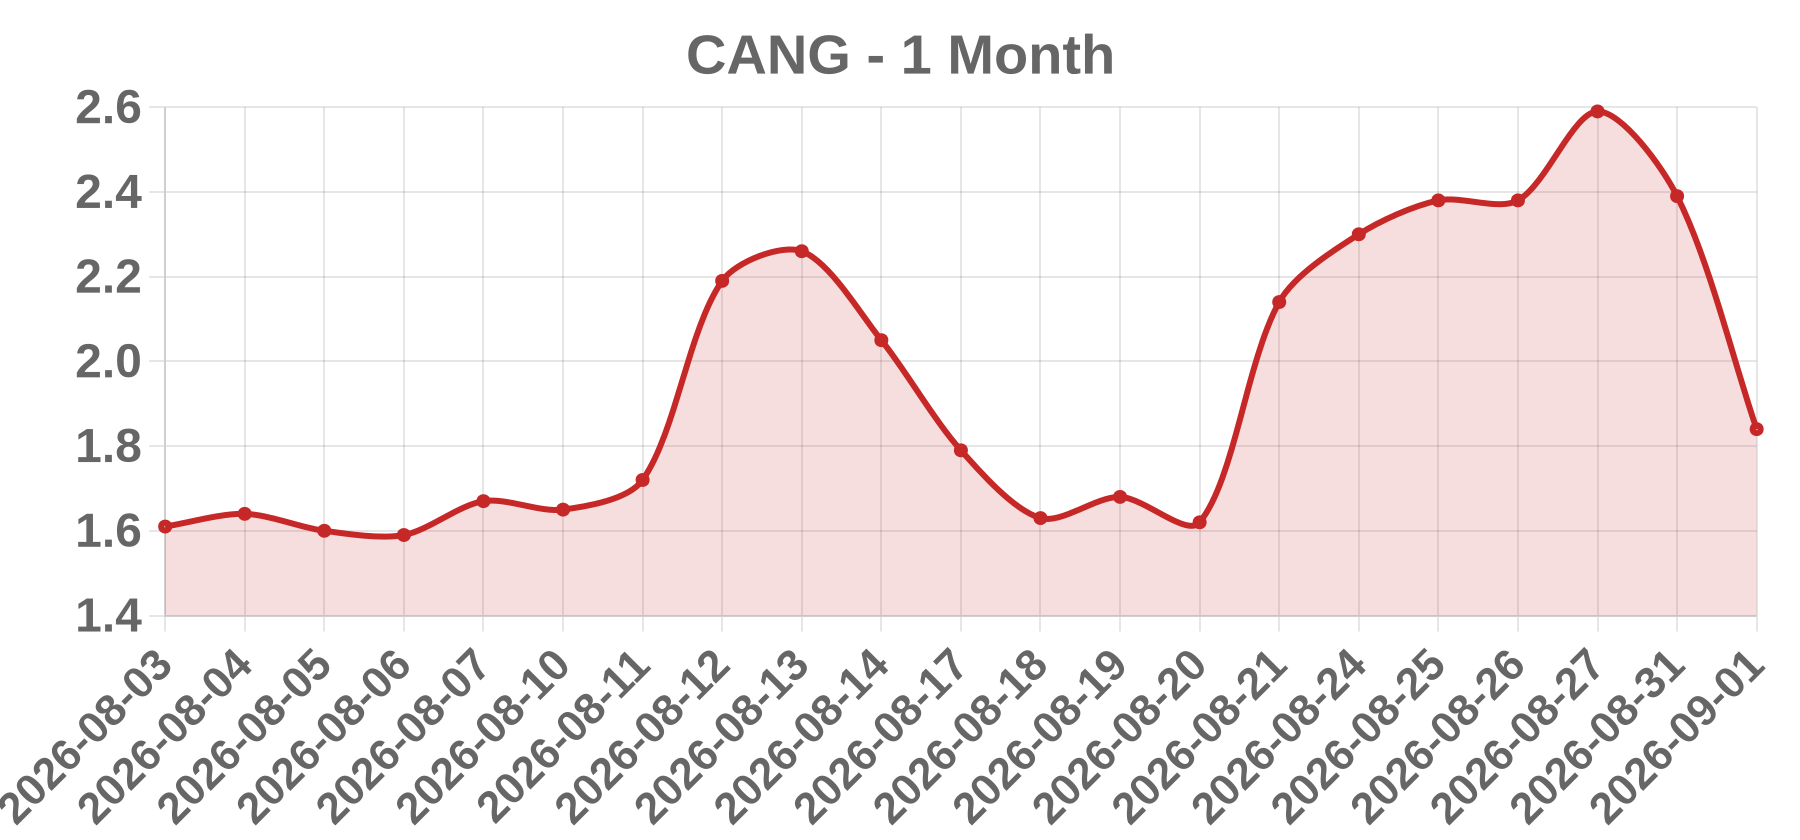
Business Cango Inc. (NYSE: CANG) is a Dallas, Texas-headquartered holding company that pivoted into bitcoin mining and energy infrastructure in November 2024. It operates self-mining and hosted hashrate across 40+ sites in North America, the Middle East, South America, and East Africa, and is transitioning toward AI compute via its EcoHash subsidiary. It also retains a legacy international used-car export business through AutoCango.com.
Today’s take Cango plunged 23.01% on September 1, 2026, closing at $1.84 (down from $2.39) in direct reaction to Q2 2026 results released August 31. The company reported a net loss of $81.6 million, driven largely by $51.4 million in non-cash impairment/disposal charges from deliberately shrinking its bitcoin-mining fleet by phasing out older S19 rigs. Revenue fell roughly 50% sequentially to $50.8 million ($47.4M from mining, $3.4M other). EPS of -¥13.37 missed consensus of -¥6.82 by ¥6.55. Operating hashrate stood at 27.58 EH/s (19.84 self-mining + 7.74 leased), producing 656 BTC at a reduced cash cost of ~$73,313/BTC (down ~5% QoQ), with 1,056 BTC held in reserves. Adjusted EBITDA loss narrowed to $10.7M from $154.1M in Q1. AI compute revenue from the converted Georgia GPU site (up to 3MW) is deferred to Q3 2026, removing near-term growth offsets. The stock is down ~85% over the trailing year with market cap near $98M, reflecting the ongoing fleet restructuring and the uncertain AI pivot.
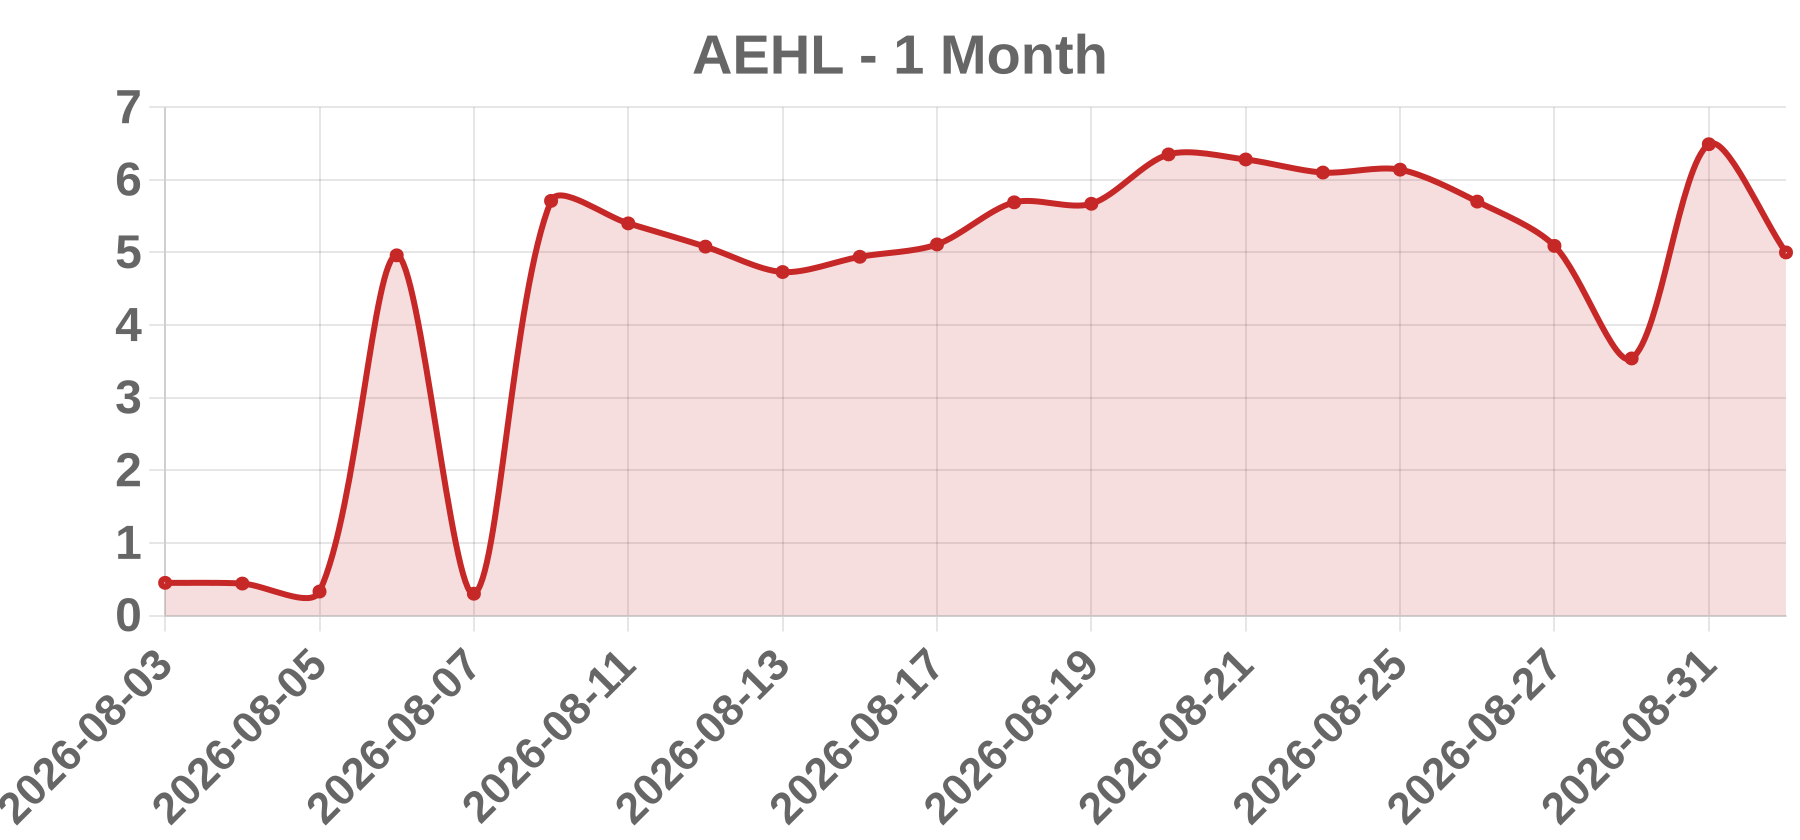
Business Antelope Enterprise Holdings Limited (NASDAQ: AEHL) is a diversified holding company headquartered in Jinjiang, China, formerly known as China Ceramics. Through subsidiaries it provides livestream e-commerce and business management/IT consulting services across China and the U.S., and manufactures ceramic tiles under brands such as Hengda, Hengdeli, TOERTO and WULIQIAO. The stock trades on the Nasdaq Capital Market.
Today’s take AEHL fell 22.96% to $5.00 on 9/1/2026 (open 5.30, high 5.44, low 4.60, vol 740,250), a sharp give-back after the prior session's unsustainable +83.33% parabolic spike to $6.49 on enormous 46.5M-share volume. That 8/31 reversal was itself a violent short-squeeze bounce off a deep selloff triggered by the 8/24 private placement of 15M Class A shares at $1.266 plus 15M warrants at $0.50 (an $18.99M offering, per the 6-K), which had knocked the stock down ~51% in a week (incl. -30.45% on 8/28 to $3.54). Short interest collapsed from 95,552 to 10,234 shares during the squeeze. By 9/1 the dilution overhang and weak fundamentals reasserted: TTM net loss -$13.54M, ~0.36% gross margin, Altman Z-score 1.78 (bankruptcy risk zone). A 1-for-16 reverse split (effective 8/10/2026) and the offering added 530% share count growth QoQ, pressuring the stock well below the 50-DMA ($9.92) and 200-DMA ($65.42). The -22.96% decline represents profit-taking/fade after the squeeze with the equity-dilution overhang dominating, a hallmark of low-float speculative names.
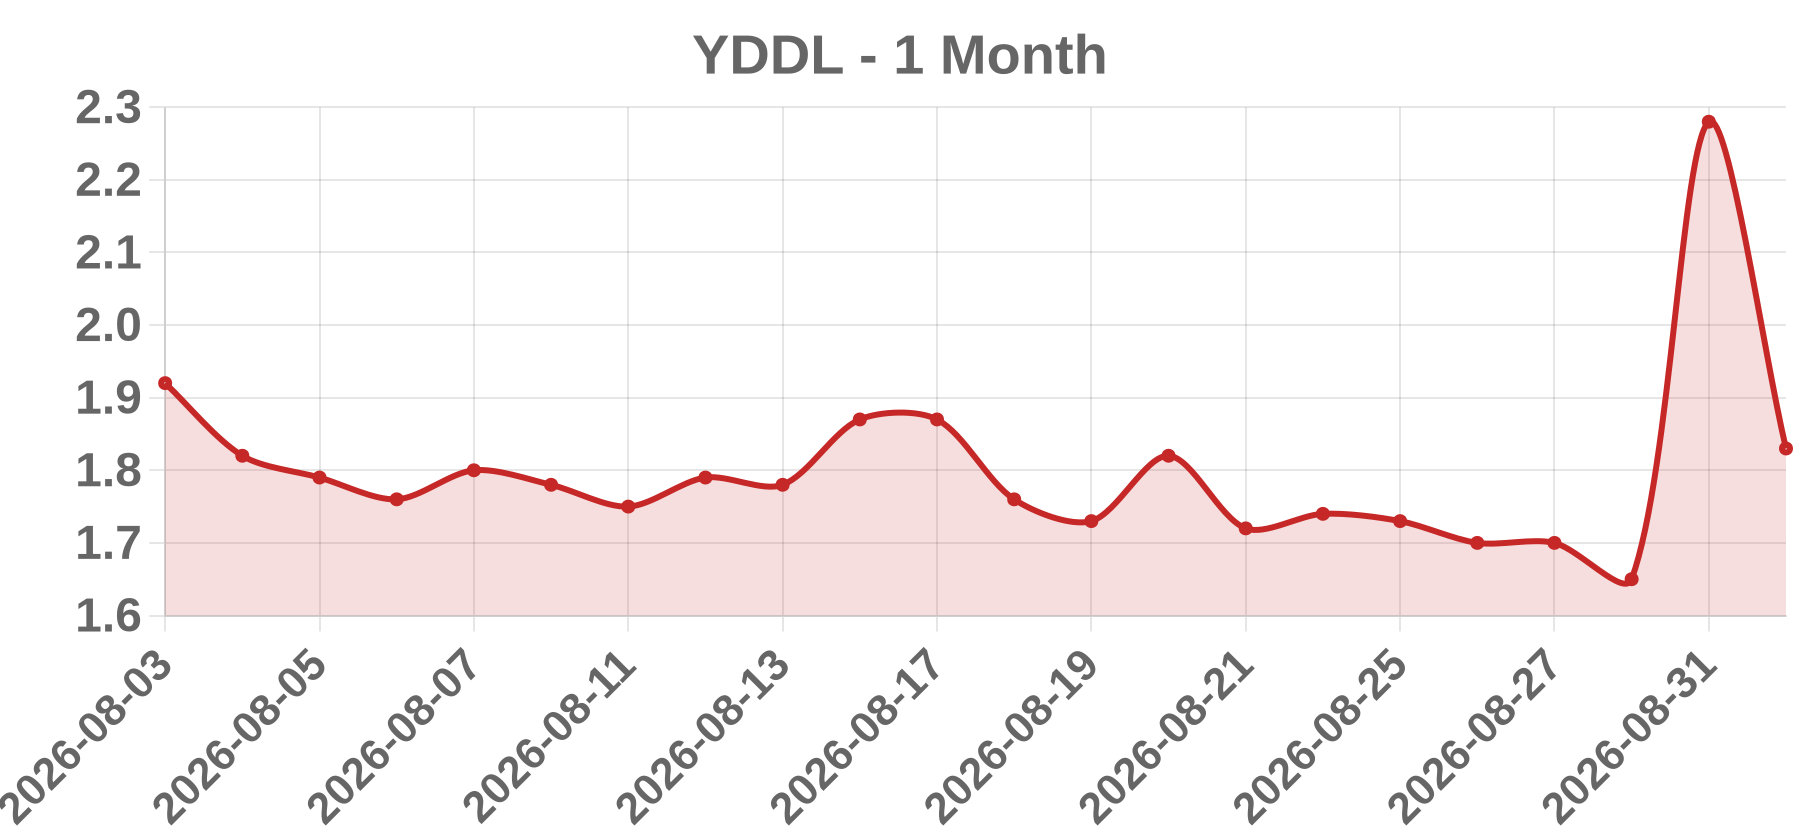
Business One and One Green Technologies, Inc. (NASDAQ: YDDL) is a Philippines-based recycler of e-waste and scrap metal, processing approximately 25,000-300,000 tons annually into copper alloy ingots, aluminum scraps, and other non-ferrous products from its Bulacan facility. The company holds the Philippines' only government-issued hazardous waste import and processing license under the Basel Convention framework.
Today’s take YDDL closed at $1.83 on Sep 1, 2026, down -19.74% (-$0.45), completing a classic momentum pump-and-fade. On Aug 31, 2026 the stock surged +38.18% to $2.28 on explosive volume of ~32.3M shares (vs ~4-40K typical daily volume), driven by retail/momentum traders reacting to 'clean-energy contract wins' narratives and a POS AM amendment (Form F-1 No. 333-294587) declared effective Aug 20, 2026. On Sep 1, YDDL opened at $1.94, hit an intraday low of $1.71 (-23.03%), and closed at $1.83 on only 842,264 shares — profit-taking unwinding the prior day's parabolic spike. The stock ranked among the top-10 Nasdaq decliners that day (no. 7 at -23.03% intraday), alongside other speculative small caps (AEHL, NCRA, RZLV, BRNX), indicating broad liquidation of momentum names. No company-specific negative news emerged on Sep 1; the decline was technical correction following a 39% intraday run on Aug 31 to $4.19 premarket before fading.
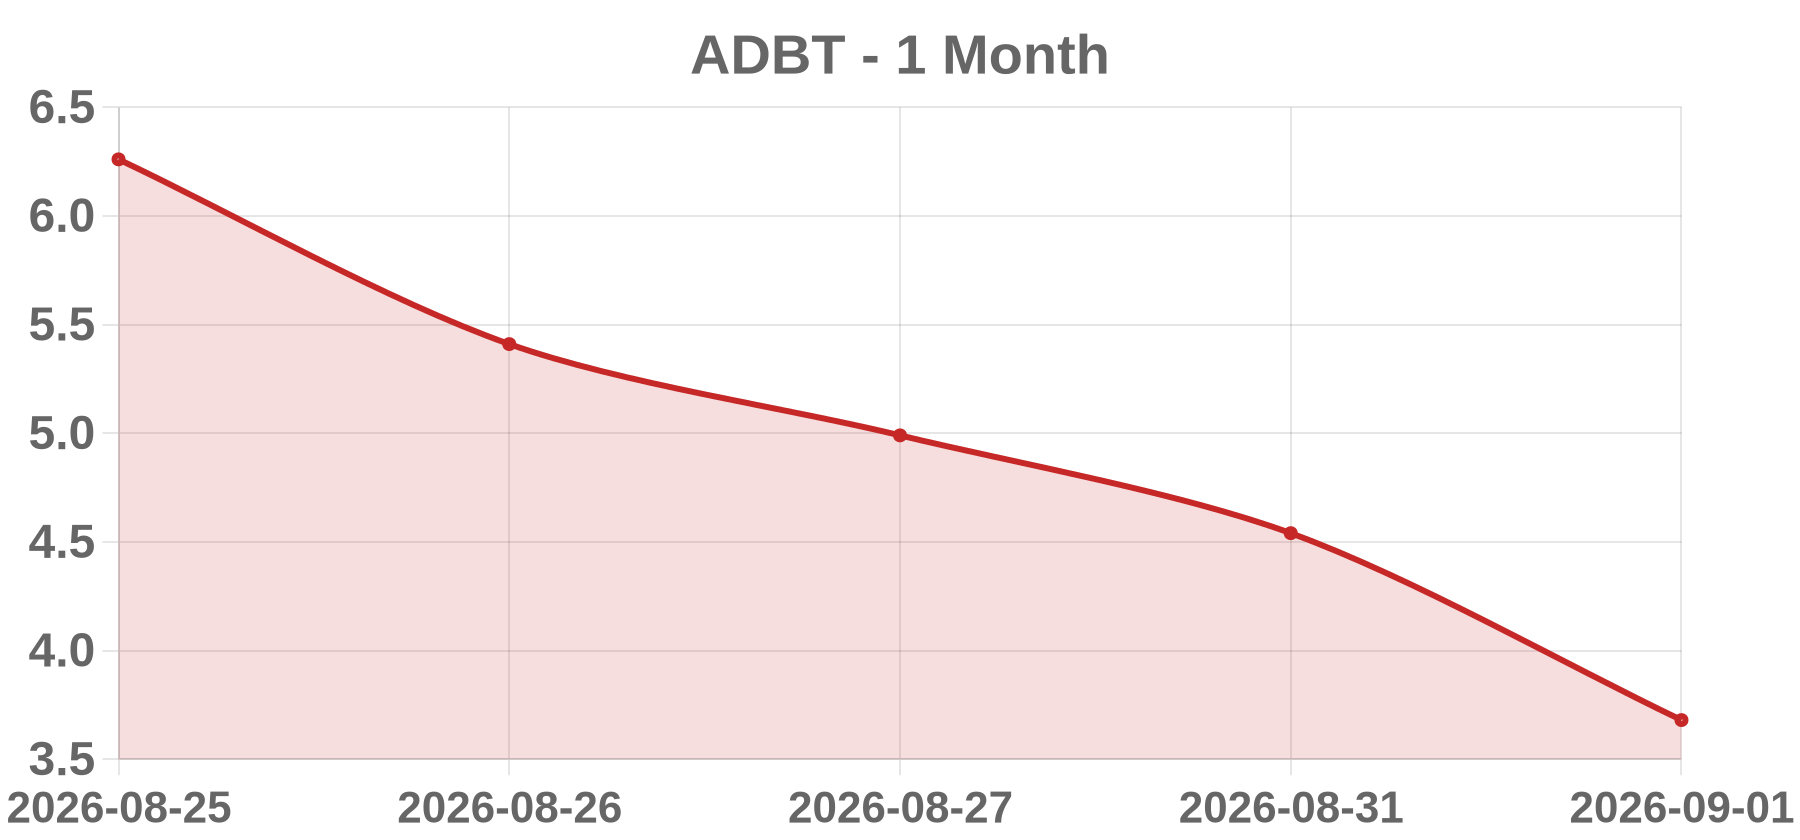
Business Advasa Holdings, Inc. (Nasdaq: ADBT) is a fintech payment holding company providing Earned Wage Access (EWA) and next-generation financial infrastructure via its Japanese operating subsidiary ADVASA Co., Ltd. It direct-listed on the Nasdaq Global Market on August 25, 2026.
Today’s take ADBT fell -18.94% on Sept 1, 2026, closing at $3.68 from a prior close of $4.54, continuing a violent de-rating after its Aug 25, 2026 direct listing on Nasdaq at a $12.00 reference price (implying roughly a $1.8B valuation). The stock lost more than 60% on its debut day and has posted double-digit percentage declines on nearly every session since. There was no company-specific news on Sept 1; the decline is a technical/valuation unwind. Against trailing revenue of only ~$18.7M and net income of ~$978K, the stock still trades at a P/S of ~99x and P/E of ~1,892x, with market cap of ~$1.79B, ~89.6% insider ownership, ~50.6M float, and just 2 employees. With only ~$1.7M cash, an Altman Z-Score of 1.47, and negative operating cash flow, there is no fundamental floor supporting the stock. Volatility was amplified by thin free float and price discovery in the first week of trading (52-week range $3.61-$13.20). The Aug 31 session (-9.9% to $4.09) and Sept 1 (-18.94% to $3.68) represent consecutive unwinding sessions.
Business 22nd Century Group, Inc. (NASDAQ: XXII) is a tobacco company focused on reduced-nicotine tobacco products. It manufactures and sells the VLN® low-nicotine cigarette (the only FDA-authorized low-nicotine combustible cigarette) and its Pinnacle value brands, and also provides contract manufacturing of conventional combustible tobacco products for third-party brands.
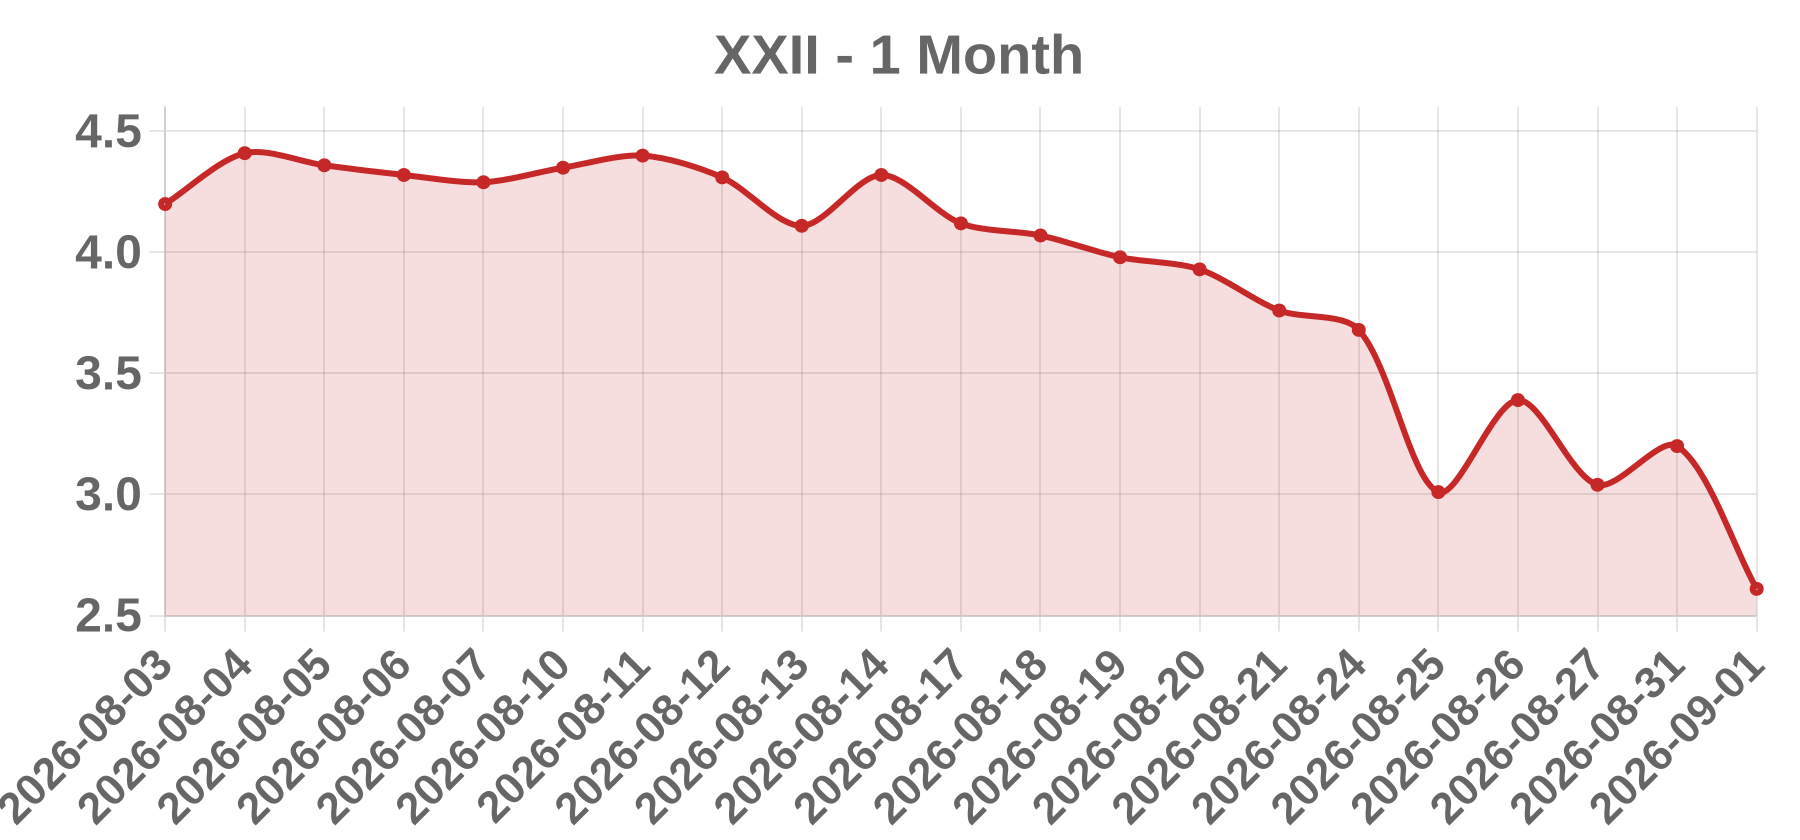
Today’s take XXII fell -18.44% to close at $2.61 on Sept 1, 2026, despite an upbeat same-day release of CEO Larry Firestone’s 2026 Mid-Year Shareholder Letter. The stock opened at $3.18, spiked to $3.80, then collapsed to a low of $2.51 before closing at $2.61 on massive volume (~430K-439K shares vs. ~41K 20-day average) — a spike-and-crash pattern on a microcap with a ~500K float and ~$1.86M market cap. The decline reflects continued severe fundamental deterioration: Q2 2026 (reported Aug 13) EPS missed at -$15.60 vs. -$6.00 est. (some sources cite -$104 vs -$6), revenue of $2.86M missed the $7.48M consensus, and the company is ~99.5% off its 52-week high after a 1:20 reverse split (June 12, 2026) and ongoing warrant/dilution overhang. With RSI ~28 (oversold) and only ~9.3K shares shorted (low short interest), the sell-off was driven by profit-taking/liquidity amid a hyper-speculative, diluted low-float tape rather than a single bearish news item.